Once you finish writing your codes using algorithms, constructs and syntax, you have to test these codes. Testing code refers to executing a program or its components. It intends to find errors, bugs or any unexpected behaviour. Coding involves validating the following:
- Code functionality
- Code correctness
- Code performance
This is to ensure it behaves as expected and meets the specified requirements. Testing code is essential when creating a simple app for several reasons:
- It helps uncover any bugs or errors in the code, allowing you to identify and fix them before releasing the application.
- It ensures the code functions as intended and reduces the chances of issues during runtime.
- It verifies that the code performs the desired operations and produces the expected results.
- It ensures the application meets the functional requirements and behaves correctly.
- It improves the reliability and stability of the application.
- It creates robust and error-free code, reducing the likelihood of crashes or malfunctions.
- It maintains code quality and enforces coding standards and best practices.
- It ensures the codebase remains manageable, readable and maintainable over time.
Variable examination and debugging techniques are crucial in code testing. They identify and resolve errors in code. When writing apps, it is common to encounter issues, such as incorrect output or program crashes. Examining the contents of variables and debugging the codes can diagnose and fix these problems. These ensure the app's reliability and functionality.
Variable examination refers to inspecting the values and state of variables at different points in a program. It involves checking the contents of variables to understand how data is being stored, modified and used within the program. On the other hand, debugging techniques encompass a set of practices and tools. You can use these techniques to detect, analyse and correct errors or bugs. They involve checking and repairing the code to understand why it is making incorrect results. They aim to locate the source of the problem and fix it.
Examining the values stored in variables can give you insights into the data flow and find the error source. Debugging allows for step-by-step execution of code, making it easier to identify logic errors. Additionally, examining variables provides valuable data to understand how the program behaves. It helps you modify code. Some of the common types of errors in programming include the following:
- Syntax errors: These occur due to incorrect language syntax. The compiler or interpreter can detect these errors.
- Logic errors: This is where the program runs but produces unintended results due to flawed logic.
- Runtime errors: This includes division by zero or accessing invalid memory locations, which can cause program crashes.
Debugging Techniques
There are various debugging techniques that you can use to detect and correct errors. These can include the following:

Printing and logging
Printing refers to displaying data on the console or terminal during the program execution. It allows you to output the values of variables, messages or any other relevant data to the console. By including print statements in your code, you can observe the values of variables. Likewise, you can track the execution flow and verify the program's correctness.
Here is an example:
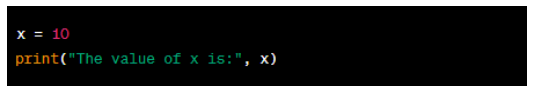
This code will display the following output on the console:

Printing is a simple and immediate way to inspect the values of variables. This can also monitor the program's behaviour at different stages of execution. Moreover, it is suited for small-scale debugging and quick inspections.
Here are some tips for you to use print statements effectively:
These include meaningful messages along with variable values to provide context. Likewise, it can aid in understanding the output. For example, instead of printing the variable value (x), you can include a message like 'The value of x is: 5'.
It should be where you suspect the issue may arise or where you want to check the variable values. This can be before or after critical operations, inside loops or at specific conditional branches.
You can use formatting options to enhance the output. This may include specifying the number of decimal places, aligning values or formatting dates and times.
On the other hand, logging is a more advanced technique for finding and recording data during program execution. It involves writing log messages to a file or another output destination rather than displaying them on the console. Logging provides more control and flexibility in managing and analysing the logged data.
Logging is useful for larger-scale apps or situations requiring constant and structured logs. It lets you capture a wide range of information, including the following:
- Variable values
- Timestamps
- Error messages
- Diagnostic details
Here is an example:
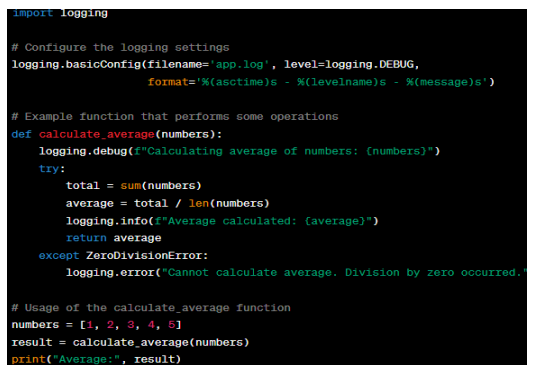
In this example, the 'logging' module is imported, and its settings are configured using the 'basicConfig' function. Here, you specify the log file name, log level (DEBUG in this case) and log message format.
The 'calculate_average' function is the average of a list of numbers. Inside the function, we use different logging statements to capture relevant information. The 'debug' level is used to log the numbers being used for the calculation. The 'info' level is used to log the calculated average. The 'error' level logs an error message if a 'ZeroDivisionError' occurs.
In this example, the log messages are written to the specified log file, app.log, in the specified format. Using different log levels can control the verbosity and severity of the logged data. In this example, the log file will contain a timestamp, log level and the corresponding log message. Here are some tips for using logging techniques:
Each level represents a different level of severity or importance.
- Many languages provide logging libraries or frameworks that offer comprehensive features for logging. These libraries often support different log levels, log file rotation, timestamps and others.
- Logging frameworks typically offer various log levels, including the following:
Each level represents a different level of severity or importance.
- DEBUG: This is used for detailed data during development and debugging. This level provides the most detailed logs.
- INFO: This is used to show the progress of the app or important runtime events. INFO logs are typically used for informational purposes.
- WARNING: This is used to show potential issues or situations that may lead to problems in the future. These logs highlight potential problems that need attention.
- ERROR: This logs errors or exceptional conditions that occurred during the code execution. ERROR logs show significant issues you must address.
- CRITICAL: This is used for critical errors that may cause the app to fail or result in severe consequences. CRITICAL logs represent the most severe level of issues.
- Logging frameworks allow you to configure various aspects of logging, such as:
- output format
- log file destination
- log rotation policies
These configurations enable you to customise logging according to your specific needs.
Debugging tools
Debugging tools are crucial in the development process. They provide features and capabilities to identify and resolve issues in code. One of the most common debugging tools is the integrated development environments (IDEs). Debugging tools are essential for diagnosing issues during the development process. They enhance code quality and ensure that software functions as intended.
IDEs are comprehensive software applications. They combine code editing, debugging and other tools into a single interface. IDEs typically offer the following debugging features:
- Setting breakpoints: Breakpoints allow you to pause the code performance at specific lines or conditions. This allows you to examine the state of variables and step through the code line by line.
- Stepping through code: IDEs provide options to step through the code, such as:
- Stepping over lines (skipping function calls)
- Stepping into functions (entering function code)
- Stepping out of functions (returning to the calling code)
- Variable inspection: During debugging, IDEs provide a way to examine the values of variables at various points. This allows you to track how the variables change and identify any unexpected behaviour.
Apart from IDEs, there are standalone debugging tools you can use with different programming languages. Here are some examples:
GDB is a command-line tool for debugging C, C++ and other languages. It provides features like breakpoints, stepping through code, variable inspection and more.
PDB is the built-in debugging module for Python. It lets you set breakpoints, step through code and inspect variables. Likewise, it lets you perform interactive debugging.
These tools offer a scale of features to simplify the debugging process. Setting breakpoints and stepping through code can help you examine the execution flow and the values of variables. This helps in identifying issues, understanding program behaviour and fixing errors.
Runtime error handling
Runtime error handling involves identifying and handling errors that occur during the execution. These errors are also known as exceptions. They can arise due to various reasons, such as:
- invalid input
- resource unavailability
- unexpected program behaviour
Here are some key aspects of runtime error handling:
Understanding runtime errors and exceptions
Runtime errors occur when the program encounters a condition it cannot handle. It results in abnormal termination or incorrect output. Exceptions are specific types of runtime errors raised when a specific condition occurs.
For example, a 'ZeroDivisionError' exception is raised when attempting to divide by zero in Python.
Implementing error handling methods
Error handling methods allow you to handle exceptions and prevent program crashes. These common techniques include the following:
Try-catch blocks
A try-catch block is a construct used for exception handling. It encloses the code that might raise an exception within the try block. It can also specify the exception types to catch in the catch block. This allows you to handle the exception appropriately and continue the program execution. Here is an example:
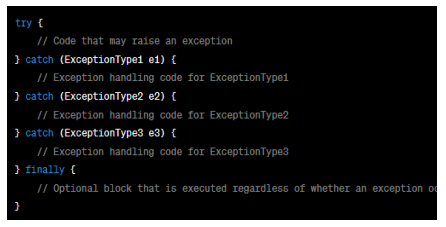
Here is a breakdown of the components:
- 'try block': This block contains the code that might raise an exception. It is the section where you want to check for potential exceptions.
- 'catch' block: Each catch block is associated with a specific type of exception that can occur within the try block. If an exception of the specified type is thrown, the corresponding catch block is executed. You can have many catch blocks to handle different types of exceptions.
- 'Exception Type': In the catch block, you specify the type of exception you want to handle. This can be a built-in exception type or a custom exception type.
- 'Exception Variable': Within the catch block, you can declare a variable to reference the exception object. This variable allows you to access information about the exception, like the error message or the stack trace.
- 'finally' block (optional): The 'finally' block is performed regardless of whether an exception occurred. It commonly cleans up resources, releases locks or performs other necessary actions.
Exception handlers
Exception handlers are code blocks specifically designed to handle exceptions. They can perform actions such as:
- displaying an error message
- logging the exception
- taking corrective measures to recover from the error
Runtime error handling is vital in creating robust and reliable apps. You can improve your program's stability and user experience using these methods. It allows you to expect potential issues and take appropriate corrective actions. Likewise, it prevents the program from crashing or producing incorrect results.
Conditional debugging
Conditional debugging is a technique that allows you to pause the program execution. This is based on specific conditions. It isolates and debugs specific code sections or scenarios where issues are occurring. Here are the key aspects of conditional debugging:
Conditional breakpoints
These breakpoints are triggered only when a specified condition evaluates to true. Instead of pausing the execution at every occurrence, you can set conditions based on variables, expressions or values to be met. This allows you to focus on specific situations or data states you suspect may be causing the issue. Here is an example:
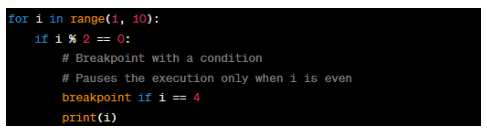
In the example, the breakpoint will be triggered only when the value of 'i' equals four. It allows you to examine the program's behaviour at that specific point
Watch expressions
Watch expressions check the values of specific variables, expressions or properties during debugging. Adding watch expressions can track the values and check how they change as the program executes. This is particularly useful when observing the behaviour of specific variables or expressions. They are relevant to the issue you are debugging.
Evaluating conditions
You can check expressions to understand their values and behaviour during debugging. This can help you understand why certain branches of code are executing or why specific behaviour is occurring. You can manually enter and check expressions in the debugger's console or watch them in real time using watch expressions.
Dynamic modification of variables
In some cases, it may be necessary to change the values of variables during debugging to test different scenarios or isolate the cause of an issue. Debugging tools often provide the ability to change variables at runtime. This ability allows you to change their values and observe the impact on the program's behaviour.
Conditional debugging provides a powerful way to focus your efforts on specific conditions.
Interactive debugging
This refers to the capability of debugging tools and IDEs to provide a real-time debugging experience. It offers various features that allow you to inspect the program's execution closely. You can also examine variable values and even change variables during debugging. Here are the key aspects of interactive debugging:
Breakpoints are markers you set at specific lines of code to pause the program execution at those points. When the program reaches a breakpoint, it stops. It allows you to examine the program's state at that moment. IDEs often provide a graphical interface for setting breakpoints, making it easy to enable or disable them.
Interactive debugging lets you step through your code line by line, executing it one step at a time. This helps you understand the program’s flows and how variables change at each step. You learnt about this in the previous discussion.
Aside from inspecting variables, you can also define watch expressions. This can check the specific variables, expressions or properties during the debugging session. They provide a way to keep track of important values and observe how they evolve as the program runs.
Interactive debugging also allows you to change the values of variables during the debugging session. This feature is useful when you want to test different scenarios. Likewise, it verifies the impact of changing a variable's value on the program's behaviour. Modifying variables can help you isolate and fix issues more effectively.
Interactive debugging greatly enhances the debugging process. It provides a more dynamic and interactive environment for analysing and troubleshooting code.
Detect Errors
To examine variable contents to detect errors, you can follow these steps:
- Determine which variables may be contributing to the error or behaving unexpectedly. This could be based on the specific error message or the part of the code where you suspect the issue.
- Insert print statements in strategic locations within the code to display the values of the variables. This allows you to observe their values at different points in the program execution. You can add print statements before, after or within specific lines of code to track the variable values.
- Use debugging tools or IDEs that provide features, such as:
- breakpoints
- variable inspection
- step-by-step execution
- Set breakpoints at relevant points in the code and run the program in debugging mode. When the program execution pauses at a breakpoint, you can inspect the variable values in real time. This will identify any discrepancies or unexpected values.
- Analyse the variable values. Examine the printed variable values to identify inconsistencies, incorrect values or unexpected behaviour. Compare the observed values with your expectations or the desired outcomes. Look for patterns or trends in the variable values that may show the error.
- Try to reproduce the error consistently by providing the same input or following the same sequence of steps. This allows you to focus on the specific conditions that trigger the error. Likewise, you should examine the corresponding variable values more closely.
- Narrow down the problem area based on the observed variable values. Identify any operations involving the variables that may be causing incorrect results.
Correct Errors
To correct errors based on a variable examination, you can take the following steps:
- Identify the source of the error based on the examination of variable contents. Then look for any inconsistencies, unexpected values or incorrect calculations that may lead to the error.
- Understand the expected behaviour or what the desired outcome should be. Then compare the observed variable values with the expected values or the program's intended logic.
- Analyse the variable values and the surrounding code to understand the main cause of the error. You should determine if it is a logical error, a data type mismatch, an incorrect calculation or any other issue related to the variables involved.
- Modify the code to correct the error. This may involve the following:
- fixing logical errors
- adjusting data types
- re-evaluating calculations
- revising any problematic statements related to the variables
- After making the corrections, test the code again with appropriate test cases to ensure you resolve the error. Check the variable values during testing to verify they align with the expected values.
Steps to use debugging techniques
Debugging techniques are essential for detecting and correcting errors in your code. Here are the steps you can follow to use debugging techniques to identify and fix errors effectively:
- Start by reproducing the error or unexpected behaviour in your code. This could involve the following:
- running the program
- executing specific steps
- providing certain inputs that trigger the error
Once you understand the problem clearly, you can proceed with debugging.
- Use breakpoints to pause the code execution at specific points where you suspect the error might occur. Setting breakpoints strategically can help you examine the state of your program at those points. Likewise, you can identify any inconsistencies or incorrect values.
- Once you have set breakpoints, step through your code line by line to observe the execution flow. Use features like stepping into or over functions to navigate through your code. This allows you to track the values of variables, identify any unexpected behaviour and pinpoint the exact error location.
- During the debugging process, inspect the values of variables at different points in your code. Check if the values are as expected or if there are any anomalies. If the values are incorrect, it can help you narrow down the source of the error and understand why it occurred.
- Error messages and stack traces give valuable information about the nature and location of the error. Analyse these messages to understand the root cause of the error. You should look for any error codes, error descriptions or line numbers that can guide you towards the problematic code.
- Define watch expressions for variables you want to check closely during debugging. It allows you to observe the values of specific variables or check expressions in real time as your program runs. This can help you identify unexpected changes or incorrect calculations that may be causing the error.
- While debugging, you may discover areas of your code to modify to correct the error. Once you have identified the source of the problem, make the necessary changes and observe the effect on the program's behaviour. Continuously test and confirm your modifications to ensure they resolve the error effectively.
- After applying the fixes, test your code thoroughly to ensure you resolve the error and that the program behaves as expected. Confirm the output, run different test cases and compare the results with your desired outcomes. This ensures the error has been successfully corrected.
Following these steps and using debugging techniques effectively can detect errors in your code. You can also understand and correct these causes to ensure your program functions correctly.
Watch
Watch this video to learn more about debugging techniques:

Testing is critical in programming. It involves evaluating the app’s functionality, correctness and performance. It verifies and validates code to ensure that it behaves as expected. Likewise, it ensures the app meets the requirements during the development phase.
Testing detects bugs, errors and unexpected behaviour in the code. Running different test cases can uncover and address issues before you deploy the app to users. It also ensures that the software functions correctly and produces the expected outputs. Thorough testing contributes to a better user experience. It ensures the software is reliable, performs well and delivers the desired functionality. Moreover, it reduces risks associated with software development. It allows developers to identify and resolve issues early in the development cycle.
You can use different types of application testing methods throughout the development process. These will address specific aspects of the application. These can include the following:

Unit testing
Unit testing focuses on verifying the individual components or units of code to ensure they function correctly. A unit is the smallest part of an application that is testable, such as a function, method or class. The steps involved in unit testing typically include the following:
- Identify the unit to be tested. This involves selecting a specific function, method or class to be tested.
- Write test cases. Test cases cover various scenarios and inputs that the unit should handle correctly.
- Execute the test cases. You can execute the unit with the test cases and then compare the actual and expected results.
- Analyse the results. Any discrepancies or failures are identified and debugged to fix the issues.
- Repeat the process. Unit testing is an iterative process. You can execute unit test cases to ensure thorough coverage.
Unit testing validates the functionality of individual units in isolation. It ensures they produce the expected outputs and behave as intended. Moreover, it detects defects early in the development cycle. Unit testing promotes code reusability and provides a safety net for refactoring or modifying code. Here are examples of unit testing frameworks:
- JUnit for Java
- Pytest for Python
- NUnit for .NET
Integration testing
Integration testing focuses on testing the relations between different components of an app. It ensures these components work together as intended. The integration of different parts does not introduce any errors or issues. You can follow these steps in integration testing:
- Identify the components. This involves selecting the components you will test together.
- Design test cases. Test cases cover various integration scenarios, including the following:
- data flow
- communication
- interdependencies between components
- Execute the test cases. The integrated components are executed with the test cases. Then you can compare the actual results with the expected results.
- Analyse the results. You must identify and resolve any integration issues or failures. It will ensure the proper execution of the integrated system.
- Repeat the process. Integration testing is performed iteratively as more components are added or modified.
This testing verifies the interaction and compatibility between different parts of the system. It ensures they work seamlessly together and detects issues. Here are examples of integration testing:
- testing the interaction between a database and an application
- testing APIs
- testing the integration of different software modules
System testing
System testing validates the behaviour and functions of an entire software system. It tests the system as it would be used in a real-world environment, covering all functional and nonfunctional aspects. Here are the steps you can follow:
- Define test objectives. This involves determining the goals and objectives of system testing. It should be based on the software requirements and specifications.
- Design test cases. You can create test cases to cover all system features, functionalities and use cases. Test cases include both normal and boundary conditions.
- Execute the test cases. You should test the system with the defined test cases. Then compare the actual results against the expected results.
- Analyse the results. You must identify any discrepancies or failures. Likewise, you should address them to ensure the system meets the defined requirements.
- Conducting regression testing. After fixing any issues, perform regression testing to ensure the fixes did not introduce new problems. You will learn more about regression testing in the next discussions.
System testing checks the entire software system's compliance with the following:
- Functional requirements determine what an app should do and the specific function it must provide to meet the users' needs. These describe the system's behaviour, features and capabilities.
- Performance expectations are the expected performance characteristics of an app. This includes factors, such as response time, throughput, resource use, scalability and reliability.
- Security measures are measures to protect the app from unauthorised access. These ensure the system and data confidentiality, integrity and availability.
- Non-functional aspects are the characteristics of an app that are not directly related to its specific functions. However, these are important for overall quality and usability
It identifies any deviations from the desired behaviour. Likewise, it uncovers integration issues and checks the system's readiness.
Acceptance testing
Acceptance testing verifies whether an app meets the specified requirements and is ready for use. It involves testing the following:

They are tested against the end user's expectations and business requirements. Here are the steps you can follow in acceptance testing:
- Define the criteria for acceptance that the application must meet.
- Create test scenarios based on user stories, requirements and real-world use cases.
- Prepare test data. You must set up the necessary test data to simulate realistic usage scenarios.
- Run the test cases to confirm the system's behaviour, features and usability.
- Compare the actual outcomes of the tests with the expected outcomes to identify any discrepancies.
- Document any defects or issues discovered during the testing process.
- Gather feedback from end users to ensure their satisfaction with the system.
- Repeat the testing cycle until all acceptance criteria are met.
Here are some examples of acceptance testing:
This test confirms the system meets their specific needs.
Alpha testing is performed by a group of testers, often within the development organisation. It is conducted in a controlled environment, typically at the developer's site. The purpose of alpha testing is to assess the functionality, usability and reliability of the application.
On the other hand, beta testing involves releasing a version of the application to a limited number of external users. These users test the application in their own environment. Likewise, it provides feedback on the performance, usability and issues they encounter. Beta testing identifies problems and gathers user feedback before the application's final release.
Regression testing
Regression testing verifies that changes to an app have not introduced new bugs in existing functions. It involves retesting the previously tested areas. This will ensure they still function correctly after you make changes. Here are the steps you can follow:
- Determine which system parts are affected by the changes made.
- Choose the relevant test cases that cover the affected areas.
- Run the selected test cases to verify the changes have not introduced any new issues or defects.
- Compare the test's actual and expected outcomes to identify any regressions.
- Document and address defects or issues discovered during regression testing.
- Repeat the testing cycle whenever you make changes to the app.
This testing ensures the changes made to the app system do not introduce new bugs or affect the existing functions. It helps maintain the system's quality and stability. Here are the examples you can follow:
- running automated test scripts on a web application after applying updates or bug fixes
- re-executing manual test cases on a mobile application following a software update
Functional testing
Functional testing validates the functional requirements and specifications of an app. It involves testing the system's functions or components. It will ensure they work as intended and meet the specified requirements. Here are the steps you can follow:
- Determine the system's functions or features you must test.
- Make test cases based on the functional requirements and specifications.
- Run the test cases to verify the system's functionality and behaviour.
- Compare the actual outcomes of the tests with the expected outcomes to identify any discrepancies.
- Document any defects or issues discovered during functional testing.
- After fixing the identified defects, repeat the testing process for the affected functions or features.
This testing ensures the app performs its intended functions accurately. Likewise, it ensures the app meets the specified requirements. Here are some examples of functional testing:
- testing the login functionality of an app to ensure users can successfully authenticate
- verifying that an e-commerce website can process and complete orders correctly
Performance testing
Performance testing assesses the following factors of an app under various load and stress conditions:
- performance
- responsiveness
- scalability
- stability
It measures the system's behaviour and resource use to determine its performance characteristics. Here are the steps you can follow:
- Identify the key performance metrics to measure the app's performance. These include the following:
- Response time measures how long an application respondsto a user's request or input. It is typically measured in milliseconds or seconds and is an important metric in assessing the performance of a system.
- Throughput measures the number of requests a system can handle within a given period. It represents the system's capacity to process and take a certain volume of work. Higher throughput shows a system's ability to handle a larger workload and process requests.
- Resource use refers to using system resources efficiently, such as CPU, memory, disk space and network bandwidth. It measures the extent to which system resources are used during the execution of tasks or processes.
- Set up the test environment to mimic the expected production environment.
- . Run the performance tests to measure and analyse the app's performance.
- Check system behaviour and collect performance data for analysis.
- Identify any performance bottlenecks or issues affecting the system's performance.
- Focus on the performance issues and retest to confirm the optimisations' effectiveness.
This testing assesses the system's performance characteristics. Likewise, it identifies issues and ensures the app can handle the expected workload and user interactions. This will ensure there is no performance degradation. Here are some examples:
- Load testing determines the system's behaviour under normal and peak load conditions.
- Stress testing checks the system's performance beyond its normal capacity to identify its breaking points.
Security testing
Security testing assesses the security measures and vulnerabilities of an application. It identifies potential security risks, weaknesses and vulnerabilities the attackers can exploit. Here are the steps you can follow:
- Determine the security requirements and standards that the system should follow. These can vary depending on the organisation and application.
- Perform vulnerability and penetration testing to identify potential security risks. Vulnerability testing identifies and assesses weaknesses in a software system or network. This proactively identifies potential security flaws that the attackers can exploit. On the other hand, penetration testing goes further than vulnerability testing. It simulates real-world attacks on a software system. This will assess its security measures and identify potential entry points.
- Verify the effectiveness of authentication and authorisation methods. Authentication confirms the identity of a user or system. It ensures that whoever requests access to a resource is who they claim to be. Here are examples of authentication methods:
-
performance
-
responsiveness
-
scalability
-
stability
On the other hand, authorisation grants or denies access to specific resources or functions. It is based on the authenticated identity and the associated permissions. It ensures users have the appropriate privileges to perform actions or access resources.
-
- Assess the system's handling and storage of sensitive data.
- Implement the encryption and secure communication protocols.
- Document and address any security weaknesses identified during testing. 7.
- Repeat the testing process to verify the effectiveness of the security fixes.
This testing is to identify and address potential security weaknesses in an app. It ensures the system's resilience against security threats and protects sensitive data. An example is evaluating the effectiveness of access control to prevent unauthorised access.
Authorisation Methods
Role-based access control (RBAC) is a security model used to manage access to resources in a computer system. In RBAC, access rights are assigned to specific roles. Users are assigned to one or more roles depending on their job responsibilities or permissions. Instead of assigning access rights directly to individual users, RBAC simplifies access management. It can associate permissions with roles and then assign those roles to users. This approach improves security and scalability by centralising access control rules. This makes it easier to grant or revoke access when users' roles change.
Attribute-based access control (ABAC) is a flexible access control model. It uses attributes of users, resources and the environment to make access control decisions. ABAC evaluates many attributes to determine if a particular access request should be granted or denied. These attributes can include user attributes (e.g. user roles), resource attributes (e.g. file type) and context attributes (e.g. time of day). ABAC provides fine-grained access control. This enables organisations to use complex access policies based on specific conditions.
An access control list (ACL) is a set of rules that define what permissions or access rights are granted or denied to users. ACLs are used in computer systems to manage permissions and control access to files, folders or directories. Each entry in an ACL typically consists of a user or group identifier and the corresponding permissions. By using ACLs, administrators can manage access control more granularly. Likewise, it ensures only authorised users have the permissions to interact with resources.
Usability testing
Usability testing evaluates an app's ease of use, user-friendliness and user experience. It involves testing the following to identify usability issues:
- system's interface
- navigation
- interaction with end users
Here are the steps you can follow for usability testing:
- Determine the specific usability objectives and criteria for testing.
- Design realistic scenarios that cover typical user interactions and tasks.
- Select representative end users to perform the usability tests.
- Have the test participants interact with the system and perform the defined scenarios.
- Observe the participants' interactions and collect their feedback on the system's usability.
- Identify and document any usability issues or challenges identified during testing.
- Use the collected feedback to make iterative improvements to the system's usability.
This testing ensures the app is user-friendly and intuitive and provides a positive user experience. It identifies and addresses usability issues that could impact user satisfaction and efficiency. Here are some examples:
- Testing the navigation and layout of a mobile application to ensure ease of use
- Assessing the clarity and readability of text content in a web application
Automated testing
Automated testing is a software testing method using testing tools and scripts. This executes test cases automatically without manual intervention. Likewise, this approach helps identify defects, verify functions and ensure the application's quality. The basic steps to follow in automated testing are:
- Choose the test cases to be automated based on priority, complexity and frequency of execution.
- Develop automated scripts using testing frameworks and tools, often using programming languages.
- Set up necessary test data, inputs and expected outcomes for the selected test cases.
- Run the automated scripts using testing tools, simulating user interactions, inputs and validations.
- Examine the test results for pass or fail status and log errors, and gather detailed reports.
- If failures occur, debug and modify scripts to fix issues and re-run the tests.
- Continuously execute automated tests whenever there are code changes. This ensures new features or fixes do not break existing functionalities.
Keep the automated scripts updated, reflecting any changes in the application.
The concepts and principles of testing remain the same across different languages. The types of testing mentioned earlier apply to various programming languages. However, the implementation and specific tools used may vary depending on the language and its ecosystem. It is best to consult the language documentation.
Simple tests to confirm if the code meets design specifications
To create simple tests to confirm if the code meets design specifications, you can follow these steps:
- . Familiarise yourself with the code's design specifications and requirements. This includes understanding the expected behaviour, inputs, outputs and constraints you should meet.
- Identify the test cases to confirm whether the code meets the design specifications. Test cases should cover different scenarios and edge cases to ensure comprehensive testing.
- Determine the input values or data that will be used to execute the test cases. This may involve preparing specific data sets, creating mock objects or setting up test environments.
- Determine each expected output or result for each test case based on the design specifications. This allows you to compare the actual outcomes from running the code with the expected outputs to determine if they match.
- Write the test code that executes the test cases and compares the actual and expected outputs. This can be done using a testing structure or manually writing test scripts or functions.
- Run the tests against the code being tested. This involves executing the test code and observing the results.
To conduct simple tests to confirm if the code meets design specifications, you can follow these steps:
- Set up the necessary test environment, including any required dependencies, configurations or data.
- Run the test cases against the code being tested. It involves providing the test inputs, executing the code and capturing the outputs or results.
- Compare the actual results from running the code with the expected results defined in the design specifications. You should identify any discrepancies or deviations.
- Analyse the test results to confirm if the code meets the design specifications. This includes identifying any failures or issues encountered during the testing process.
- If you identify failures or issues, debug the code to understand the root cause and fix the problems. This may involve modifying the code, addressing logical errors or adjusting configurations.
- After fixing any issues, rerun the tests to confirm if the code meets the design specifications. You should repeat the testing process until all test cases pass and the code meets the specified requirements.
The steps may vary depending on the testing approach, tools and frameworks.

Test documentation is crucial in the software testing process. It provides a systematic and organised approach to record and track testing activities and results. Test documentation refers to recording and describing the testing activities, procedures and outcomes. It is a valuable resource for future reference for the testing team and stakeholders.
This serves as a formalised record of the testing activities. It provides a structured approach to organise, communicate and track the testing process. Well-documented tests enable the reproduction of test scenarios and results. If there are issues or defects, they provide the necessary data to replicate the steps and analyse the problem. Moreover, it helps in sharing knowledge and lessons learnt. Team members can refer to these to understand the testing process and project context.
Test documentation can include the following:
- test plan
- test cases
- test execution
- test logs and reports
- defect tracking
Test plan
A test plan outlines the approach, objectives, scope and strategy for testing an app. It provides a roadmap for the testing activities and ensures you cover all necessary aspects of testing. The test plan guides the testing team and stakeholders. It communicates the testing strategy and sets expectations for the testing process. Here are the components of a test plan documentation:
- Test objectives: They define what is to be achieved through testing.
- Test scopes: They identify the features, modules or functions to be tested.
- Test strategies: They outline the approach and methodologies for testing.
- Test environments: They describe the hardware, software and network setup required for testing.
- Test deliverables: They list the documents, reports and artifacts you will produce during testing.
- Test schedules: They define the timeline and milestones for the testing activities.
- Test resources: They identify the roles, responsibilities and skills needed for testing.
- Risk assessments: They identify potential risks and mitigation strategies.
- Test exit criteria: They determine the conditions you must meet to consider testing complete.
Writing a test plan involves the following tasks:
- gathering information about the project
- consulting stakeholders
- understanding the requirements
You should organise the document clearly with sections logically structured and easily navigable.
Test cases
Test cases are detailed descriptions of specific test scenarios that you will execute. They specify the input data, the steps to perform and the expected results. Test case documentation ensures that testing is systematic, thorough and reproducible. A typical test case includes the following:
- Test IDs: They are unique identifiers for each test case.
- Test descriptions: They are concise descriptions of what the test case aims to achieve.
- Test steps: They are detailed steps to be executed during the test, including the necessary inputs.
- Expected results: These are the expected outcomes or behaviours after executing each step.
- Actual results: These are the actual outcomes observed during test execution. Likewise, these will be filled in later.
- Test status: They are a field to track the status of the test case, such as pass, fail or pending.
Effective test case involves clear language, well-defined steps and expected results. Test cases should be easily understandable by both testers and other stakeholders.
Test execution
Test execution documentation involves recording the details of actual test execution. This includes getting the test case execution status, issues encountered and other relevant data. During test execution, testers record the following data:
- Actual results: These are the observed outcomes of each test step.
- Test execution status: This is whether the test case passed, failed or is pending.
- Test environment details: These are pieces of information about the test environment, including hardware, software and configurations.
- Test execution logs: These are detailed logs capturing the steps executed, timestamps and extra notes.
- Defects or issues: These are any problems or deviations encountered during test execution.
This documentation provides a record of the following:
- activities tested
- progress tracked
- issues identified that need to be addressed
You can check the test case documentation template for the test execution documentation.
Test logs and reports
Test logs are records of all activities related to testing. They capture information such as:
- Test case execution details
- Test environment configurations
- Defects identified
- Other relevant data
Test logs track the testing progress, analyse trends and provide a historical record of the testing activities. Test reports are summary documents that provide an overview of the testing results. They typically include metrics, such as:
- test coverage
- defect density
- pass or fail ratios
Test logs and reports help stakeholders understand the status of testing and decide. Here is an example template of a test log and reports:
| Test ID | Test Description | Test Execution Date | Execution Status | Remarks |
|---|---|---|---|---|
| TC001 | Login Function | 04-01-2023 | Pass | N/A |
| TC002 | Add to Cart | 04-01-2023 | Fail | Issue: Item not added to the cart. |
| TC003 | Checkout Process | 04-01-2023 | Pass | N/A |
Defect tracking
When conducting testing, it is common to encounter app defects or issues. Defect tracking documentation records and manages the identified defects throughout the testing process.
Key aspects of defect tracking documentation
Here are the key aspects of defect tracking documentation:
Documenting identified defects or issues
When a defect is identified during testing, it should be documented systematically. It includes providing the following information:
- A detailed description of the defect
- Steps to reproduce it
- Any relevant supporting information, such as screenshots or logs
Tracking defect status and resolution
Defect tracking documentation should include the status of each defect, such as:
- open
- in progress
- fixed
- closed
It should also track the progress of defect resolution. It includes information about who will fix the defect and associated target dates.
Using defect-tracking tools or systems
Many organisations use specialised defect-tracking tools or systems. This streamlines the process of documenting and managing defects. These tools provide centralised storage of defect information. It allows for easy tracking of defect status and resolution. Here are some commonly used defect-tracking tools and systems:
Jira is one of the most popular issue and project-tracking tools used by software development teams. It allows teams to create, assign, prioritise and track defects and other tasks. Moreover, it offers customisable workflows, extensive reporting and integration with various development and collaboration tools.
Bugzilla is an open-source bug-tracking system widely used in the opensource software community. It provides a web-based interface to report, track and manage defects. Likewise, it offers features like email notifications, advanced search capabilities and custom fields.
GitHub Issues is an integrated issue-tracking system. It allows you to create and manage issues, track bug fixes and link issues with code changes using version control features.
Here is an example of defect-tracking documentation:
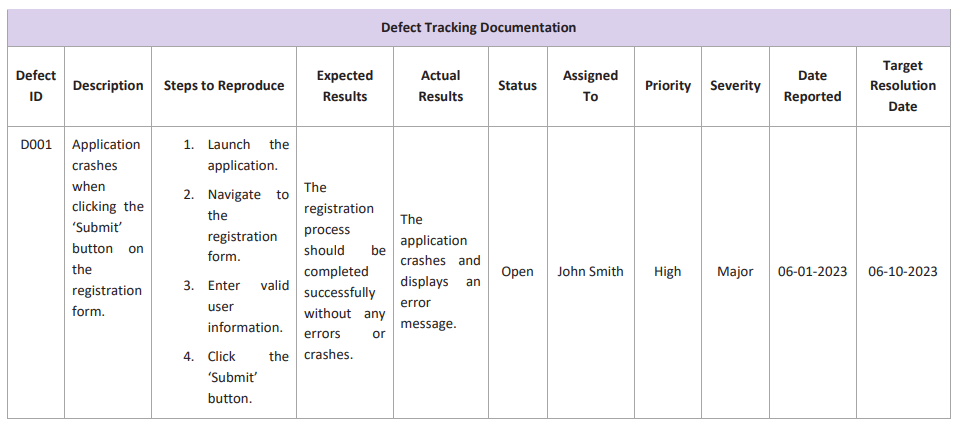
You should take note of the following when filling out this document:
Severity
Severity refers to the impact or seriousness of a defect on the system's functionality. It indicates how severely the defect affects the normal operation of the app. Likewise, it prioritises the resolution of defects based on their impact. The severity levels can include the following:
- Critical: The defects cause the system to crash or result in severe data corruption, making the software unusable.
- Major: The defects significantly impair the system's functionality. Likewise, it can cause incorrect results but does not lead to a complete system failure.
- Moderate: The defects have a noticeable impact on usability or performance but do not hinder the core functionality.
- Minor: The defects have a minor impact on the system's functionality or usability and can be easily tolerated.
Assigning the appropriate severity level to a defect helps you understand the potential impact on the system. It helps you prioritise its resolution accordingly.
Priority level
Priority level refers to how defects should be addressed or fixed. It indicates the urgency of resolving a defect. The priority level helps in managing the defect resolution process efficiently. The common priority levels can include the following:
- High: The defects need immediate attention. They significantly impact critical functionality or business operations.
- Medium: The defects moderately impact functionality or usability but can be addressed soon.
- Low: The defects have minimal impact or are cosmetic. They can be deferred for later resolution.
You should follow a process to document actions carried out and test results. The process is a systematic approach to ensure clarity and completeness. Here are the steps to follow:
- Provide general information about the test, such as:
- test case ID
- test name
- test objective
- any relevant references or dependencies
- State the environment where you conduct a test, including the following details:
- Operating system
- Hardware configurations
- Software versions
- Any other relevant setup information
- Document the specific steps followed during the test execution. Each step should be described clearly. It should outline the actions taken and the inputs provided.
- For each test step, record the actual outcome or result observed during the test execution. This should accurately reflect what happened when you performed the test.
- If any issues were encountered during the test, document them in detail. This may include the following:
- unexpected behaviour
- errors and error messages
- failures
- any other relevant observations
- Attach any supporting documentation or artifacts relevant to the test, such as:
- logs
- screenshots
- data files
- additional notes
- Review the documented actions and results to ensure accuracy and completeness. Verify that the information provided aligns with the actual test execution and any observed issues.
- Use a standardised format or template for documenting test actions and results. This promotes consistency across different tests and makes it easier to review and analyse.
- If you made any changes or updates to the test case or its results, ensure the documentation is revised accordingly. Keep the test documentation updated as the project progresses.
Following these steps can effectively document the actions carried out during testing. It will accurately record the results obtained. This documentation is a valuable reference for future analysis, reporting and troubleshooting purposes.
Quiz