Bar or Gantt charts are a commonly used way of graphically representing a project schedule. Gantt charts are named after Henry Gantt who used bar charts extensively in the Second World War to plan the scheduling and control of military operations. For most purposes, bar and Gantt charts are the same thing.
A typical bar chart consists of columns and rows. The left column contains the task list. The other columns represent time intervals - days, weeks, months or years. The duration of each task is shown by drawing a horizontal bar along the timescale, starting at the date when that task should start and finishing at the date by which the task should be completed.
Relationships and dependencies between tasks are shown graphically by the positioning of the bars. For example two parallel bars indicate that two tasks will be done at the same time. One bar following another indicates that the task associated with the first bar must be completed before the task belonging to the second bar can be started.
Where resources (eg labour and equipment) allow, project managers often aim for work to be done on two or more tasks at the same time in order to shorten the overall duration of the project.
Monitoring multiple projects
| Days | 5 | 10 | 15 | 20 | 25 | 30 | 35 |
|---|---|---|---|---|---|---|---|
| Residence 1 | |||||||
| Foundations | |||||||
| Concrete slab | |||||||
| Brickwork | |||||||
| Carpentry | |||||||
| Residence 2 | |||||||
| Foundations | |||||||
| Concrete slab | |||||||
| Brickwork | |||||||
| Carpentry | |||||||
| Residence 3 | |||||||
| Foundations | |||||||
| Concrete slab | |||||||
| Brickwork | |||||||
| Carpentry | |||||||
This simple Gantt chart represents the construction of three similar houses in a new residential estate. It demonstrates how a concreter may complete the pouring of a concrete slab on one house and then move to the next house requiring similar work. There is a similar process for the other tasks shown in the chart.
It is desirable to minimise skilled labour from moving off-site when there is work to be done on nearby constructions. This can save a great deal of time. If subcontractors move to another location, it can be difficult to ensure their return for the next stage of the project.
Network systems or PERT charts
A network diagram is also known as a PERT Chart (Program Evaluation and Review Technique). They are used to organise and coordinate tasks within a project and can be done by hand or by using a software package such as Microsoft Project. Below is an example of a PERT chart.

Sequence of activities
The plan of the project will determine the sequence of the activity. In any project, several different sequences could be used to accomplish the project, depending upon the strategy of the supervisor, considering the project conditions.
Distinct reasons may exist for the supervisor choosing one sequence over another. For quality reasons, the supervisor may want to pour the slab without a pour back between the existing and new slabs. Sequence 1 (below) would facilitate that condition. When selecting a particular sequence, it may be necessary to compare durations and costs associated with the sequence.
Sequence 1: Mobilise crane
- Remove tilt-up walls to be relocated, store on site
- Build temporary weather partition at end of existing building
- Excavate for footings
- Prep and pour footings
- Prepare subgrade
- Pour slab on grade
- Slab cure
- Prep and pour panels on slab
- Mobilise crane
- Lift panels into place
- Set joists and deck
- Backfill at "pour-backs"
- Pour concrete slab at "pour-backs"
Sequence 2: Footings
- Excavate for footings
- Prep and pour footings
- Prepare subgrade
- Pour slab on grade
- Slab cure
- Prep and pour panels on slab
- Mobilise crane
- Remove and relocate existing panels
- Lift new panels into place
- Set joists and deck
- Backfill at "pour-backs"
- Pour concrete slab at "pour-backs"

A schedule is a listing of the goals, tasks, and deliverables of a project in project management, usually with intended start and finish dates. These objects, connected by dependencies and scheduled activities, are often calculated in terms of resource allocation, budget, and length. Schedules are widely used in the project planning and project portfolio management components of project management.
The schedule creator should provide a time estimate for each job before a project schedule can be produced and a resource list with availability for each resource.
The following conditions must be fulfilled for a project schedule to be healthy:
- The schedule must be revised continuously (weekly fits best).
- The value of the EAC (Estimation at Completion) must be equal to the base value.
Planning
Project planning is part of project management, which includes the use of timetables such as Gantt charts to schedule and then report progress in the project setting.
Initially, the scope of the project is specified and the necessary methods are decided for completing the project. Following this step, the durations are identified and grouped into a work breakdown structure for the different tasks required to complete the work.
Project planning is also used to coordinate multiple project fields, including project schedules, job loads, and team and person management.
Using an activity network diagram that allows identification of the critical path, the logical dependencies between tasks are established. Using project management software, float or slack time can be determined in the schedule. The required resources can then be measured and costs can be allocated to each resource for each task, providing the overall cost of the project.
Adjusting the schedule
At this point, to comply with the project goals, the project schedule may be tailored to achieve the required balance between resource use and project length. The project schedule becomes what is known as the baseline schedule, once defined and approved. Throughout the project's life, progress will be calculated against the baseline timeline.
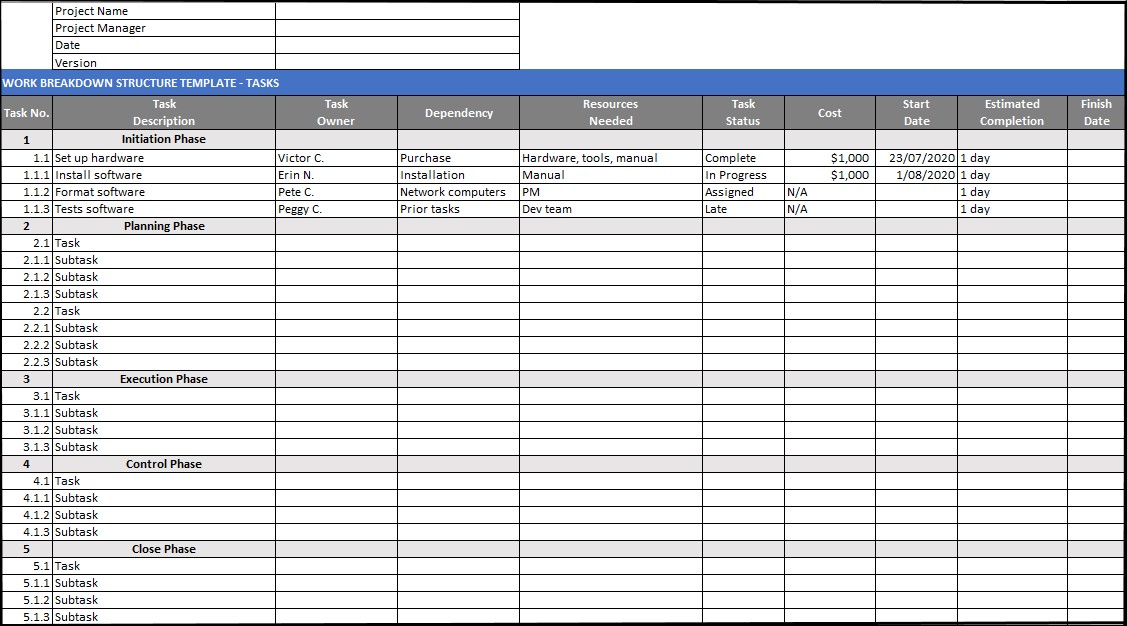
Work Breakdown Structure (WBS)
Elements on a schedule may be closely linked to terminal elements of the Work Breakdown Structure (WBS), the Work Statement, or a List of Specifications for Contract Data. A work breakdown structure enables subordinate costs for activities, materials, etc. to be summed up into their successively higher parent tasks, materials, etc. A summary of the task to be performed is created for each aspect of the work breakdown structure.
The following example of WBS includes tasks, task owners for clear accountability, required resources, tasks status, the cost associated with each task, start date, estimated completion date and finish date:
The following project schedule is an example that includes a list of tasks, time allocation, required human resources, material suppliers and required plants and equipment:
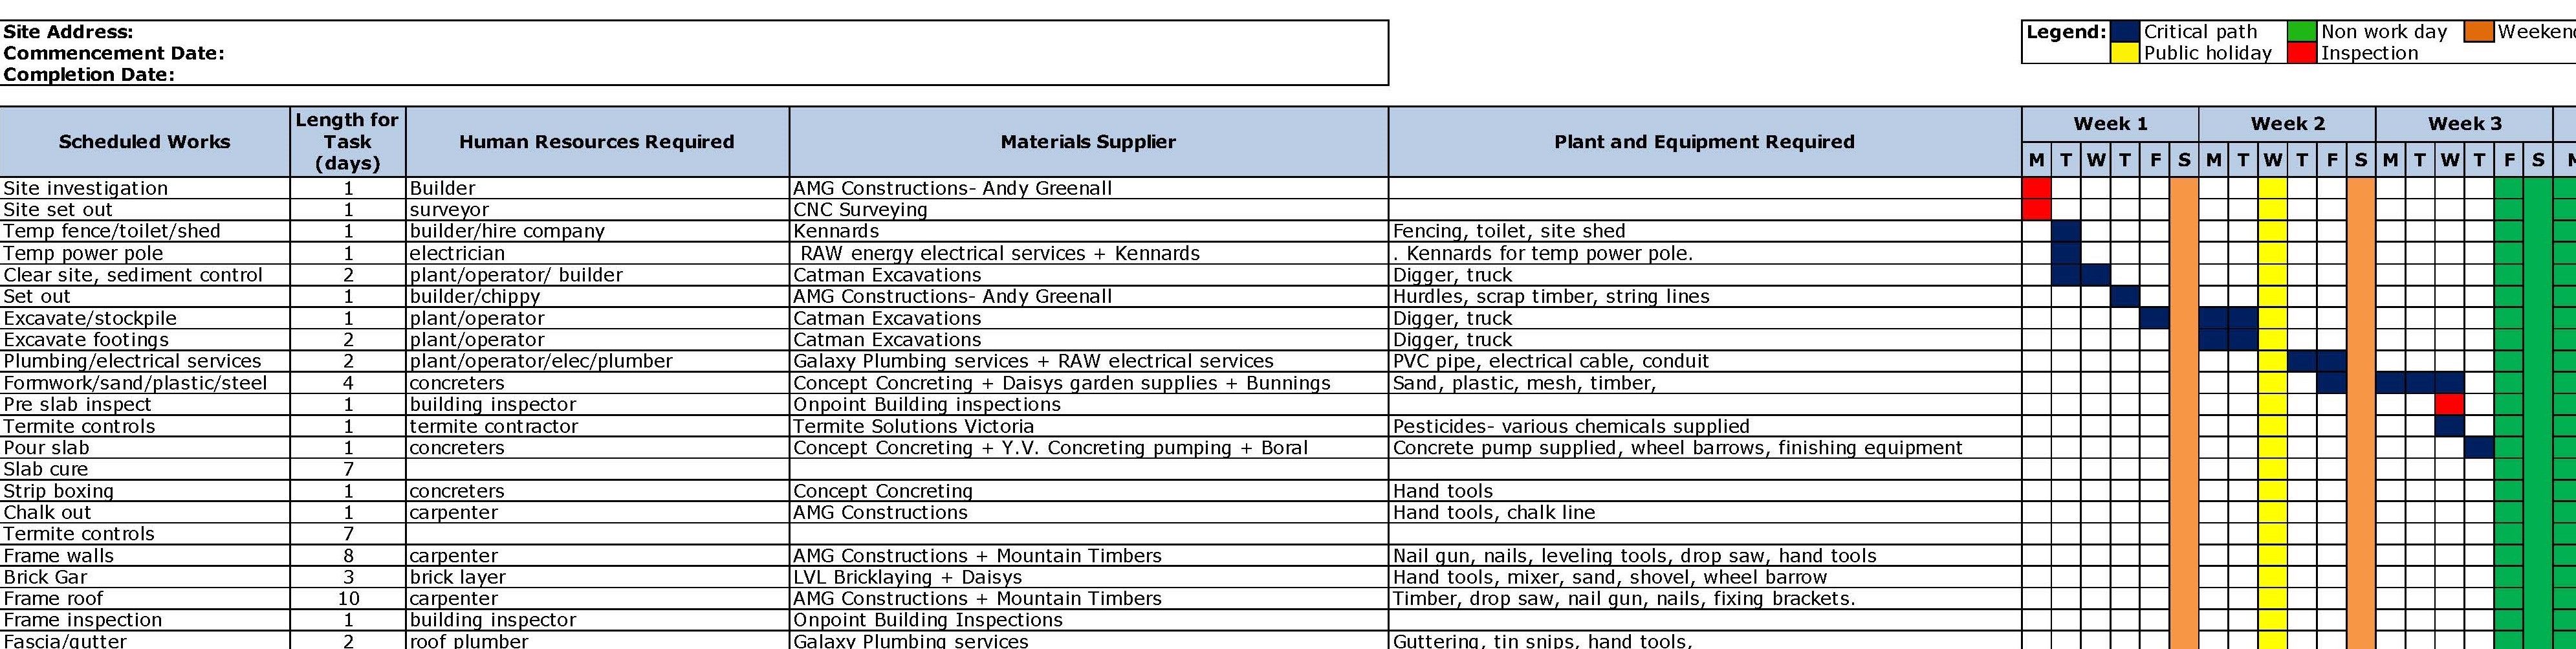
You can download a similar project schedule template from the Additional Resources, at the end of the module.
How to create a WBS in Excel?
The simplest way to create a WBS is using Microsoft Excel. Simply add the required headings and the project details as shown in the examples above. You will need to manually change the colour of the cells for the visual presentation of time allocation.
Another, more advanced way of creating a WBS chart is by using WBS Creator, which is an Excel template that will help to populate the information in a visually appealing way.
The following video will explain how to create a WBS using WBS creator. The template used in the video can be downloaded from here.
Project scheduling software
There is a very wide variety of software available to support the project management process.
In the past, these programs have been standalone desktop versions - good for high quality output. However more recently, internet based versions have begun gaining popularity. The advantage of ‘cloud' based products is that scheduling work can be undertaken more collaboratively, by multiple team members, at different locations and on a range of devices.
When choosing an application, ensure that the software can correctly identify your project’s ‘critical path’. A few examples have been given below.
Microsoft Project
One of the most popular, Microsoft Project includes user-controlled scheduling, task assignments, resource planning, and automated project status updates. It can integrate with Microsoft products, such as SharePoint, Excel, and Word.
Watch this 5-minute tutorial video to learn how to create a basic Gantt chart in Microsoft Project 2016:
Basecamp
Web-based project management tool that allows collaboration and progress tracking via any internet browser. Includes a public message board and personal messaging. Automated email notifications can be triggered any time a change to the project is made.
This short video explains collaboration and progress tracking in Basecamp:
QuickBase
Cloud-based software can import data from a variety of sources, such as Excel spreadsheets. It includes customisable forms and project templates, automated email notifications and advanced reporting. Access is through any internet browser.
This 3-minute video, which is the first part of a video series, explains the core features and functions of Quick Base:

The critical path method (CPM) is the most common scheduling technique used. The minimum completion time for a project is determined by this approach along with the potential start and end times for the project activities.
The critical path method calculates the cumulative length of the activities along the path. This reflects the minimum time needed for a project to be completed. If the critical route is delayed, that would mean that the completion of the project would take more time. Each activity is then connected to previous and subsequent activities with a wide list of activities, specifying that each activity has at least one other activity that must be completed before beginning the next one.
The start date and the end date are allocated to the events or tasks. They create a network of activities as the assignments progress from one to another.
To create a critical path plan, you need to do the following:
- Create a list of duties or events
- Assign durations to each activity and then assign durations to each activity
- Connecting the events in a logical order to each other, using unique types of relationships
When planning a schedule, it always comes down to thinking about the job processes and all the activities that need to be done and then allocating time for each of these tasks. If they will overlap or if they need to have time to move between them, you need to imagine what tasks would follow from each other.
You have a more formal method of preparation by producing a timetable.
The calculation phase of the CPM schedule defines the series of activities that take longer than any other series of activities to complete. The ‘critical path’ of the plan is this set of tasks and it specifies the minimum time for the project. Critical path operations must be completed on schedule or the overall end date of the project may be extended.
Using a project planning application is the best way to build a critical path process schedule. There are several of these, as previously mentioned.
A scheduling program is often included in many forecasting or construction software packages. So it might be prudent to purchase a program that covers all of your needs if you are looking at purchasing programs for your construction business.
Using the critical path method, the sequence of construction project activities is created. There could be delays in one of the vital route assignments as the project progresses. If this is the case, then the essential direction of the program must be modified to the schedule. The completion date of the project would be influenced by any delays or savings in the Critical Path tasks.

The project schedules may be long term in duration (ie contract length) or further broken down into medium term schedules (90 days) or short range schedules (2 week) for construction planning purposes.
The detailed Construction Schedule should show sufficient information to indicate the planned sequence and the method and duration of each activity with a high degree of accuracy. However the tendency with computerisation to break down work into every minor detailed task or subtask is to be avoided as this tends to make the schedule less usable.
Monitoring the project schedule
It is imperative that a project schedule be monitored and adjusted on a rolling basis to reflect any amendments to the project completion date due to variations or alterations to the scope of work. These adjustments should be agreed with the Principal and recorded as adjustments to the contract period.
As a minimum, schedules should be monitored monthly at meetings with client or their representatives, or weekly at meetings with subcontractors on site. The detail construction schedule is marked up to reflect the current status of each task to facilitate discussion on whether the project is ahead or behind schedule.
Adjusting the schedule and critical path
Adjusting the schedule and critical path of a project is not a simple task, you will need to communicate any changes through to trades, suppliers and the client. The critical path shown below can be moved when project delays occur. Some typical project delays include:
- Weather
- Supply of materials (lack of)
- Inability to have trades on site
- Strikes and economic movements