Set-out grid
In determining set-out grid and levels, you must be familiar with construction drawings and set-out procedures. Starting with a regular grid of squares enables you to build a set-out grid rapidly. It is the basic form of positioning used in fieldwalking and in geophysical surveys.
Before construction can commence, a set of construction drawings must be provided by an architect. These construction drawings should include the site layout plan and floor plans. The plans would then have grid lines with corresponding dimensions. The grid lines allow the reader to make references in terms of position or location of various elements in the project.
A surveyor would then set-out grid lines on the construction site. The surveyor will acquire a survey plan that indicates the true coordinate control points near the construction site and then transfer and establish new control points if necessary. From these control points, grid lines can then be established on the construction site.
The surveyor’s field team will usually set up the gridline reference points a few metres away from the building perimeter. Gridline reference points are placed as far as possibly marked on a permanent structure; otherwise, the team can drive a wooden peg into the ground and mark the grid line reference point on top of the peg.
After the grid lines have been set-out, the team will then have a drawing made out based on the grid lines they have established.
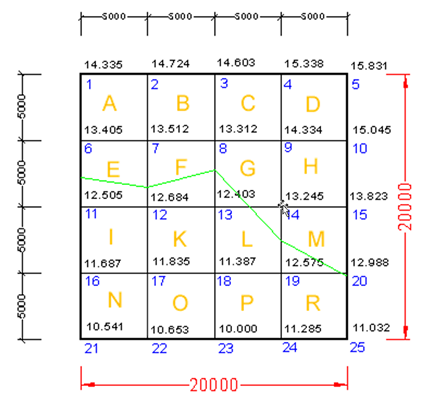
Sample grid drawings
The image shows a typical survey using grid point levels.
Set-out levels
To progress towards finding the correct location to dig trenches and build frames, you need to understand the following steps to determine set-out levels.
Temporary benchmark
A temporary benchmark is a good place to start for a building set-out. If possible, the benchmark should reference a known datum through an ordnance point. Otherwise, use a permanent feature such as a manhole cover or a firmly driven post as a reference.
The benchmark is typically shown by a peg, highlighted with fluorescent paint and somewhere convenient to use but protected from damage.
Locate the benchmark at a low point on the site so height measurements will all be above the benchmark, and therefore have positive value. If there are structures lower than the benchmark, then negative height values will be needed, and this introduces a potential source of error.
Vertical elevations above the benchmark should be expressed in metres to three decimal places, that is, to the nearest mm.
Baseline
Now the elevation has been set with a temporary benchmark, a baseline can be set. The baseline is a straight reference line, typically showing where the building’s corners are located. This line will often coincide with the site boundary line or parallel to a road or curb.
Horizontal controls
Horizontal controls are a set of points that refer to a specific point or benchmark to help with the set-out, particularly for where the building’s corners will be. These points show the horizontal location of key parts of the plan, ignoring the elevation which is covered by vertical controls.
Vertical controls
Vertical control points are based on an elevation benchmark or datum, or, in some cases, a road or other land feature. They show the correct heights or site levels and usually placed during surveying using equipment such as a theodolite.
As stated earlier, these levels should be expressed on any plans in metres to three decimal places. The intended level should be shown in a box and existing levels without. The exact position for any level should be shown with an “x” or a “+”.
Building layout
With a simple building layout, such as a rectangle, the outline can be marked out with 50 by 50 mm timber corner posts driven firmly into the ground. A string line can be attached to a nail driven into the corner posts. Alternatively, ranging rods may be used between corners. To determine where other corners are, a theodolite, site square or builder’s square can be used to set 90-degree angles.
Between the corner posts, the wall position can be marked out with dry lime powder or spray paint. Corners can also be shown with profile boards, typically between 0.6 to 1 metre in height and held square with a cross board.
For more complex building layouts extra care is needed as errors can be exacerbated as there will be more length runs and corners. Even small errors can compound. It may be easier to layout a rectangle, larger than the entire building and subtract sections to end up with the final layout. This should help keep external walls parallel and corners correctly angled.
Trenches
Once the layout has been completed, excavation is required for a concrete pour. This needs to be planned carefully so the corner posts are not bumped and their position compromised. The excavation of trenches establishes the location of the walls. The required trench width is often indicated with a line of dry lime powder for hand excavations, or a centre line marked for machine excavation.
The profile boards mentioned earlier need to be set at least 2 m clear of the trench positions. These indicate the line of the walls and assist accurate trenching. Further, the elevation of the profile crossboard relates back to the benchmark or datum. Cords may be strung between the crossboards to show precise vertical and horizontal positioning.
To help with the concrete pour, pegs are driven into the bottom of the trench. The tops of the pegs are used to show the height of the concrete strip and therefore indicate when the pour should stop.
Corners are shown where the cords intersect and these points are also shown with mortar spots on the foundations. Spirit levels should also be used for accuracy.
Finally, the trenches need to be cut carefully to help avoid the possibility of them caving in, especially if they are left open for some time.
Reduced level excavations
From the set-out of the baseline a reduced level area can be determined. The area to be excavated can be marked with dry sand or lime powder. The following method can be followed to control the depth of the excavation. Setting level sightlines along an area to be excavated then allows a profile board called a traveller to be used. A traveller can be moved along the sightlines, with the lower edge of the traveller showing if the excavation depth is correct. The height of the traveller is the elevation of the sightlines plus the required depth of the excavation.
Framed building
A framed building is usually set-out from the baseline showing the location of a wall as discussed above. The frame is usually related to a grid and the intersections of the grid lines shows the location of isolated or pad foundations. The grid layout may require the use of an instrument such as a theodolite and marked out with pegs. Similar to reduced level areas, excavation may be required, and the same method using a traveller profile board can be used.
When constructing a building on a sloping block, it may be necessary to cut and fill the block so that you have a level surface to build on.
Before doing this, you will need to have a contour plan to calculate where to cut and fill and the volumes necessary to remove or bring in for the level to be attained.
To start the process, you will need to mark out and determine the levels on a grid on the block of land. Then you can take readings of the levels and, from there, transfer these to a plan and then draw a contour map with the necessary heights noted.
Contour plans must align with grid levels, specified tolerances, and stated contour intervals. You must therefore know all the functions of these concepts.
Contour plan
Contour plans are critical during the project planning stage. They are plans drawn to a suitable scale showing the physical nature of the site. It uses elevation contour lines to indicate the form or shape of the site’s surface. Elevation contours are imaginary lines connecting points with the same elevation above or below a reference surface, which is typically sea level.
Contour plans also show features surrounding the site, such as highways, rivers, streams, lakes, borders, place names, mountains, and much more. Earlier maps display information such as trails, buildings, villages, mountain elevations, and survey control points.
Grid levelling
To quantify the shape of a landscape, a method for determining the elevation of a set of points is required.
Points at regular intervals along the ground are referenced to a benchmark. This method of plotting observations and making grids is called grid levelling.
Specified tolerances
A specified tolerance is the range of acceptable error between the measured value and the true value. When comparing measurements, the difference between the maximum and minimum dimensions is called the "tolerance". The permissible range of errors prescribed by law is often referred to as tolerance. For example, if a value is shown as ‘60 (+0.045 -0.000)’ is written on a drawing, the ‘+0.045 -0.000’ shows the tolerance of the upper and lower limits. The upper limit would then be 60.045 while the lower limit is 60.000.
One of the reasons tolerances are determined is to find a compromise between the cost of construction and the expected uses of the construction. When accuracy increases, the construction cost often increases. To retain functionality quality, tolerances must be set accordingly.
Contour interval
The contour interval is the vertical difference between any two consecutive contour lines. For example, on a map used for hiking, the contour interval is typically 2m. However, the interval can vary depending on the scale of the map, the terrain and the purpose of the map.
For flat terrain, the interval may be 0.25 m or 0.5 m and for hilly areas, the interval may be 5 m or 10 m.
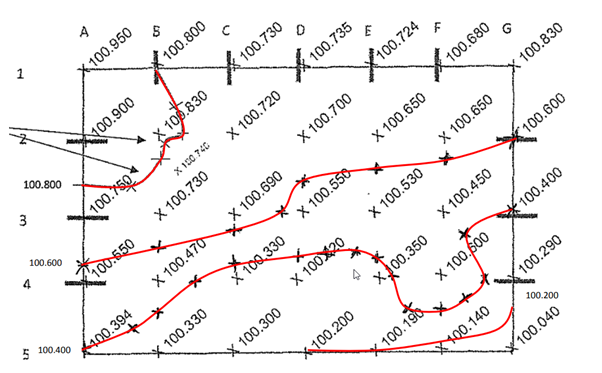
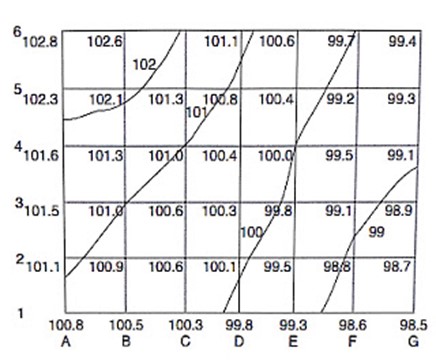
Sample topographic contour plans
Preparing contour plans
There are two ways to prepare a contour plan:
Cross-section method
Using the cross-section method involves setting a control or reference line at the centre of the site, then laying out and staking a grid. The elevation is determined at each stake in the grid relative to the benchmark. After all the elevations have been established and the points located on a scaled-down map, contour lines are drawn based on the expected contour interval using interpolation between points of known elevation. Interpolation is a mathematical method to locate contours using the raw data collected at the site.
Trace contour method
The trace contour method starts by establishing points of elevation as the cross-section method, but in this case, a hand-level or other level is used to stake the contour lines on the site at the desired level.
Computer-aided design
Computer-aided design (CAD) uses computers in creating, modifying, analysing, or optimising designs. CAD can be used in building and construction and has, historically, increased productivity, improved design quality, and improved documentation.
There are software applications that designers can use to prepare contour plans. These software applications include:
- AutoCAD
- SOLIDWORKS
- FreeCAD
- CATIA
- Autodesk Inventor
Which software application an organisation uses for CAD depends on the features an organisation needs for their projects, how much the software application costs, how easy each software application is to use, and many other factors. Consult your supervisor to determine which CAD software would be the best to use in preparing contour plans.
Determining surface area
The surface area of a site can be determined once a site survey is complete. An entire site profile can be seen from the resulting contour plan and site map. If the site survey data is held within a software package, there may be functionality that gives surface are, otherwise you will need to apply mathematical formulas using measurements from the plan to determine the area. The formulas you may need include the areas for triangles, trapeziums, or bounded by an irregular curve.
Calculate cut and fill volumes
If your site is too uneven for your construction project, cut and fill is a common solution. Recall from an earlier section that this process involves earth being excavated and removed (cut) where the elevation is too high and added (filled) where the elevation is too low. Ideally, this process moves earth from one part of the site to the other, rather than taking earth away or bringing in new fill.
Determining the volume of earth to be moved during the cut and fill process step is important as it will help you decide which excavation method to use and estimate the subsequent cost.
There are manual methods to calculate the cut and fill volumes, or alternatively, software products can use site survey data to generate cut and fill maps and level optimisation.
However, if you are not using software, manual calculation and estimation are required. Different estimation methods are available to determine cut and fill volumes. Some of these techniques are described below:
Cross-section method
A common method of estimating the cut and fill volume is the cross-section method. This method uses a two-dimensional cross section of the existing land profile and compares it to the proposed land profile. At regular intervals, the difference between these are averaged, and the average is multiplied by the distance to the next cross section. This gives the volume for a section. This is repeated for each section to get to the total volume for the cut and fill. Remember to keep track of whether the profile difference means cut or fill so these are not muddled when finding the final volume. Spreadsheeting software such as Microsoft Excel or Google Sheets could help with the calculation.
As you can imagines, this method is quite time-consuming. The accuracy of this method depends on the distance between the sections and the smaller the distance the greater the accuracy. The trade-off is that more calculation is required to attain greater accuracy.
Grid method
Another manual calculation method to determine the cut and fill volume is the grid method. This involved superimposing a grid onto the site plan. For each grid cell, determine the difference between the existing and proposed elevations. Multiply this value by the area of the grid cell to find the cut or fill volume required for the cell. Repeat this process for each cell in the grid and find the total for all cells and this is the site cut and fill volume. Again, spreadsheet software may help.
This manual method is also time consuming and the accuracy depends on the grid spacing, and therefore the cell dimensions. Closer grid spacing will yield greater accuracy but requires more calculation.
Automated method
Accurate cut and fill volume calculations can be completed more swiftly utilising earthwork software that can work with site survey data. This is not to say that an automated method will always yield greater accuracy, as a meticulous manual approach can achieve that, but rather, it is a time efficient method.
Automated systems may utilise more sophisticated algorithms such as the triangular prism method, commonly used for earthworks. In this method, the site profile is divided into a continuous surface of connected triangles. The same is done for the proposed profile. A map of these merged triangulations is created with cut and fill volumes for each triangular area calculated. Adding these together gives a cut and fill volume for the site.
Linear measurement
Linear measurement in surveying is the determination of the distance between two points on the earth's surface and is one of the basic operations of surveying.
Two examples of surveying that use linear measurements are:
- chain surveying
- traverse surveying
The distance between two points can be measured directly, or through calculation
|
Types of linear measurements |
Explanation |
|
In this method, the distance is measured during the actual fieldwork using a chain or a measuring tape. |
|
In this method, the distance is computed indirectly using the tacheometer. |
Horizontal angular measurement is the determination of the angle between two survey lines. It is commonly used in traverse surveying.
Linear and angular measurements are necessary because a survey line can only be plotted if both its length and direction are known. The angular measurement determines the direction of a survey line.
Principles of linear measurement
Survey work on construction sites follows a set of established fundamental principles that help reduced the potential for error and reduce compounding errors. The principles can be summarised as follows:
Working from the whole to the part: This principle aims to reduce errors by considering the site as a whole that is split up into parts. If an error is made, it is contained to a section or part.
Form well-conditioned triangles: Another error reduction principle is to run one backbone line across the site and divide the sections into well-conditioned triangles. These triangles only contain angles between 30° and 120°, ideally, as close to equilateral as possible. Using this shape reduces the effect of errors in angle measurements.
Economy of lines: Reduce the number of lines as much as possible to reduce the complexity of the work and avoid natural features, obstacles, and steep slopes. Use a sufficient number of check lines to monitor for errors.
Geometry
Geometry is a branch of mathematics that studies the shapes, positions, and dimensions of objects. Surveyors measure distances, angles, and directions between points by using geometric principles of measurements.
Trigonometry
Another branch of mathematics is trigonometry that studies the relationships between side lengths and angles of triangles. Trigonometry is used when measuring the height and angles of land or the elevations of certain points of a mountain.
Grid lines in trigonometric calculations
The sine quadrant includes grid lines of the trigonometric functions. It can be used to find trigonometric values.
Grid lines in geometric calculations
Grid lines can be found in a cartesian coordinate plane with an x-axis and y-axis. Paper with grids printed on it can be purchased as graph paper. The cartesian plane allows geometric shapes to be plotted and trigonometric functions to be plotted. Shown in this way facilitates finding solutions.
Offsets in geometric calculations
An offset is the constant amount added to a shape. When plotted on a plane, or grid, the effect is that it is shifted, up, down, left or right, or combinations of these. The entire shape is shifted and will retain exactly the same shape. Its location with respect to other features will change.
Consider a construction site where two identical houses are to be built. Their plan of the second house can be copied from the first and placed further along the site. The distance the second house is placed from the first is the offset.
Offsets in trigonometric calculations
Two sinusoidal waves may also have different offsets from each other, meaning their average values are different but their shapes are the same. Their graphs are shifted up or down (that is, an increased or decreased y-value).
The vertical change, also known as the sinusoidal axis value, is used to measure this offset. Bear in mind that, unlike other functions, the y-intercept is not denoted by this vertical change. Substituting zero into a function is a way to correctly evaluate the y-intercept.
Right triangle in trigonometric calculations
Before we look at the detail, we can start by setting some definitions.
A right triangle, or right-angled triangle is one with a 90° angle, otherwise known as a right angle. The mathematical relationships in this section only apply to right triangles. Note, that any non-right triangle can be divided into two right triangles to allow the following rules to be applied to each.
The naming conventions use a capital letter to indicate angles, and a lower case letter to indicate a side. The lower-case letter showing the side reflects the angle opposite it.
For example, the right hand side, side ‘a’, is opposite the angle shown as ‘A’.
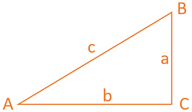
The relationship between the side lengths of a right triangle is known as Pythagoras’ theorem.
The hypothenuse is the longest side and is opposite the right angle, and in this example is ‘c’. Pythagorean Theorem states the relationship between the square of the lengths as: a²+b²=c².
Example.
For a right triangle, one short length is 3 m long and the other 4 m as shown.
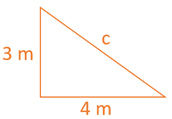
Using Pythagoras’ theorem:
c² = a²+b²
c² = 3²+4²
c² = 9+16
c² = 25
c = 25 = 5
therefore the unknown length, in this example, the longest side is 5 m.
This next section will explore the trigonometric functions.
Review this triangle and note an angle, shown as the Greek letter theta (). The side next to this is labelled as the adjacent and there is an opposite side and the hypothenuse.
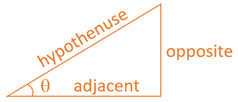
Regardless of the size of the triangle, the ratios between the side remain the same. It is this concept that gives us the trigonometry equations:
tan(θ)=opposite/adjacent sin(θ)=opposite/hypothenuse cos(θ)=adjacent/hypothenuse
The values for tan, sin or cos of an angle can be determined using a calculator, a calculator app on a smart phone, or entering it on a browser search.
This means that for any right triangle, if you know two lengths, or one length and one angle, you can calculate all the other angles and lengths.
As you would expect, these mathematical relationships will be very useful in surveying.