Everyone may be aware that the marketing world is full of fun and creative campaigns to engage and persuade consumers to purchase their product or services, however few understand that this is only part of the picture.
Marketers will spend countless hours creating budgets and analysing data to determine the success of their campaigns and the profit of their business. Excel is one tool used to help marketers measure performance and determine what may or may not be working within their current practices.
Many businesses understand the importance of marketing, so they spend money on campaigns to successfully grow their business. While spending too little on marketing is easy, it is also possible to spend too much or spend what little budget you have on the wrong kind of marketing.
When planning and preparing budgets for social media campaigns, it is important to note that there may be many moving parts as the market is ever-changing. This may impact the campaign's success as they have to adapt to marketing trends and external influences.
Budgeting is important as it:
- helps businesses plan effectively by allocating funds
- meet business goals and objectives
- reach a large audience.
The video below will explain the concept of social media marketing and how businesses use this to market their products/services
There is no right or wrong way to budget for social media campaigns. Businesses may choose completely different routes, however setting strategies and budgets will ensure you have the best chance of succeeding.
Below are a few steps to help guide businesses in the right direction when planning and preparing budgets for their social media campaigns.
Goal setting
The first step in creating a budget is to set your Business Goals.

Ultimately, businesses have two main goals when looking to market their products/services through social media platforms. These are:
Awareness
- Traffic
- social follower growth
- Brand awareness
- New products or services
- Social engagement
- Content shares.
Sales
- First-time buyers
- Repeat sales
- Conversion
- Up sales.


Forbes- 46% of companies use social media campaigns for brand awareness, and 29% use it to introduce new products or services.

Evaluate previous campaigns
By evaluating your previous campaigns, you can determine how much money was spent and where you spent it. It also allows businesses to identify where money was put to good use or was wasted. All this information will help plan for the future and allocate money accordingly.
Some key questions to ask when evaluating previous campaigns may include:
- What are we doing well and what should we continue doing?
- What did not go so well, and how can we improve?
- What was supposed to happen, what happened, and why were they different?
- How has our understanding of the situation changed, and how can we change our approach to meet new marketing trends?
Research

A successful marketing campaign is 80% research and 20% action.
Research and analysis are one of essential steps when budgeting a marketing campaign. It crafts the best fitting strategy for your campaign and helps you start on a strong foot.
What do we look for when we conduct research?
Firstly, researching the competition is a great place to start as this will help gather all necessary information on what has worked for them and what strategies they have implemented to make their campaign successful.
Some questions to ask when researching the competition include:
- Who are the main competitors?
- Do they have similar products? How can you differentiate your business from there’s?
- What were their strong and weak points?
- How did they promote their products or services?
- Do they have the same target audience? If so, how are they showing up to get that audience?
- What are their main selling points? And have they been successful?
Competitive research helps businesses understand why consumers choose to buy their products. It is also useful to see how they market their products and whether you have an advantage with the products you sell. Over time, this can help you improve your own marketing programs
Second, researching the current market will benefit how you advertise your product/service, including determining the ideal social media platform to employ and tools and tactics to maximise the campaign's success.
Some questions to ask may include:
- What social media platform will be used? For example, Facebook or Instagram?
- Will you focus your campaign efforts on one media platform or multiple?
- What tracking tools will be used? For example, Google Analytics
- What are the current market trends and how will you incorporate these into your campaign?
- Are there any gaps in the market that your product/service can fill?
Conducting research is crucial and can be the factor to determine whether the objectives and goals of your campaign are met.
Spending
Marketers will determine how much they will spend on their campaign during this stage. They will need to consider any resources that need to be organised, e.g., do they have content or a copywriter? Will they hire an influencer to promote their brand? Are there fees associated with the social media platform, including costs per click?
Once they identify all resources needed and how they will use these to achieve their objective, they will have a set budget.
By setting a spending amount, you will be able to ensure your campaign does not blow out of budget
Allocating funds
Once you have identified the total spending budget, allocation of funds will be the next step to choosing to spend a certain amount on each category.
These may include:
- Employees or freelancers to help create the marketing campaign
- The software’s used to track the success of the campaign
- How much money you'll spend on paid opportunities such as sponsored content, search engine ads, influencers, and social media promotions
- Content creation- hiring a copywriter, photographer, or videographer.
Below is an example of an excel spreadsheet where funds have been allocated based on the needs of a social media marketing campaign.
By allocating funds, you can spend money on the rights things and set clear targets for each category.
Using tools to track campaign
Analytical tools, insights, and surveys can be accessed to help determine varying factors that help inform the metrics. These tools are often a part of the social media accounts but can also be found from external sources that display a series of data and statistics to help track your campaign.
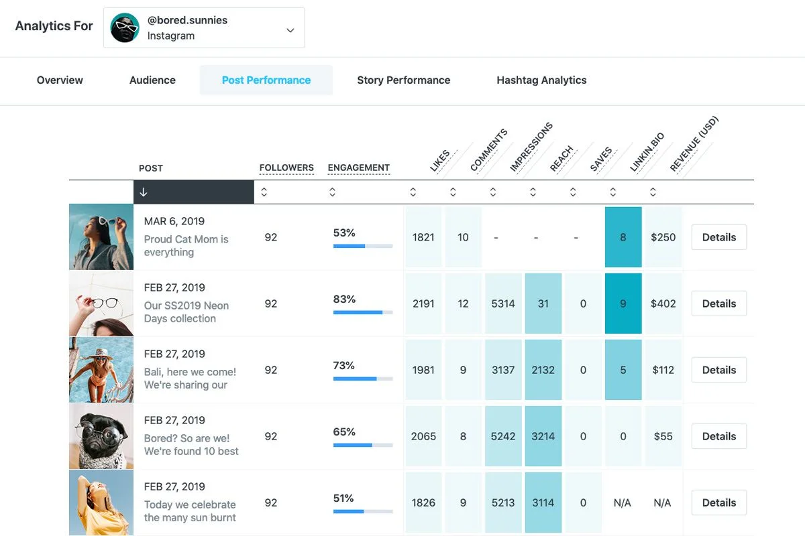
You can use various tracking tools to analyse the effectiveness of your social media campaign.
Understand the use of metrics
Metrics can be obtained with a variety of tracking tools available.
Metrics are a quantifiable way to track performance which is crucial when undertaking a social media campaign. Some may be irrelevant to the platform you have chosen to use; however, these will be closely related to your identified goals.
Metrics will help identify:
- Website traffic
- New visitors vs returning
- Session duration (how long consumers choose to stay on your platform)
- Page views
- Bounce rate (how quickly consumers leave your platform)
- Conversion rate
- Social reach (how many consumers have seen your ad)
- Cost per click.
Marketers will not need to use all these metrics but focus on the relevant ones to the campaign.
Set timeframes and check analytics
Reviews are the utmost important stage when budgeting for social media campaigns. There is little purpose in trying to reach a goal and implement a strategy without evaluating what worked and what did not for ongoing campaigns to ensure they continuously improve in reaching the end goals within budget.
Some important areas to evaluate include:
- Did the campaign meet the end goals?
- What strategies were effective and why?
- What strategies were ineffective and why?
- Where was money well spent?
- Where was money wasted?
- What should be improved on?
To ensure that budgeting for social media campaigns continues serving its purpose in the business, set time frames for reviews to check those analytics will need to be the drive for the campaigns that follow.

Microsoft Excel is an effective program that supports marketers in documenting and organising data. It contains a spreadsheet with columns and rows classified as “cells, " which are used to input information. Once this information has been documented, marketers can organise, find, and pull data to understand their business's current position and success. Microsoft Excel is specifically useful when budgeting for social media campaigns.
Some important functions within excel are valuable to marketers to make their job a little easier. These include:
- Standard operations (multiple, addition, subtract, divide)
- Creating tables
- Filtering data
- Creating and customising different charts
- Conditional formatting.
Diving deeper, we will explore how each of these functions can be used to analyse data more effectively and support marketers in improving the performance of a business.
Standard operations
To use Excel, marketers will need to understand the basic functions of adding, multiplying, subtracting and dividing. You can use these to create formulas to complete math equations.
Excel uses standard operators for formulas,
- Such as a plus sign for addition (
+), - A minus sign for subtraction (
-), - An asterisk for multiplication (
*), - A forward slash for division (
/), - And a caret (
^) for exponents.
Addition = 5 + 5
Subtraction = 5 – 5
Multiplication = 5 * 5
Division = 5 / 5
Exponents = 5 ^ 5
Note: in a traditional math equation, the = is always placed at the end; however, this needs to be placed at the front of the formula in Excel.
Although you can create these formulas manually, marketers will use cell addresses to calculate a formula, called cell references, to calculate a large amount of information accurately. This way, figures will always remain updated and accurate, even when cell values change.
Steps to create a formula
We are looking to add two cell references to determine the total figure in this situation.
Step 1: Identify the cells you would like to add.
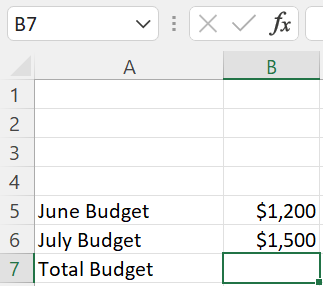
Step 2: In this case, the cells will be B5 and B6. You will place =B5+B6 into the cell (B7).
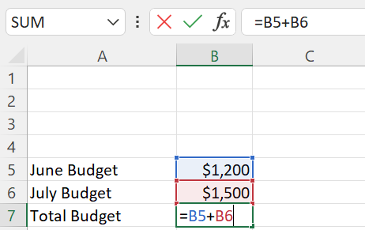
The formula will appear in both the cell and formula bar.
Step 3: Press enter
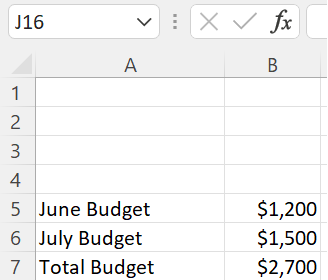
The total budget will appear.
Using this formula, if you go back to change any figures, the total budget will automatically re-calculate to show the updated total.
Note: You can point and click on the cells you want to include in your formula rather than typing cell addresses manually. It will save time, especially if there are multiple cells you are looking to calculate. Remember, you will still need to add the = sign in the cell before you begin.
For more information on basic calculations, click on the video below
Creating tables
Tables work to unify and condense data, which can be very useful to marketers, especially when they want to input data in an organised manner.
This will make all information that needs to be shared and updated easier for all stakeholders as they do not need to waste time trying to find relevant information. Once tables are created with all relevant data, marketers will filter data to find specific details and create charts to visually present their findings.
Filtering data
If you want to sort, filter, or graphically present your data, formatted tables are your best option. Marketers will need to create tables and filter them to categorise and organise data to their needs. Marketers may do this to identify sales profits from month to month, trends, or business performance.
For more information, the video below will demonstrate creating tables and filtering data to suit specific needs.
Creating and customising different charts
When presenting information, marketers take the data and place them into Charts. Depending on the data provided and the message they want to send, suitable charts will be chosen for that purpose.
Some of the most popular charts used in marketing include:
-
Pie chart

-
Column chart

-
Line chart


Charting allows you to visually portray the data you've gathered; it is a far more appealing way to look at the information. For more information on how to create charts and how they can serve different purposes, click on the video below.
Conditional formatting
When marketers want to identify trends and patterns in a dataset, conditional formatting is one of the best ways to do that. Conditional formatting may also be used to find issues or areas of improvement.
A conditional format changes the appearance through colour-coding cells based on conditions you specify. If the conditions are true, the cell range will be highlighted; if the conditions are false, the cell range will not be highlighted.
An example may include a marketer needing to find out the two months of the year that generated the most profit.
For more information on conditional formatting, view the video below.
Excel can help you optimise your marketing processes, tweak, decide on campaigns, and even track day to day variations in data. This is done through analysing sales data, checking budgets, running statistics, or calculating the performance of marketing strategies.
Brief
An existing beauty salon has decided to focus its advertising on brand awareness. They have organised a campaign to promote their new skincare range. They have used two (2) social media platforms to promote this campaign (Instagram and Facebook).
They have collected the following data:
| Instagram From January-March
|
Facebook From January-March
|
Task
For this activity, you will read and interpret the metric data for both the Instagram and Facebook social media campaigns.
With this information, you will need to:
- Read and interpret metric data
Look at the metric data for both campaigns and understand what results have been captured. - Using Microsoft excel, record the data into an Excel table
Using the insertion of an excel table, record and categorise the data well for each campaign - Create a Chart in Excel
From the excel table, decide which chart/s you would like to use to display the results visually. - Identify results
Identify which of the two campaigns you found to have the best results.
Share your interpretation in the forum.