In this topic, we will cover:
- Error handling
- Developer console
- Debugging
- Common mistakes.
Preventing
You may be familiar with the following phrase, often attributed to Dutch philosopher, Desiderius Erasmus:
Prevention is better than cureErasmus (1466–1536)
This is true of many facets of life--including servicing your car, taking care of your teeth, mending a loose thread, and it also applies to coding. The best way to handle errors, is to prevent errors in the first place!
- Reduce complexity to isolate the problem. This will make debugging easier. Comment out blocks of code. If the number of items adds to complexity of debugging, reduce the number of items.
- Test early and test often. The more moving pieces you add in without testing, the greater the chance something will go wrong.
- Validate your data to prevent users entering data that will cause your code to fail. Dates, email addresses, integers (whole numbers), text–if any of these fields need to be formatted in a particular way, ensure the user inputs it correctly.
- Use functions. This ensures that the variables in DevTools will be in the Local scope, not the Global scope, making it easier to see where code is going wrong when stepping over functions.
- Add comments. This is such a simple way to help your future self and anyone else looking at your code. What was the intent of the code? If you have to revisit your code months (or years) later, will you remember?
Syntax, logic and execution errors
There are 3 main types of errors you come across in JavaScript.
- Syntax. Caused by an error in spelling or grammar–aka a typo. This can be as simple as missing a letter or character. JavaScript is an interpreted language, so the syntax error may be detected during program execution when the interpreter is unable to convert the source code into machine code.
- Logic. The program operates incorrectly or unexpectedly but does not terminate (or crash). The code is valid, so does not throw an error. You can resolve logic errors by setting breakpoints, using a trace table, or doing a dry run to assist you in identifying sections of code that contain logic errors.
- Execution, also known as runtime error. The code is free of syntax or logic errors but fails to perform the task when run, that it has been programmed to do. Runtime errors only become apparent during run time and cause the program to 'crash'. Common execution errors include asking a program to divide by zero (0) and file handling when an attempt is made to write a file that does not exist.9

Isolate the problem

A core part of successful debugging is being able to isolate the problem. Script can be long and complex; e.g. pulling from different libraries, with many different contributors–including people no longer working on the project. Whittling away non-essential parts of the problem allows you to concentrate on finding a solution for the bug.
Isolation allows you to:
- figure out the true root cause of the problem
- assess whether there is a race condition (for time-based tasks)
- assess whether the code can be simplified--making it easier to write and maintain
- establish if there is more than one issue.
The first step in debugging is always to reproduce the error. Without being able to reproduce the bug, it is very difficult to debug. If you can reproduce the error, you can compare the steps taken to a case where the code does work as intended. This allows you to assess what is different between the 2 situations.
You can isolate the issue in a variety of ways, including reducing your script to run a test case on a private CodePen, using console.log(), breakpoints or the debugger keyword. (We will explore the latter 2 techniques later in the topic.)
Once you have isolated the issue, work methodically, testing assumptions and fixes as you go along. If you change many things, and cause a new error, it can be difficult to remember what you have changed.10
Linting
'Linting' flags suspicious code and calls out errors that you may have missed. It also helps ensure your project follows a coding standard. There are many JavaScript linters available (including JSHint, JSLint, JSCS and ESLink). Here, we will focus on JSHint.
Linting tools all work in the same basic way. A set of rules is used to analyse and report on problems in JavaScript files.
In JSHint, you can configure rules. There is detailed documentation for each rule so you can understand what is happening. It also integrates well into editors and has support for many libraries, including jQuery.42
'The project aims to help JavaScript developers write complex programs without worrying about typos and language gotchas.
'Any code base eventually becomes huge at some point, so simple mistakes — that would not show themselves when written — can become show stoppers and add extra hours of debugging. So, static code analysis tools come into play and help developers spot such problems. JSHint scans a program written in JavaScript and reports about commonly made mistakes and potential bugs. The potential problem could be a syntax error, a bug due to an implicit type conversion, a leaking variable, or something else entirely.'11
Watch the video for a quick rundown of how JSHint works.
The following code contains 2 errors. Copy the code into jshint.com to find the errors, and repair.
function myFunction() {
  Var x = 1;
  var y = 2;

  if (x <= y) {
    if (x == y) {
      alert("x equals y");
    }
  }

myFunction();
You should see 4 warnings on the right, each assigned to a line. If you hover over the warning, the relevant code will be highlighted on the left.
Consider case-sensitivity and remember that every opening brace needs a closing brace.
function myFunction() {
  var x = 1;
  var y = 2;

  if (x <= y) {
    if (x == y) {
      alert("x equals y");
    }
  }
}

myFunction();
For complete JSHint documentation including JSHint options, command-line interface (CLI), API, and FAQs, visit JSHint Documentation.
The error object
JavaScript has an inbuilt error object which provides detail when an error occurs. The error object is made up of 2 properties: Name and message.
namereturns an error namemessagereturns an error message (a string).
There are 6 values that can be set by the error name property.6
| Error name | Description |
|---|---|
| EvalError | Error has occurred in the eval() function. Newer versions of JavaScript use SyntaxError instead. |
| RangeError | 'Out of range' number has occurred. |
| ReferenceError | Illegal (not allowed) reference has occurred. You have used/referenced a variable that has not been declared. |
| SyntaxError | Syntax error has occurred. |
| TypeError | Type error has occurred. A value has been used that is outside the range of expected types. |
| URIError | Error in encodeURI() has occurred. There are illegal characters in a URI function.6 |
Try to spot the error in the following piece of code.
<!DOCTYPE html>

<html>

</body>
  <h2>JavaScript Errors</h2>
  <p>You cannot evaluate code that contains a syntax error:</p>
  <p id="exampleErrName"></p>
  <p id="exampleErrMessage"></p>
  <script>
    try {
      eval("alert('Hello)");
    } catch (err) {
      document.getElementById("exampleErrName").innerHTML = err.name;
      document.getElementById("exampleErrMessage").innerHTML = err.message;
      alert(err.name + ": " + err.message);
    }
  </script>
</body>

</html>
The err.name in this case will be 'SyntaxError' and the err.message will be 'Invalid or unexpected token'. An apostrophe is missing from line 10. Correct the error and run the script. The error name and message should disappear.
Try and catch an error
The following are advanced techniques you can use to find errors and fix them on the fly. You may wish to add these to your error handling toolkit.
- "The
trystatement defines a code block to run (to try). - The
catchstatement defines a code block to handle any error. - The
throwstatement defines a custom error. - The
finallystatement defines a code block to run regardless of the result."6
Try...and catch
The try and catch statements work as a pair:
- First, define a block of code to be tested for errors using the
trystatement. - Then, the
catchstatement will define a block of code to run if an error occurs in thetryblock.
If there are no errors in the try block, the catch statement will not be executed. But, if there is an error in the try block, the catch statement will execute and you will be able to see the exception message that would have been shown to the user.
try {
  nonExistentFunction();
} catch (error) {
  console.log(error); // => ReferenceError: nonExistentFunction is not defined.
}
Throw statement
When an error happens, JavaScript will usually stop and generate an error message. This is called: JavaScript throwing an exception (an error). JavaScript will create an Error object with 2 properties: name and message.
You can use the throw statement to create your own runtime errors. The error can be a JavaScript String, Number, Boolean or Object.
function getRectArea(width, height) {
  if (isNaN(width) || isNaN(height)) {
    throw "Parameter is not a number!";
  }
}

try {
  getRectArea(3, "A");
} catch (e) {
  console.error(e); // => "Parameter is not a number!"
}
If you combine the throw statement with try and catch statements, you can control the program flow and generate custom error messages.
Finally statement
The finally statement allows you to execute code, after try and catch, regardless of whether an exception was thrown. If there is a finally statement, it will run in all cases, including:
- after a
tryblock, if there were no errors - after
catchblock, if there were errors.
Even if an exception is thrown after the try block, and there is no catch statement, the finally statement will still execute. For example, the following code will open a file, execute the statements, and always close the file–even if an exception is thrown.2,6,12,44
openMyFile();

try {
  // Tie up a resource.
  writeMyFile(theData);
} finally {
  // Always close the resource.
  closeMyFile();
}
JavaScript debuggers
Even with close attention to detail and skilful error handling, bugs are still going to arise. By default, users will not see these errors in the browser. If the script has a bug, we will not be able to see what is broken in the browser, so we cannot fix it.
That is where developer tools come in. Built-in browser’s developer tools allow us to see errors and extract useful information about scripts.
Chrome and Firefox lead the way for developer tools, with other browsers playing catch-up.
Most developers will have a preference and switch to others only if the bug is browser-specific.
Built-in JavaScript debuggers can be turned on and off, forcing errors to be reported to the user. JavaScript debugging tools allow you to stop the execution of the script with breakpoints. You can then step through the code line-by-line and assess where errors are.
Usually, you can activate debugging in your browser by entering F12 (or if you are on Mac, Cmd+Opt+J) and selecting Console in the debugger menu. Alternatively, take the steps described in the following accordion.
- Open the browser.
- From the menu, select More tools.
- From More tools, choose Developer tools.
- Select Console.
- Go to Safari, Preferences, Advanced in the main menu.
- Check Enable Show Develop menu in menu bar.
- When the new option 'Develop' appears in the menu:
- Choose Show Error Console.
- Open the browser.
- From the menu, select Web Developer.
- Select Web Console.
- Open the browser.
- From the menu, select Developer Tools.
- Select Console.
Getting started with Chrome DevTools Console
Take a look around the Console tab on Chrome.
First, open the page bug.html.
There is an error in the code on this page, but it is hidden from a regular user’s eyes. Open the developer tools and navigate to the Console tab/panel.
Depending on which version of Chrome you are running, it may look slightly different, but it will be similar to:
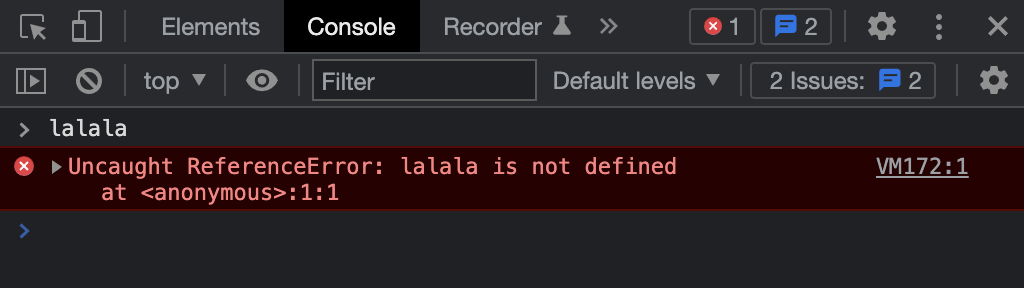
There are 2 things to note here:
- the red-highlighted error message
- a clickable link on the right links to the source bug.html:12 – This is the line number where the error occurred.
Below the error message, you can see a blue > symbol. This denotes a 'command line' where you can type JavaScript commands. Press Enter to execute them.6, 12.
Console overview
The console has 2 main purposes: viewing logged messages and running JavaScript. We are going to look at these in a little more detail.
View logged messages
Logging messages to the console allows you to check that your script is working as expected. This is done using the console.log function. When the browser executes and sees this function, it knows to log a message in the console. Standard web users will not see it.
Logging messages has 2 benefits:
- checking that the code is executing in the correct order
- inspecting values of a variable at a point in time.
Watch the video for an overview of console logging.
Running JavaScript
The console also functions as a read-eval-print loop (REPL). You can run JavaScript in the console that interacts with the page you are inspecting.
The console has full access to the page’s window, meaning that you can modify the page from the console.
There are several handy features in DevTools which make it easier to inspect and debug a page. We will explore these further in our next subtopic.43
Code debugging
Searching and fixing errors in code is called 'code debugging'. Code errors may be:
- syntax
- execution
- logic.
These errors can be difficult to spot and diagnose. Often, when code contains errors, nothing will happen: no error messages will appear, and you will not be told where to look for errors.
Your first step is to reproduce the issue. Find the series of actions that always result in the bug.

Why is an error called a 'bug' anyway? In 1946, computer pioneer Grace Hopper, was working on the Mark II and Mark III in the Computation Laboratory at Harvard. Operators traced an error in the Mark II to a moth, which was trapped in a relay. They carefully removed the bug and taped it into the logbook.
Lo and behold, the term 'bug' was coined to mean an error or glitch in a program.

Breakpoints
Using the debugging window, you can set breakpoints in the code. Breakpoints can be set anywhere and will tell the debugger to stop code execution.
We will look at how to set breakpoints using the debugger in Chrome, but most browsers follow a similar process.
First, turn on the developer tools using F12, or accessing via the menu. Next, navigate to the Sources panel. The Sources panel has 3 sections (as shown below).

- File Navigator: This lists HTML, CSS, JavaScript and any other files that are attached to the page.
- Code Editor: Shows the source code.
- JavaScript Debugging: Used for debugging.
Open up a console below the panes by pressing Esc. This is where you can type commands and press Enter to execute. After the command has been executed, the result will show underneath.
Set a breakpoint
Once you have navigated to the Sources panel, setting a breakpoint is easy. Simply click on the line number (the digit) you wish to set as a breakpoint. The number will be highlighted in blue, and the breakpoints listed in the JavaScript Debugging pane under Breakpoints.

To temporarily disable a breakpoint, uncheck it in the JavaScript Debugging pane. To remove the breakpoint, just click the line number again.
Debugger keyword
The debugger keyword has the same function as setting a breakpoint. It stops the execution of the script and calls the debugging function. If a debugger is not available, the debugger statement has no effect.
In the following example, the code will stop executing before the third line, provided the debugger is turned on.
var x = 15 * 5;
debugger;
document.getElementById("demo").innerHTML = x;
Examining the code
After the breakpoint is set, and the execution is paused, you can open the informational dropdowns in the JavaScript Debugging pane to examine the current code state.
- Watch shows current variables for any expressions. Click the plus + to input an expression. Inspect the variables.
- Call stack shows the nested calls chain. It is a log of functions and methods that have been executed to the breakpoint. View the call stack for complex code when you are not sure about which functions were called up until that breakpoint.
- Scope shows the current variables including local and global.
Now it is time to step through the code; i.e. you execute one line of code at a time. You can do this in 3 ways.
- Step Over, like Step Into, executes the next line of code. If that line is a function, Step Over executes the entire function and halts at the first line outside the function.
- 'Step Into [or Step] executes the next line of code. If that line is a function call, the debugger executes the function and halts at the first line of the function.
- Step Out returns to the calling function when you are inside a called function. Step Out resumes the execution of code until the function returns. It then breaks at the return point of the function.'2

These steps are represented by buttons at the top of the JavaScript Debugging pane. There are also buttons for resume (continue the execution), enable/disable all breakpoints, and enable/disable automatic pause in case of an error.6, 12.
In the following video, the developer uses Chrome DevTools to debug a calculator. Watch the video for a recap on the Sources panel, breakpoints, stepping through code, checking variable values, and applying a fix.
Even experts make mistakes
When code gets big--hundreds or thousands of lines--the chance of making mistakes increases. These mistakes, or bugs, become challenging to spot.

While different browsers may use different wording when displaying errors, the meaning the words convey is the same. This should allow you to identify what the problem is.
The following are some common mistakes to look out for.
Undefined variables
When defining your variables before assigning values to them, JavaScript makes some assumptions. For example, the following will create the new global variable alpha and assign it to the value 12:
alpha = 12;
However, for best practice you should define the variable explicitly with the var keyword:
var alpha = 12;
Whether you choose to use the var keyword or not, has a consequence on the variable’s scope. If a variable is used before it has been defined, an error will be thrown. For example, the following code will cause an error if the variable alpha has not been previously defined (explicitly or implicitly):
alert(alpha);
Function definitions also have parameters. If these are declared incorrectly it can lead to the same type of error.
Consider the following code:
function exampleFunction(parametrOne) {
  alert(parameterOne);
}
If you call this function, you will get an error message saying that parameterOne is undefined. Can you spot the typo?
The function’s parameter should be parameterOne , not parametrOne (note the missing 'e'). This type of error can be confusing because the source of the error is on one line, and the browser tells us it is on another.
Case sensitivity
Case sensitivity (mixing up lower and upper case) can be a major source of errors and difficult to spot. Aim for consistency.
Can you spot the 3 errors?
var myName = "Alice";

If (myName == "alice") {
  alert(myName.toUppercase());
}
- First, the 'i' in the if keyword needs to be lower case. JavaScript will not tell us there is a case error, instead, the browser will tell us Object expected or that If is not defined. Error messages can provide you with a sense of what is wrong, but often in a roundabout way. In this instance, the browser has assumed you are trying to use an object called If or using an undefined function called If.
- Next is a logic error. Alice does not equal alice in JavaScript. Therefore,
myName == "alice"is false. This error will not throw up an error message because it is valid JavaScript. However, your code will not execute as expected. - Finally, the
toUppercase()method converts a string to uppercase letters. The 'c' in our example codetoUppercase()needs to be upper case.
Incorrect number of closing braces
Formatting your code is important to ensure that you have an easier time identifying errors.
The 2 examples that follow are identical. Is it easier to spot the error in one of the examples over the other?
Example 1:
function myFunction()
{
var x = 1;
var y = 2;
if (x <= y)
{if (x == y)
{alert("x equals y");
}
}
myFunction();
Example 2:
function myFunction() {
  var x = 1;
  var y = 2;

  if (x <= y) {
    if (x == y) {
      alert("x equals y");
    }
  }

myFunction();
In example 2, you can see that the ending curly brace of the function is missing. When you have a lot of if, for, or do while statements, it can be easy to have too many or too few closing braces. Formatted code makes the problem easier to spot. The correct code should read:
function myFunction() {
  var x = 1;
  var y = 2;

  if (x <= y) {
    if (x == y) {
      alert("x equals y");
    }
  }
}

myFunction();
Incorrect number of closing parentheses
Likewise, not having the correct number of closing parentheses (brackets) can cause errors. Consider the following code:
if (varOne + 12) / varTwo < varThree)
The number of open brackets always needs to equal the number of closed brackets. In the example, there is 1 open but 2 closed brackets. The code should read:
if ((varOne + 12) / varTwo < varThree)
Using equals (=) rather than equality (==)
JavaScript programs may generate unexpected results if an assignment operator (=) is used instead of a comparison (or equality) operator (==) in an if statement.
JavaScript does not report this as an error because it is valid JavaScript. The only indication that there is a mistake, is that your code will not work. Assigning a variable a value in an if statement may look like a mistake, but it is valid code.
This if statement behaves as expected and returns false because x is not equal to 10:
var x = 0;
if (x == 10)
Whereas, this if statement behaves returns true (not as expected), because 10 is true:
var x = 0;
if (x = 10)
And this if statement returns false (not as expected), because 0 is false:
var x = 0;
if (x = 0)
Confusing addition and concatenation
Addition is about adding numbers; whereas concatenation is about adding strings. Both use the + operator in JavaScript.
Adding a number as a number will produce a different result from adding a number as a string. For example:
var x = 10;
var y = 5;
var z = x + y; // => 15
// Now z is 15.

var x = 10;
var y = "5";
var z = x + y; // => "105"
// Now z is "105".
Misunderstanding floats
Numbers in JavaScript are stored as 64-bits floating point numbers (floats). JavaScript has difficulty with precise floating point values. For example:
var x = 0.4;
var y = 0.2;
var z = x + y; // => 0.6000000000000001
// The result in z will not be 0.6.
To solve the problem, multiply and divide:
var x = 0.4;
var y = 0.2;
var z = (x * 10 + y * 10) / 10; // => 0.6
// The result in z will be 0.6.
Breaking a string
JavaScript allows you to break a statement into 2 lines:
var x =
"Hello, world!";
However, breaking a statement in the middle of a string will not work:
var x = "Hello,
world!";
Use a backslash if you need to break a statement in a string:
var x = "Hello, \
world!";
Breaking a return statement
JavaScript will close a statement automatically at the end of a line by default. That means the result in the following 2 examples is the same.
Example 1:
function exampleFunction(a) {
  var power = 10

  return a * power
}
Example 2:
function exampleFunction(a) {
  var power = 10;

  return a * power;
}
You can also break a statement into 2 lines. So, Example 3 will also return the same result as Examples 1 and 2.
Example 3:
function exampleFunction(a) {
  var
  power = 10;

  return a * power;
}
However, if you break the return statement into 2 lines, the function will return undefined.
Example 4:
function exampleFunction(a) {
  var
  power = 10;

  return
  a * power;
}
The function returns undefined because JavaScript automatically closed the return statement. This happens because closing (ending) statements with a semicolon is optional in JavaScript.
Never break a return statement.
Accessing arrays with named indexes
JavaScript does not support arrays with named indexes (associative arrays or hashes). Instead, arrays use numbered indexes. For example:
var person = [];

person[0] = "Jane";
person[1] = "Smith";
person[2] = 25;

person.length; // => 3
// person.length will return 3.
person[0]; // => "Jane"
// person.[0] will return "Jane".
In JavaScript, objects use named indexes. If you use a named index, when accessing an array, JavaScript will redefine the array to a standard object.
After redefinition, array methods and properties will produce undefined or incorrect results. For example:
var person = [];

person["firstName"] = "Jane";
person["lastName"] = "Smith";
person["age"] = 25;

person.length; // => 0
// person.length will return 0.
person[0]; // => undefined
// person.[0] will return undefined.
Undefined is not null
JavaScript objects, variables, properties and methods can be 'undefined'. Empty JavaScript objects can have the value null. This can make it challenging to test if an object is empty.
You can test if an object exists by testing if the type is undefined.
if (typeof myObj === "undefined")
However, you cannot test if an object is null as it throws an error if the object is undefined. So, the following will not work.
if (myObj === null) // This will throw an error.
You must test if an object is not null, and not undefined. This can still throw an error.
if (myObj !== null && typeof myObj !== "undefined") // This can still throw an error.
To fix this, you must test for not undefined first before you test for not null.2, 6
if (typeof myObj !== "undefined" && myObj !== null)
Knowledge check
Debugging – Grade calculator
Use debugging tools and techniques to identify and fix bugs in the attached Grade calculator project.
- Analyse the existing code.
- Use browser debugging tools to step through to identify bugs.
- Fix the bugs and test.
- Repeat.