To give the client the best advice possible, it is crucial that any data used in the analysis is reliable and accurate.
Appropriate sources which can be used to verify the data reliability include:
- Accounting, auditing, or tax advisors
- Board directors, especially non-executive directors
- Government advisory services, such as Business.gov.au
- Legal advisors
- Australian taxation offices
- Professional accounting bodies.
The most appropriate authority to seek assistance from or obtain information will be specific to the nature of data as well as the organisation’s procedures.
Client Rights and Responsibilities Related to Obtaining Financial and Business Performance Information
It is essential, when providing information and advice regarding business performance and financial matters, that the client is informed of their rights and responsibilities.
In Topic 2 and Topic 4.8, the Corporations Act 2011 and Tax Reporting Obligations have been established as two (2) key areas which clients must understand their rights and responsibilities.
In particular, the client has the following responsibilities when obtaining financial and business performance information:
- Clients must be honest about the financial information they provide.
- Clients must be thorough with the financial data and documentation they provide to the accountant.
- Clients must ensure that the financial information and data they provide are complete and accurate.
- Aside from these obligations, clients also have the following rights:
- Right to have their personal and business information kept private and confidential.
- Right to services provided with acceptable care and skill or technical knowledge and taking all necessary steps to avoid loss and damage.
- Right to services fit for the purpose or that give the results that client and the business had agreed to.
- Right to the delivery of services within a reasonable time when there is no agreed end date.
It is essential that clients have a clear understanding of their rights and obligations regarding the following:
Consider Privacy Legislation
These laws serve to protect the information of customers and employees. Personal or sensitive information is that which identifies a person and is often required of the customer when purchasing a product or service, or of an employee upon employment.
It is therefore important that all this information is protected from misuse or inappropriate disclosure such as the selling of customer contact information to advertising agencies.
Further Reading
Understand your rights and obligations regarding the use of personal information.
Employment Legislation
When providing advice on financial and business performance, there are specific employment laws which must be understood by the client. There are responsibilities to report accurate information related to wages, superannuation and other payroll data such as payroll tax.
There are many statutory reporting requirements which relate to the employment of staff and must be understood by the client from industry-specific awards, rates of pay, redundancies, and termination pay.
When providing advice, it is important to provide clear and concise information on what the responsibilities of the business.
Further Reading
Read the article from Mondaq which outlines the basic life cycle and laws associated with hiring and firing in Australia.
Australia: From Hiring to Firing: a basic guide to the Australian employment law life cycle
Anti-Discrimination Laws
The Human Rights Commission of Australia helps to enforce several acts relating to discrimination, on both Federal and State levels. These acts cover legislation regarding discrimination by:
- Age
- Race (including skin colour, descent, national/ethnic origin, and immigrant status)
- Disability (whether physical, mental/intellectual, or medications such as an illness or disease)
- Sex (including gender identity, marital/relationship status, sexual orientation, family responsibilities, pregnancy, and breastfeeding)
- Religion
- Political opinion
- Criminal record
These laws apply to customers and employees alike, with jobs, pay, provision of services and various other areas being potentially affected because of discrimination against the customer or employee. It is important to know your rights as an employee, as well as the rights of the customers you serve.
Other key considerations for discussion with the client regarding their rights and obligations might include:
- Capital Gains Tax (CGT) – a tax on the gain from shares, units in a unit trust, property and business assets.
- Excise tax – levied on certain types of products which are produced or manufactured in Australia, including petroleum, tobacco, and alcohol.
- Fringe Benefits Tax (FBT) – paid on specific employer benefits in place of wages or salaries.

Providing financial and business performance information to clients involves having to compile and assess business and financial data to ensure that the information used to prepare reports are accurate.
Financial reconciliation is the process of comparing different sets of accounting and financial records to ensure they match. Reconciliation helps ensure that the money leaving an account is truly the money being spent and money entering an account is reported accurately.
Accounting teams and software will compare internal statements with external statements (such as banks or credit card statements), To ensure accuracy and make sure that they are aligned. One of the central aspects of performing financial reconciliation is the ability to stop fraud or avoid errors in a timely manner.
Financial reconciliation relies on financial standards like the generally accepted accounting principles (GAAP) (the standards by which businesses compile financial statements). The principles can only be upheld if the records are right. Financial reconciliation plays a large role in ensuring this is the case as it validates internal documentation from external sources and vice versa.
The two main methods companies use to perform financial reconciliation are Documentation review and Analytics review,
Whichever methods, or combination you use, reconciliations must be completed on all balance sheet accounts regularly, determine the cause of any discrepancies and update the accounts to reflect the true balances.
The most commonly used method is generally done with the help of automation software. In the documentation review, you examine existing records. With data collected, a software system can be used to reconcile the accounts by comparing the data sets.
Analytics review can spot irregularities in accounts by taking historical data and estimated balances a business expects should exist in an account. After performing analytics, if there is a significant discord between reality and expectation, then it can be a sign of financial mistakes or fraud.
Account Reconciliation and Double-Entry
The generally accepted accounting principles recommend the use of double-entry accounting to make reconciliation procesess more accurate.
With double-entry accounting for every transaction recorded in the general ledger, there is a record in two places. The record is marked in the income statement and the balance sheet.
Reconciliation Process: Step by Step Guide
The reconciliation process can be performed in minutes with the right software. However even with an automation tool, there will always be the need for human involvement and intervention to manually amend and update information into your accounting system. You can perform account reconciliation by completing these five steps:
First, you’ll have to compile the data you’ll need, which will be your internal account and your bank statement. Consider looking at your register against your bank statement to ensure every deposit and payment is in-line with each other. If there’s anything on your bank statement that doesn’t match with your transactions, then mark it for further investigation.
Your bank statement needs to take account of checks, charges and ATM transactions that are methods of outgoing funds. Be sure to note such transactions on your bank statement to match to your internal records. There are some fees that can be easily overlooked, so be sure to consider any ATM service charges or overdrafts, for example.
If you’ve deposited money into any account and the bank has yet to reflect these changes, update your statement balance. At the same time, check that any deposit in your bank is also showing up in your internal books. Keep in mind that you may have to add interest into your internal books if your bank is accumulating interest in your account.
While it is rare, bank errors can occur. If you find such an error, be sure to get in touch with your bank as soon as possible so that they can rectify any issues on their end.
Once your bank statement and internal records reflect the same balance, then your reconciliation is complete. If you had to make adjustments in the process to take care of discrepancies, it’s best to make note of the changes for audit trails. If you’re using an automation solution, this should be handled for you. 7
Further Reading
Financial Reconciliation: Step by Step Process 2020, Solvexia.com, viewed 5 October 2022.
Effectiveness of the Financial Management Process
When reviewing the financial effectiveness of a business, a key aspect which needs to be continually evaluated and managed is the cash flow.
Cash flow is very important to a business because a negative cash flow means the business is receiving less cash than it is spending, and it may struggle to pay immediate bills and need to borrow money to cover the shortfall.
The effectiveness of financial management processes is important to maintain an efficient and effective system and the data collected must conform to meet audit and other legal requirements.
For the reports to be effective and accurate, the records of financial transactions must be properly maintained, and the recording system of the organisation must be planned to comply with external reporting legal and professional obligations. Inaccurate recording procedures may cause financial loss to the business, through overpayments to suppliers and underpayments from clients or customers. 1
Key principles of cash flow
The following are some of the key principles of cash flow:
- Cash outflow
- Variable cash outflow - Variable cash outflow refers to real expenses in the business that is dependent on the production. When the production increases or decreases, the variable cash outflow will change as well. In case the production is stopped the variable cash outflow will stop as well.
- Fixed cash outflow - Fixed cash outflow (also called non-allocated costs) are those costs which are independent of the production of the enterprise. In case the production increases or decreases, the fixed costs remain the same. In case the production is stopped these costs will not stop automatically.
- Cash inflow
- Cash sales - Cash sales refer to the transaction that occurs when the goods or services are given in exchange for an immediate payment whether in term of notes, coins, cheque, or credit card. This results in an increase in the business’s cash.
- Tax refunds - Tax refunds refer to the amount that is returned to a business when the actual tax liability is less than the amount paid.
Where there is possibility that the time involved in processing the business’s income tax return or activity statement and the business’s potential refunds can put the business under serious financial hardship, the client can request priority processing.
Other key principles include:
- Receipts from trade customers
- Investment of share capital
- Personal funds invested’
- Receipt of bank loan
- Government grants
- Receipts from factoring
Bank Statements and Reconciliation
It is important to compile and reconcile data to confirm that financial statements are accurate and comply with organisational and regulatory requirements. As part of this process, and in line with the standard financial reporting principles, reconciliations of bank statements need to be completed.
The banks and other financial institutions will periodically send statements which show the transactions of the business based on the bank’s records.
Reconciliations can be performed to match the records of the business with the bank statement by identifying, investigating and rectifying all discrepancies. It is necessary to ensure that all bank fees and interest are included in the cash receipts and cash payments journals of the organisation where applicable. Reconciliations can also be performed concerning credit card transactions. 5
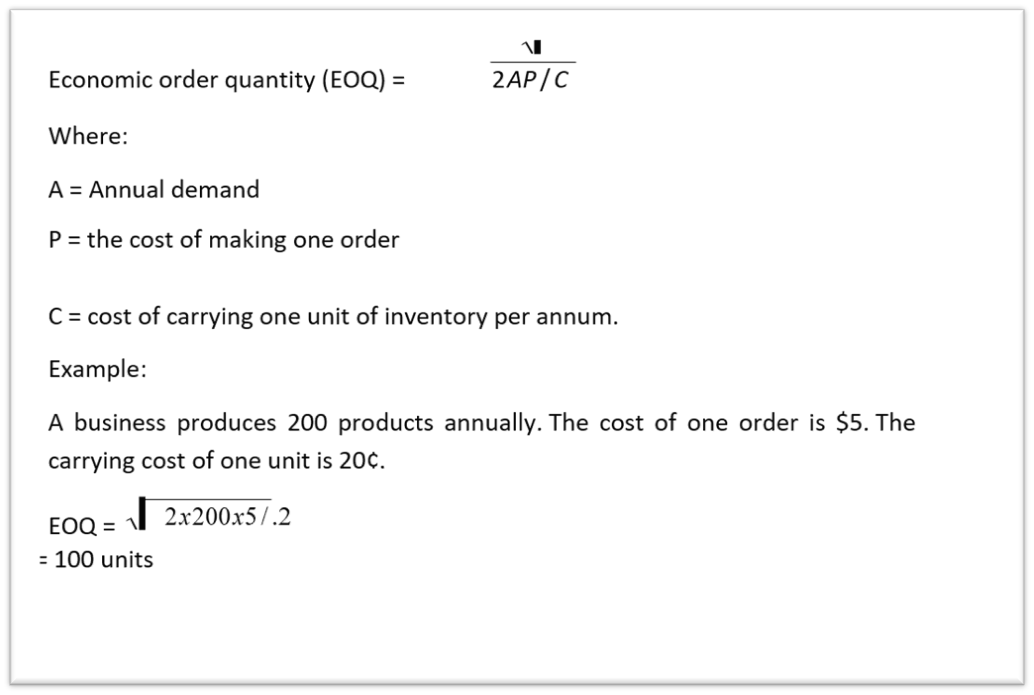
Managing Inventory

Reconciling the inventory in a business is essential as part of the analysis and review process when compiling and reconciling data on the profitability and performance of a business.
Inventory represents the finished goods that have been acquired for resale. Only sufficient stocks of inventory should be held to minimise handling costs, theft, and obsolescence. If insufficient inventory is held customers will not receive orders promptly and business may be lost. Any shortages of raw materials will impact on production.
The level of inventory held must be the minimum amount to avoid costs and the risk of not being able to provide orders on time. A technique which can be used to control expenditure is the “just in time method”, where materials are purchased just in time for production to avoid the unnecessary build-up of inventory.
The just in time production method helps to reduce the carrying capacity cost of inventory. A mathematical formula can be used to order quantities (e.g. the cost of ordering equals the cost of storage):
Effective Labour Management
When reviewing, reconciling and analysing data, it may be necessary to address the effectiveness of labour management within the business. It may necessary to determine any changes which are needed to ensure profitability and efficiencies meet the established goals and objectives of the business.
Factors to consider when determining the most appropriate measures required to increase operational efficiency include:
- Employing highly skilled employees can increase the cost of product or service however low skills can result in defective products and services.
- Incentive schemes will allow extra remuneration to be paid to employees whose productivity levels are higher. Although total costs are increased, an incentive scheme will lower the cost of each unit of product or service.
- Changes in mechanisation. Machines will usually cost less than human resources and can be supplemented for manual labour. When machines are used in place of manual labour, it is referred to as mechanisation, however, inspections may need to be performed regularly.
- Implementation or addition of automation. Machines in the automation process are controlled by computers and the term is referred to as “Computer-Aided Manufacturing”.
- Training programs can be implemented to improve the skills of employees.
- Plant and machinery preventative maintenance should be carried out to avoid breakdowns. The timing of inspections should be carried out in periods of non-production and a balance obtained between the cost of carrying out inspections and the savings incurred. 1
Effective Management of Miscellaneous Expenses
When evaluating financial information, expenses such as electricity and water should be carefully monitored and controlled to avoid any wastage. Prices should be regularly reviewed and negotiated with suppliers. Items including administrative expenses can be reduced by outsourcing activities such as computer maintenance, printing, and photocopying.
Any area where computers can be used to save costs is known as, Electronic Data Exchange (EDI). A computer can be used to order materials from a supplier, and the supplier’s computer organises the despatch notice to the purchaser.
The purchaser can then pay the invoice by instructing the bank to electronically transfer funds to the supplier’s bank account. This process will save a significant amount of time and handling of documentation. 1
Credit, discount and collection policies
Cost savings can be achieved through the monitoring of credit, discounts and collection policies. If credit policies are too lenient, bad debts may result. An organisation should take advantage of discounts offered by suppliers wherever possible.
The percentage value of any discount is calculated by using the following formula:
% value of discount = (% prompt payment of discount x 365)
(100 - %prompt payment discount x Credit days forgone)
Example:
A company cost of funding is 10%. The credit terms are 2% discount if a settlement is made within ten days. The net amount should be settled within 30 days to avoid interest on overdue accounts.
% value of discount = 2 x 365
(100 -2 x 30-10)
= 37.24%
Since the percentage value of the discount is greater than the percentage cost of borrowed funds (e.g. 10%, the interest amount if the funds were borrowed), the company should take advantage of the prompt payment discount. 1
Depreciation
Depreciation is an expense associated with the cost of a fixed asset over its useful life and must be monitored and reported on as part of the statutory reporting requirements.
Depreciation is treated as an operating expense however the accumulated amounts reduce the value of the asset.
One method of calculating annual depreciation is the straight-line method. The amount of depreciation is calculated by deducting the residual value of the asset from the cost of the asset and then dividing by the rate of depreciation.
Accrual-based accounting requires a business to match the expenses it incurs with the revenues it generates each accounting period. Because a long-term asset, such as a piece of equipment, contributes toward revenues over many accounting periods, a company spreads the asset’s cost over its useful life using depreciation. This creates a depreciation expense on the income statement each accounting period equal to a portion of the asset’s cost instead of creating an expense for the entire cost all at once.
A business chooses the method of depreciation that best matches an asset’s pattern of use in its business. A company may use the straight-line method for an asset it uses consistently each accounting period, such as a building. The reducing balance method may be appropriate for an asset that generates a higher quality of output in its earlier years than in its later years. There are several other methods of depreciation other than the two (2) discussed here.
Example:
A piece of equipment valued at $25,000 is expected to have a residual value of $5,000 at the end of its useful life is five (5) years. The amount of depreciation using the straight-line method is as follows:
$
Cost 25,000
Less residual value 5,000
20,000
Annual depreciation = $20,000/5 (20% of depreciable value).
= $4,000
The rate of depreciation is the same each year for this method and is the most appropriate method to use when the productive capacity of the capital asset is the same each year.
Where the productive capacity of the asset is considered to be higher in the earliest years of its use the reducing balance method is used.
Example:
The cost of the asset is $25,000, and the useful life of the asset is five (5) years. The depreciation rate is 30%.
| Year | Cost | Depreciable value | Annual depreciation |
|---|---|---|---|
| $ | $ | $ | |
| 1 | 25,000 | 7,500 | 17,500 |
| 2 | 17,500 | 5,250 | 12,250 |
| 3 | 12,250 | 3,675 | 8,575 |
| 4 | 8,575 | 2,572.50 | 6,002.50 |
| 5 | 6,002.50 | 1,800.75 | 4,201.75 |
$4,201.75 represents the residual value of the asset. 5
Applying Standard Accounting Techniques to Analyse Revenues and Costs
When preparing and analysing financial statements, it is important that revenues and expenses are accounted for and analysed in accordance with applicable accounting standards, in line with organisation’s objectives.
IAS18 and its Australian equivalent AASB 118 Revenue prescribes the accounting treatment of revenue arising from certain types of transactions and events, namely:
- The sale of goods
- The rendering of services yielding fees
- Use by others of entity assets yielding interest (i.e. interest, dividends)
According to AASB 101, an entity shall present an analysis of expenses recognised in profit or loss using a classification based on either their nature or their function within the entity, whichever provides information that is reliable and more relevant. Entities are encouraged to present the analysis in a paragraph in the statement of comprehensive income or the separate income statement (if presented).
Expenses are sub-classified to highlight components of financial performance which may differ regarding frequency, potential for gain or loss and predictability. This analysis is often provided in one of two (2) forms.
The first form of analysis is the ‘nature of expense’ in which case an entity aggregates expenses within the profit or loss account, according to their nature (for example, depreciation, purchases of materials, transport costs, employee benefits and advertising costs), and does not reallocate them among functions within the entity.
This method may be simple to apply because no allocations of expenses to functional classifications are necessary.
Nature of Expense Method:
| Revenue | X | |
| Other income | X | |
| Changes in inventories of finished goods and work in progress | X | |
| Raw materials and consumables used | X | |
| Employee benefits expense | X | |
| Depreciation and amortisation expense | X | |
| Other expenses | X | |
| Total expenses | (X) | |
| Profit before tax | X |
The second form of analysis is the ‘function of expense’ or ‘cost of sales’ method. This method classifies expenses according to their function as part of the cost of sales. Or, for example, the costs of distribution or administrative activities. At a minimum, an entity discloses its cost of sales under this method separately from other expenses.
This method provides more relevant information to users than the classification of expenses. This is because allocating costs to functions may require arbitrary allocations and involve considerable judgement.
The Function of Expense Method (Cost of Sales Method):
| Revenue | X |
| Cost of sales | (X) |
| Gross profit | X |
| Other income | X |
| Distribution costs | (X) |
| Administrative expenses | (X) |
| Other expenses | (X) |
| Profit before tax | X |
The choice between the function of expense method and the nature of expense method depends on historical and industry factors and the nature of the entity.
Both methods indicate that costs might vary, directly or indirectly, with the level of sales or production of the entity.
Because each method of presentation has merit for different types of entities, the standard requires management to select the presentation that is reliable and more relevant. However, because information on the nature of expenses is useful in predicting future cash flows, additional disclosure is required when the function of expense classification is used.
Once the correct accounting treatment is achieved for both revenues and costs, the combined information can be used to determine the mix and volumes of goods and services to produce and sell. The information is also used to monitor operations and profitability risk.

Financial Analysis Techniques
The financial activities of an organisation need to be continually analysed so that existing plans can be adjusted, and future planning can be completed.
The techniques most commonly used to analyse financial information are:
- Volume profit analysis - The cost-volume-profit analysis assists a business to determine the sales required for survival in difficult times or to receive the desired profit.
- Trend analysis - A trend analysis highlights the changes taking the place of over specified accounting periods and involves financial ratio analysis. Financial ratios help the business to determine whether or not assets are managed efficiently to maximise profits.
Cost Volume Profit Analysis
Cost volume profit analysis is a technique that combines revenue and cost analyses to examine changes in profits in response to changes in volumes, costs, and prices.
The analysis helps to plan:
- Which products and services to produce
- The volumes of sales necessary to achieve the target profit
- How far sales can decline before losses begin to be incurred
- Whether to increase fixed costs
- How much of an increase in price or volume of sales have to be made for a specified increase in fixed costs
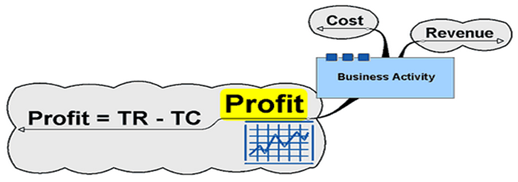
CVP analysis firstly defines profit and contribution margin, and profit is calculated by deducting total cost from total revenue.
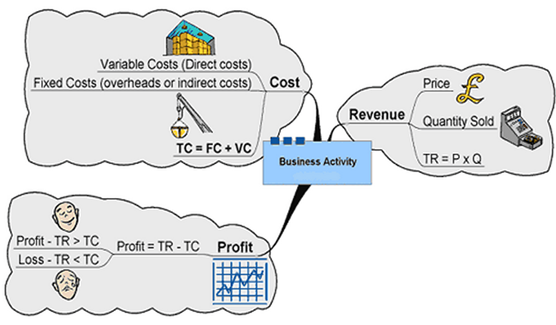
Total cost will include fixed costs such as overheads which do not change with the volume of sales and variable costs that are directly linked to the amount produced where VC= Variable cost per unit x Quantity.

Contribution margin is the difference between total revenue and total variable cost. On a per-unit basis, it is the difference between unit selling price and unit variable cost. It represents amount by which each unit sold contributes to fixed costs. Both contribution margin and contribution margin per unit are valuable tools when considering the effects of volume on profit.
Once enough units are sold to cover all fixed costs, then the contribution margin per unit from all remaining sales becomes profit and profit equation can be rewritten as follows:

Break-Even Point
The break-even point is the level of sales or output at which the business neither earns a profit nor makes a loss. It is that point where total contribution margin exactly equals total fixed costs. Once break-even is reached, every additional dollar of contribution margin becomes operating income.
The graph below shows the relationship between total revenues and total cost and illustrates how the profits are expected to change based on the level of operating activity.

Break-Even Point and Margin of Safety
The difference between total sales and the break-even analysis is called the “margin of safety”.
The formula for calculating the margin of safety is as follows:
Margin of safety = Total sales – break-even sales
Margin of safety % = Margin of safety x 100
Total sales
Example:
With respect to the company above:
Margin of safety: $240,000 - $160,000 = $80,000
% margin of safety: $80,000 x 100= 331/3%
The concept of break-even analysis is based on the following assumptions:
The variable cost changes in direct proportion
The fixed cost remains unchanged over different levels of production
There is no change to the selling price of each unit
Profit Ratios
Profitability ratios measure a company’s overall efficiency and performance. There are two (2) types of profitability ratios:
- Margin ratios which represent the company’s ability to translate sales dollar into profits.
- Return ratios which represent company’s ability to generate returns to its shareholders.

When using profitability rations, the following must be considered:
- Gross profit margin addresses how much a business makes from its sales efforts and represents the percentage of sales available to meet operating expenses and to provide returns to shareholders.
- Gross Profit can be calculated by subtracting COGS from revenue, and it represents the ability to pass on costs in selling prices. Gross profit indicates the profitability of sales without considering other expenses. Net profit, on the other hand, considers all expenses.
There can be different reasons for falling gross profit rates such as changes in the sales mix, lowering prices due to increase in competition, increases in the cost of inputs.
The gross margin rate can be improved by increasing selling price, reducing costs or changing the product mix. If a company cannot control selling prices, then the focus should be on decreasing COGS by, for example, negotiating long-term contracts with fixed prices, buying in bulk or changing suppliers.
Increased productivity can also be achieved by increasing volume of sales through promotions and marketing, but any increase in sales should be measured against additional costs.
Determining whether gross or net profit rates are satisfactory is a subjective decision and will depend on the nature of the business. A business with high inventory turnover, such as a department store, usually operates on lower gross margin than for example an exclusive jewellery store.
Other factors which need to be considered when addressing profitability include:
- Return on Total Assets (Return on Investment – ROI) measures the ability to earn a satisfactory return on assets employed. The ratio indicates how much is earned by each dollar of assets.
- Return on Shareholder’s Funds (Return on Equity – ROE) represents the ultimate measure of business performance for shareholders. The rate of return should be in line with the degree of risk taken by the business. The higher the risk, the higher the required rate of return. The rate of return should exceed the risk-free rate on governmental bonds as lending to the private sector is considered to be riskier than lending to the government.
Liquidity Ratios
Liquidity ratios measure the ability of the business to meet its short-term commitments from its current (liquid) assets. Whether the measure is satisfactory will depend on the nature of the business.
For example, a business that can “purchase on credit” and “sells for cash” will need less liquid assets than the business that has to pay “cash for purchases” and “sells on credit” and therefore will be fine with lower liquidity ratio values.

When applying liquidity ratios, the following needs to be factored:
- Current ratio indicates the short-term resources available to meet short-term commitments as they fall due. Generally, in literature as a rule of thumb, it is recommended that the current ratio for a new business should not be below 2:1 due to higher liquidity risk at the start of the operations. The ratio should not be below 1:1 for any business as there should always be sufficient current assets to cover current liabilities.
- Quick Ratio (Liquid Ratio, Acid Test Ratio) relates readily available current assets to liabilities that are payable now. Inventory is excluded based on the assumption of continuing business where it will need to be replaced with new inventory once sold. Additionally, it can take longer to translate inventory into cash.
- Prepaid expenses are excluded as they would be realised only once they expire in time.
- Bank Overdraft is excluded on the assumption that the overdraft facility will continue to be available to the business and not cancelled by the banks.
High liquidity ratio is looked upon favourably by lenders. The higher the liquidity ratio, the more liquid and financially sound the business is. A low (below 1) or a quick falling ratio is a sign that the company may have liquidity problems now or shortly.
A company that is experiencing liquidity problems is likely to draw down on its line of credit, i.e. increase its bank overdraft, increasing current liabilities. These are all signs of liquidity problems.
Activity Ratios
Activity ratios show the effectiveness with which a business uses its assets. Specifically, it seeks to determine whether the investment in assets is justified by the activity as measured by turnover.

Activity ratios factor:
Inventory Turnover Rate indicates how many times the average inventory of a business is sold or turned-over during the year.
It is an indicator of the efficiency of inventory management. The rate will vary with the type of product sold and inventory policy employed (i.e. perishable goods such as fresh fruits will have a higher turnover than non-perishables, lower mark-up products such groceries will have higher turnover ratios than luxury goods).
The formula for calculating an inventory turnover rate is:
Average Inventory= (Opening Inventory + Closing Inventory)/2
From this we can calculate:
No of Days Inventory is held = 365/ Inventory Turnover
It is important to keep inventory at optimal levels. If inventory levels are too low, it can cause stock outs and subsequent loss of customers. If, on the other hand, the level of inventory is too high, holding costs, such as storage and insurance, will increase.
Accounts Receivable Collection Period measures the average length of time taken by debtors to pay their accounts (measured in days), and is calculated:
Average Daily Credit Sales = Credit Sales for the year/ 365
The lower the collection period, the better, as it means fewer funds are tied up in accounts receivable, meaning more cash is on hand that can be used to generate income.
Accounts Receivable Turnover measures the number of times in a year accounts receivable are paid or turned over. The higher the turnover figure, the better, as it means debtors are paying more quickly.
A low accounts receivable collection period or a high accounts receivable turnover indicates efficiency in collection methods. However, there are costs associated with debt collection including the costs of chasing payments, sending letters etc. These costs need to be balanced against the benefits of a shorter collection period.
Total Assets Turnover represents efficiency with which total assets are converted into sales. It is normally expressed as “number of times per year.”
If this ratio is falling or is below industry standards, it indicates that assets are not profitable enough or that some assets are not performing well. Managers should consider selling off unprofitable assets and investing the funds in more profitable areas.
Leverage Ratios
Financial leverage ratios are also known as debt ratios and are used to measure the value of equity in a business. This is done by comparing the debt or equity to the assets to measure the true value of the equity within the business.
The leverage ratio is used to measure the overall debt within a business and compare it to the assets or equity. This type of measurement is important if looking for investors or seeking additional finance as it will establish the risk associated with the business.
Leverage refers to the relative amounts of debt and equity funding that a business uses to finance investments, and it is also another measure of the financial health of a company. The more debt funding relative to equity funding the business uses, the higher its leverage is said to be. The more debt funding the company has, the riskier its equity the reason being that more funds will be needed to service loans and also shareholders are last ones to be paid in case of bankruptcy.

When applying leverage ratios consider the following:
- Debt to Equity Ratio (%) indicates the extent to which debt is covered by shareholder’s funds. It is a measure of the protection available to lenders and the financial risk associated with lending funds to business. The higher the ratio, the less protection is open to the lenders.
- Long-Term Debt to Equity Ratio (%) reflects both the protection available to long-term lenders as well as risks associated with lending to business.
- Total Debt to Total Assets Ratio – Debt Ratio (%) shows the proportion of assets that are financed externally by debt, instead of by shareholders. The more significant the proportion of assets financed by debt, the higher the risk to the lender as the borrower will need more finances to service the loans, and there would be a higher chance of default.
- Interest Coverage indicates whether or not profits before interest expense and income tax are adequate to meet interest expense. The lower the ratio, the more likely the company may default. The general rule of thumb is a minimum cover of two to three times for established business, which means that the business would be able to cover its interest cost two to three times from its earnings during the specific period the more significant the ratio, the higher the protection business has.
Valuation Ratios
Valuation ratios are another method which can be used to evaluate the investment potential of the business. The following is a method which can be used to establish investment potential:
(a) Earnings Per Ordinary Share
This ratio will reveal how much has been earned per ordinary share during the year.

Preference shares may be issued as well as ordinary shares. The preference share dividends are paid first out of net profit after tax. The ordinary shareholders are paid out of the remainder.
The higher the net profit after tax, the greater be the earnings per ordinary share will be. Preference dividends are fixed irrespective of the level of profits.
Investor Ratios (Dividend)
A dividend is a distribution of a portion of a company’s earnings to holders of its stock. When a company makes money, it has the option to share that profit with its stockholders or retain that money as earnings, which it is then free to reinvest. If a company opts to pay dividends to its shareholders, they can be issued as cash payments, shares of stock, or other types of property.
When a company pays dividends, its board of directors decides what percentage of its earnings to distribute to shareholders. Though dividends are usually paid quarterly, a company that pays dividends is not required to do so every quarter.
To determine the dividends, the following ratios can be applied:
(a) Dividend Per Ordinary Share
Dividends are distributed out of profits to ordinary shareholders. The ratio to determine the dividend paid per ordinary share is as follows:
Dividend per ordinary share:
<Insert Image: >
(b) Dividend Yield
This ratio measures the dividend per ordinary share as a percentage of the market price per share and gives the investor an indication of what percentage of investment is received back in the form of a dividend.
Dividend yield:

(c) Earnings Yield
This is a measure of the earnings of the ordinary shareholders as a percentage of the market value of the ordinary shares.
Earnings Yield:
Earnings for ordinary shareholders
Market valuation for ordinary shares
(d) Price-Earnings Ratio
This is a measure of the market price of an ordinary share to the business’s earnings per share.
Price-earnings ratio:
The market price of ordinary shares
Earnings per ordinary share
The ratio represents how much a prospective shareholder will pay to acquire a dollar in profits of the business and indicates the number of years it will take for an investor to recoup the amount invested.
Communicating Budget Information
Communicating the financial options and processes required when establishing and structuring the business is essential. As the advisor, the consultation regarding the budget process may involve forwarding a draft budget. This would then involve discussions regarding any further inclusions or establishing any additional information needed to ensure all information which is provided is accurate.
Quite often, face-to -face meetings will need to be arranged to clarify important aspects of the budget. Teleconferencing and video conferencing can be used to overcome geographical barriers and meetings also serve as brainstorming exercises to discuss alternative ideas.
Once the budget is approved, it serves as a document which delegates the authority to various levels of the organisation. By establishing position descriptions and differentiating various activities performed by staff members ensures that there are clearly defined responsibilities. Sharing information also fosters a sense of belonging within the workgroup.
For a budget to be effective, there must be communication up and down the organisation.
The method used to present the budget include tables or charts or can be distributed through newsletters and memos. Budgets can be made available in a manual format or stored electronically.
Explanations for any significant deviations in budgets and plans must be reported.

The Need for Finance
A business commencing operations may need to buy, lease, or rent premises. There may also be a need to purchase equipment, machinery, stock, or motor vehicles. For some businesses, there may be a need to seek finance to assist with the day-to-day running of the business.
Finance for businesses can be sourced internally or externally. An example of an internal source of finance is retained profit.
The most common external sources of finance come from institutions such as banks and money lending organisations.
Companies may issue shares to raise additional capital and may also borrow from the public in the form of debentures.
The cost of borrowing finance from a lender is the interest paid on the loan. The interest rate will depend on market conditions and the term of the loan.
For sole traders and partnerships, financial resources are the capital supplied by the owners and any short-term or long-term borrowing from financial institutions.
For corporations, finance can be raised from shareholders and debenture holders. The ordinary shareholders are the owners of the corporation and any profit retained may be paid to the shareholders in the form of dividends. 2
There are many options available which can provide both short and long-term finance options.
The following are several of the options which clients could be given advice on if finance for the business is necessary.
Short-Term Borrowing
The interest paid on short-term borrowings is usually higher than for long-term borrowing. The cost of short-term borrowing is the amount of interest paid which can be a fixed rate or a variable rate.
The most common forms of short-term borrowing include:
- Personal loan – Obtained from a commercial bank or financial institution.
- Bridging finance – A temporary loan for a set period.
- Bank overdraft – An organisation is allowed to draw funds over the available balance in the account and is settled through deposits into the account.
- Commercial bills – A promissory note or bill of exchange is issued by the borrower stating the loan will be repaid to the lender at a determined future time. The borrowed amount is net of interest. For example, if the repayable amount is $2,000 and the interest rate is 10%, the amount borrowed is $1,800. The bill may be treated as commercial property and sold or discounted to another financial institution by the lender.
- Factoring debtors – The accounts receivable is given as security for the borrowing. This allows the organisation to receive a certain percentage (e.g. 70% of the accounts receivable over the credit period before the accounts is settled). 2
Interest Rates
Financial intermediaries such as banks provide finance and arrange the lending to the client. The institution that lends money is paid compensation by way of interest and the money borrowed is referred to as the “principal”. Interest payable for one (1) year is expressed as a rate of interest. Where money is borrowed for a shorter period of one year, the interest rate is pro-rated.
Below is an example of this type of borrowing and the calculations which are used to establish the interest payable etc.
Example:
The amount borrowed is $20,000. Interest payable is $1,600.
Rate of interest per annum
= Interest per year x 100
Principal
= 1,600 x100
20,000
= 8%
Simple interest is defined as the product of the principal amount, the rate of interest per annum and the period for which the amount is borrowed.
Simple interest (I) = P x R x T
The principal and interest added together are referred to as “the amount” which can be expressed as “S”.
In most commercial transactions, interest is calculated on the assumption that the interest for a period increases the principal amount for the next period. Instead of calculating interest for each period on the same principal amount, interest is calculated on the principal plus accumulated interest.
The principal plus the simple interest for the period becomes the new principle for the next period. The total of the different interest amounts for different interest periods is called “compound interest”.
The formula to calculate the compounded amount “S” is expressed as follows:
S = P (1 + R) n
Where “n” is the period.
The compound interest is obtained by deducting the original principal from the compounded amount.
Example 1:
A person invests $2,000 at 10% per annum compounded annually for three (3) years. How much will the investment growth over the three (3) year period be?
| $ | |
|---|---|
| Principal for the 1st year | 2,000 |
| SI on $2,000 for one year at 10% pa | 200 |
| Principal for the 2nd year | 2,200 |
| SI on $2,200 for one year at 10% pa | 220 |
| Principal for the 3rd year | 2,420 |
| SI on $2,420 for one year at 10% | 242 |
| Principal at the end of the 3rd year | 2,662 |
| Compound interest for 3 years | $662 (200 + 220+ 242) |
Alternatively, the compound interest is $2,662 - $2,000 = $662
The amount of the principal invested after 3 years can also be calculated using the following formula:
S = $2,000(1 + .1)3
= $2,662
The rate of interest is usually expressed per annum however for shorter periods where the annual rate is 24% the annual rate can be converted as follows:
Rate per quarter = 24%/4 = 6%
Rate per month = 24%/12 = 2%
Rate per day = 24%/365 = 0.06575% (approx.)
In the formula above, “P” represents the amount of money for the present time or the present value and “S” represents a future value.
Where “P” is the subject of the formula, the formula can be re-arranged as follows:
P = S
(1 +r) n
Example 2:
Using the figures in the previous example and based on the formula above:
P = $2,662 (1 +.1)3
= $2,000
The value of (1 +r) n is called the present value factor of the discounting factor. 1
Long-Term Funding
Long-term funding can be in the form of money invested by shareholders or retained profits. This form of funding is known as owner’s equity and does not attract interest.
Shareholders are paid dividends on their investment which are distributed out of the profits earned by the company. Funding can also be raised through debentures or mortgage loans.
The interest on any loan taken out by an organisation is an allowable tax deduction. The actual interest paid less the tax benefit is called the “after-tax cost of capital”.
The following are some of the standard long-term funding options which are available:
(a) Issue of Shares
Incorporated companies raise capital by subscribing to the public to apply for shares. The shares may be ordinary and preference shares. Ordinary shares attract dividends which are distributed out of the profits. A rights issue of shares is made to the shareholders at a reduced price compared to the market price of the shares. The rights issue may be that the shareholder is entitled to one share for every three shares held.
The cost of ordinary shares is the dividend paid to shareholders (e.g. 10% dividend) is 10% of ordinary share capital. As dividends are paid out of distributed profits, there are no allowable tax deductions.
Preference shares are a right by shareholders to the specified dividend (e.g. 5% of the nominal value of the share each year from company profits). Preference dividends carry fixed percentage dividends each year. The cost of preference shares is the percentage dividend that is paid.
(b) Retained Earnings
Retained earnings are the profits made by a company each year. The retained earnings are distributed to shareholders in the form of dividends. However, retained earnings may be set aside for future expansion projects. The share capital plus the retained earnings represent the owner’s equity in the business.
(c) Debentures
Debentures are usually issued by offering company assets as security against the loan by creating a trust deed. A fixed percentage interest on the borrowed amount is paid to the lender annually. The interest must be paid whether or not the company makes a profit and the amount borrowed must be paid at the end of the term. The cost of debentures is the percentage interest paid on the face value of the debenture and is a before-tax cost. Debenture interest is an allowable deduction. The after-tax cost of a debenture of 10% if the tax rate is 30% is as follows: 10% x (100% - 30%) = 7%.
(d) Unsecured Notes
If the company does not provide any security on the borrowing, the borrowing is referred to as “unsecured borrowing”. The document to acknowledge unsecured borrowing is called an “unsecured note”. A fixed percentage of interest must be paid to the lender whether the company makes a profit and the amount borrowed must be paid at the end of the term.
As there is no security for the amount borrowed, the interest rate is higher than that paid on secured debentures. The interest on unsecured notes is an allowable deduction.
(e) Mortgage Loans
These loans are obtained by providing security in the form of assets. The assets are mortgaged against the loan. A mortgage differs from a debenture in that with a debenture loan a certificate is issued, and the debenture certificate can be traded in the financial market as can a share certificate. A mortgage loan cannot be transferred from one lender to another. The capital borrowed on a mortgage loan may be repaid periodically. The interest on unsecured notes is an allowable deduction.
(f) Leasing/Sale and Leaseback
Assets can be leased without having to make a capital outlay. Leasing is an indirect form of funding. Sale and leaseback is a process where an asset is sold to release the capital tied up in the asset, and the funds can be used for other purposes. The asset is then leased back from the purchaser. The advantage of sale and leaseback is that an organisation can use the required asset and release funds for other projects. 2
Cost of Long-Term Funding
The cost of long-term funding may be the interest on loans or dividends paid on shares. The interest paid on loan for any business is an allowable tax deduction. The part of the interest is refunded in the form of the amount of reduced tax payable on the income of the organisation. The interest paid less the tax benefit is called “the after-tax cost of capital”. The cost of ordinary shares is the dividend paid by the company which is usually expressed as a percentage.
Cost of Ordinary Shares
Example 1:
Calculate the cost of ordinary shares where a 10% dividend is paid at the end of the year on a fully funded ordinary share with a face value of $1 and a market value of $1.50.
The formula to use is:
Cost of capital = Dividend(D) x 100
The market price of the share (P)
Cost of capital = ($1 x 10%) x 100
2
= 5%
If the cost of ordinary shares is expected to grow at the rate of 3% per annum, the cost or ordinary shares will be 5% + 3% = 8%.
If the dividend per share is 10¢ and the growth rate is 10%, the dividend at the end of year two will be 11¢.
Example 2:
Calculate the cost of ordinary shares at 30 June X2. The dividend-price per share at 30 June X1 is 5¢. The growth rate per annum is 5%. Market price per share at 30 June X2 is $1.
Dividend price per share: 5¢ + (5¢ x 5%) = 5.25¢
Cost of ordinary shares at 30 June X2 = (5.25¢ x 100) + 5%
100
= 10.25%
Cost of Retained Earnings
The cost of retained earnings is similar to retained earnings. The cost of retained earnings, however, can be expressed as the cost of a benefit forgone.
Example:
$5,000 was distributed to shareholders instead of being retained. The amount distributed can be invested at 10% per annum. The benefit forgone is 10% of $5,000 which equals $500.
If the company tax rate is 30% the after-tax benefit is:
$500 – (30% x $500) =$350.
The opportunity cost of retained earnings: $350 x 100 = 7%
$5,000
Cost of Debentures
The cost of a debenture can be calculated from its market price where:
Cost of debenture = Face value (C) x 100
P
Example:
Calculate the cost of 8% $200 debentures with a current market price of $150.
Interest = 8% x $200 = $16
Cost of debentures before tax = 16 x 100
150
= 10.67%
Cost of debentures after tax = 10.67 x (100 -30) %
= 7.47% 1
Weighted Average Cost of Capital
The Weighted Average Cost of Capital (WACC) allows management to assess the most effective way to fund a new project to maximise its financial performance. WACC assists decision makers to decide the best mix of the source of funding to minimise costs. Minimising the cost of capital financing enables the organisation to meet its objectives.
For example:
Goldberg Mining Company wants to raise $2,000,000. The funds comprise debentures of $600,000, retained earnings of $500,000, issue of new shares $900,000. The company tax rate is 30%. The cost of retained earnings is 10%; the cost of new ordinary share issues is 5% and 8% debentures. Calculate the WACC.
| Funds | Amount $ | Proportion % | Cost % | WACC (proportion % of cost %) |
|---|---|---|---|---|
| Debentures | $600,000 | 30% | 5.6% | 1.68% |
| Retained earnings | $500,000 | 25% | 10% | 2.5% |
| New share issue | $900,000 | 45% | 5% | 2.25% |
| 2,000,000 | 100% | 6.43% |
(Note: Proportion % is proportion of total outlay, e.g.600,000/2,000,000 x 100)
The 8% debentures mean the company is paying debenture holders $8 for every $100 lent to the company. The $8 can be claimed as a tax deduction, e.g. ($8 x 30% = $2.40).
The after-tax cost of debentures can be calculated by taking 70% of 8 = 5.6%.
The WACC is calculated by multiplying 30 x 5.6% etc. 1
Capital Expenditure

Many businesses will seek advice on their financial performance so that decisions regarding future capital expenditure can be made. It is essential to establish and evaluate the most effective method for funding the new capital and select the option which will provide maximum benefit to the business.
A simple method to address this is by determining which amount of money invested will earn the equivalent of the interest that could be earned if the money was left in a deposit account in a financial institution for the same period.
Two (2) evaluation methods for determining this are the non-cash flow method and the cash flow method.
The non-cash flow method is an accounting rate of return (ARR) method which expresses accounting profit as a percentage of the initial investment.
The second method which is the cash flow method takes into account the non-discounted cash flow and the discounted cash flow. The non-discounted cash flow method is the payback period which calculates the time required to cover the initial investment.
The typical discounted cash flow methods used include:
- The net present value method
- The internal rate of return method
- The discount payback period method
Accounting Rate of Return (ARR)
The ARR is the average profit expressed as a percentage of the original capital investment, both fixed and working capital. The profit is usually profit after any depreciation but before tax.
The ARR can be calculated as follows: ARR = Average annual profit x 100
Original outlay
Example 1:
Project A requires an initial outlay of $250,000. There is no scrap value after five (5) years. If the average annual profit before tax is $50,000 what is the ARR.
ARR = 50,000 x 100 = 20%
250,000
Example 2:
The other approach is to use average capital. This is arrived at by adding the capital employed at the beginning of the period and the capital employed at the end of the period and dividing by 2.
Project B requires an initial outlay of $300,000. There is scrap value after five (5) years of $4,000. If the average annual profit before tax is $60,000 what is the ARR.
ARR = 60,000 x 100 = 39.47%
(300,000 +4,000)/2
The investment with the higher ARR is the more attractive investment. The disadvantages of the ARR are that:
it does not consider the time value of money, and
it does not depend on cash flows expected from investments.
Payback Period
This method is useful if the information required is based on how long a project will take to recover the initial outlay. It is calculated by adding the cash flows for each year net of operating cash flow until the total equates with the initial outlay.
Example 1:
$56,000 is invested on a piece of equipment.Net cash flows of $8,000 are expected each year. Calculate the payback period:
Year 1 - 7,000
Year 2 - 7,000
Year 3 - 7,000
Year 4 - 7,000
Year 5 - 7,000
Year 6 - 7,000
Year 7 - 7,000
Total - 56,000
Payback period is 7 years.
Example 2:
The total outlay is $40,000. The cash flows for years one (1) to five (5) are as follows:
$
Year 1 - 40,000
Year 2 - 6,000
Year 3 - 12,000
Year 4 - 5,000
Year 5 - 10,000
Year 6 - 10,000
Year 1 represents the cash outlay of $40,000.
After year 5 $33, 000 has been recovered. In year 6 $10,000 is recovered. The remaining $7,000 will be recovered in 12/10,000 x 7,000 = 8.4 months Total payback period = 5 years 8.4 months.
The project with the shorter payback period is the more attractive investment.
The disadvantages of the payback method are that it ignores cash flows after the payback period and it does not consider the time value of money.
Discounted Cash Flows
Cash receipts and cash disbursements are referred to as “cash flows”. A project will only be worthwhile if the total cash inflows (receipts) exceed total cash outflows (payments). To rank projects for selection purposes, expenses and revenue must be compared. In this respect, capital investment and operating expenses are considered costs and all income is considered revenue.
Example:
An investment is expected to bring cash inflows of $3,000 and $3,200 during the first year and $3,300 and $3,500 on the second year.
- Cash inflows year 1 = $6,2oo ($3,000 + $3,200)
- Cash inflows year 2 = $6,800 ($3,300 + $3,500)
Cash flows take place over a specific period. The cash flows for a future period will have a different value to their present value. The concept being that future cash flows will earn interest in future periods. For example, $100 invested at 10% in year one will be worth $110 in year 2 and $121 in year 3.
The process of converting future cash flows into their present value is called “discounting”, and the amount obtained by discounting is called “the discounted cash flow”. The discounted cash flow is used in all cash flow analysis for evaluating capital projects. 1
Example:
Calculate the discounted value today of $2,200, $2.500, $2,600 receivable at the end of each of the first three (3) years respectively. The interest rate is 6.5%.
$2,200 x (1/1.065) + 2,500 x (1/1.065/1.065) + $2,600 x (1/1.065/1.065/1.065)
=$2,200 x .9389671 + $2,500 x .8816593+ $2,600 x .8278491
= $2,065.73 + $2,204.15 + $2,152.41
= $6,422.29
Net Present Value
Each operating cash inflow and outflow in future years is brought to its present value at an interest rate called the minimum rate of return. The required rate of return may be the interest rate for which finance has been borrowed for the project.
Alternatively, the interest rate may be increased by a percentage of an earning rate which the organisation needs for the project. The difference between the total values of cash inflows and outflows when added to the initial investment is called the net present value (NPV). When deciding the projects with a positive NPV are accepted, and those with a negative NPV are rejected.
Example:
Calculate the NPV of a project after its useful life of five (5) years and decide whether it is a valuable project. The required rate of return is 8% per annum. Cash inflows and outflows are set out below.
PV Factors for 8% are:
Year 0 – 1.0000; Year 1 .9259; Yea2 0.8573; Year 3 .07938; Year 4 .7350; Year 5 – 0.6806
| End of year | 0 | 1 | 2 | 3 | 4 | 5 |
|---|---|---|---|---|---|---|
| $ | $ | $ | $ | $ | $ | |
| Capital outlay | -15,000 | -15,000 | ||||
| Cash inflow (operating) | 14,000 | 25,000 | 24,000 | 32,000 | ||
| Cash outflows (operating) | -8,000 | -15,000 | -15,000 | -22,000 | ||
| Scrap | 7,000 | |||||
| Net capital outlay | -15,000 | -15,000 | ||||
| Net operating cash flow | 6,000 | 10,000 | 9,000 | 10,000 | 7,000 | |
| PV factor at 8% | 1.0000 | 0.9259 | 0.8573 | 0.7938 | 0.7350 | 0.6806 |
| PV of capital outlay | -15,000 | -13,889 | ||||
| PV of net operating cash flow | 5555 | 8,573 | 7,144 | 7,350 | 4,764 |
Total present value of capital outlay = -$15,000 + $13,889 = $28,889
Total present value of net operating cash flow = $5,555 + $8,573 + $7,144 +
$7,350 + $ 4,764 = $33,386
NPV = $33, 386 - $28,889 = $4,497
As the NPV figure of $4,497 is positive the project should be accepted.
Where more than one project must be considered, the best project option is the one with the highest NPV.
Profitability Index
Although a project may show the highest positive NPV, it may not be the most efficient. A profitability index is created to determine which project uses the capital invested in the most efficient manner by comparing the present value of all net operating cash flows with the capital outlay.
Profitability index = Present value of all operating cash flows
Capital Outlay
Where two (2) projects are compared with similar net cash flows but have different capital outlays, the project with the highest capital outlay will show the highest index. Management may prefer the one with the highest profitability index as the organisation may want to make more profits with less outlay. 1
What Are Contingency Plans?
When organisations do not perform as expected, remedial action needs to be taken to minimise the negative impact and to maximise the benefits.
Risk management and the development of contingency plans are integral to the success of any business.
Working in financial services, you may be called on to assist in identifying the potential risks and developing the appropriate contingency plans to mitigate the risks as part of the organisation’s risk management strategies.
Contingency plans are only implemented when a negative event occurs, such as a decline in sales due to a cheaper substitute product. Contingency plans play an essential part in the remedial action. Remedial action can be undertaken using variance reports. Once contingency plans are implemented, they need to be monitored for success.
Contingency plans form part of the control process in risk management. A contingency plan is undertaken to avoid disruptions in normal business operations, and the plans should be reviewed and updated regularly as the conditions and assumptions on which the contingency plans are based may change.