This topic will introduce the skills and knowledge required to develop process models. You will also have the opportunity to practice developing several types of process model diagrams using industry-standard modelling tools.
In this topic, you will learn how to:
- prepare to develop process models
- draw data flow diagrams
- draw BPMN diagrams.
Watch
In this video (1:40 mins), Henry shares some advice on developing process models using modelling techniques such as context diagrams and data flow diagrams.
Let us begin.

General guidelines
By following these guidelines, you can develop well-structured and accurate process models that effectively represent the organisation's processes and data flow. These models serve as valuable tools for process improvement, communication, and decision-making.
Begin creating process model diagrams based on the chosen methodology using these four steps:
- Start with a high-level process diagram that provides an overview of the entire process.
- Use symbols and notations specific to your chosen methodology to represent activities, tasks, decisions, data flows, and other relevant elements.
- Detail sub-processes and activities as necessary, creating hierarchical diagrams to represent the process in more granular detail.
- Use swimlanes or swimlane pools to indicate different roles, departments, or entities involved in the process.
Label and annotate
Label each element of the process models clearly. Use descriptive names and annotations to explain the purpose and functionality of each component. Annotations are mechanisms for a modeller to provide additional information for the reader of a process diagram.
To ensure that anyone reviewing the models can understand them without additional context you should consider:
- Document data flows: Clearly document data flows between process components using the appropriate symbols or notations. Indicate the direction and content of data flow, including data objects, data stores, and data associations.
- Define inputs and outputs: Specify the inputs required to start each activity and the outputs generated by each activity. This helps in understanding data dependencies and handoffs between activities.
- Represent decision logic: Clearly represent decision points and decision logic within the process. Use decision gateways or decision diamonds to indicate where choices are made and which path the process follows based on conditions.
- Include exception paths: Model exceptions or alternate paths within the process. Show how the process handles errors, exceptions, or deviations from the standard flow. Use conditional flows or exception paths as needed.
- Document business rules: If applicable, document the business rules and logic associated with the process. This may include validation rules, calculations, or compliance requirements.
Follow organisational and industry standards
Following standards helps in maintaining the quality of process models. Standards often include best practices that can prevent common modelling mistakes and ensure the accuracy and reliability of the diagrams. Adhering to organisational and industry standards when drawing process model diagrams ensures consistency, clarity, interoperability, compliance, efficiency, quality, and effective communication, all of which contribute to better decision-making and successful process management.
Following organisational and industry standards when drawing process model diagrams is crucial for several reasons:
- Consistency: Standards ensure that diagrams are created in a consistent manner across the organisation or industry. This consistency aids in understanding and interpreting the diagrams, reducing the risk of miscommunication and errors.
- Clarity: Standards often prescribe specific symbols, notations, and conventions that enhance the clarity of process models. This clarity makes it easier for stakeholders to grasp the information presented in the diagrams. This efficiency is especially valuable in complex projects or when onboarding new team members who are already familiar with the standard notations.
- Communication: Process models serve as a means of communication between different stakeholders, including business analysts, developers, and management. Using standards ensures that everyone speaks the same visual language, facilitating effective communication.
Select process mapping tools
When selecting process mapping tools for context and data flow diagrams, consider factors such as your team's preferences, the level of collaboration required, and your budget. Many of these tools offer free trials or free versions with limited features, allowing you to evaluate them before making a decision.
Watch

Drawing context and Level-1 data flow diagrams (DFDs) is an effective way to visually represent the flow of data within an organisation's processes.
Let's create context and Level-1 DFDs for the XYZ Manufacturing scenario, starting with the context diagram.
Context diagram (Level-0 DFD)
Context diagrams, often referred to as Level zero (0) diagrams, provide a high-level view of a process within its surrounding environment. They are beneficial for stakeholders who need an overview of how a process interacts with external entities, such as customers, suppliers, or other systems.
Key considerations
In the context diagram, we'll represent the entire organisation as a single process and show external entities that interact with it. We'll also indicate the main data flow between the organisation and external entities.
The context diagram must:
- be drawn according to the organisational standards
- include a main entity (i.e. proposed system)
- include external entities that interact with the main entity
- show relationships between the main and external entities (i.e. input and output data flows).
Context diagram example
In this demonstration, the free diagramming tool draw.io (diagrams.net) was used to draw the context diagram as you can see in this screenshot:
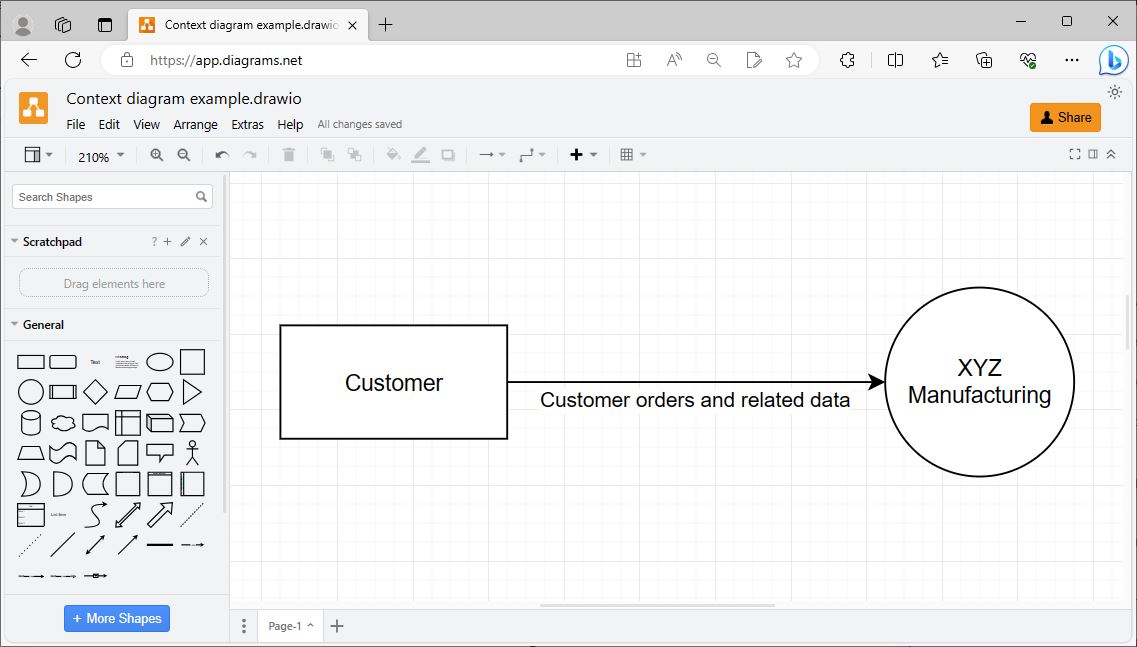
In the context diagram:
- "XYZ Manufacturing Company" represents the organisation as a single process.
- "Customer" represents an external entity (e.g., customers placing orders).
- The arrow indicates the main data flow between the organisation and external entities, which includes customer orders and related data.
Drawing a context diagram – Demonstration
This video (4:37 mins) demonstrates how you can design and develop context diagrams according to an organisational scenario. Pay attention to the various symbols used to represent roles, entities and the relationship between entities.
Practice
Practice using process mapping tools to draw the context diagrams demonstrated in this topic. Draw a context diagram representing the ‘Product Management System’ of XYZ Manufacturing as a single process.
In your diagram represent:
- external entities such as ‘Suppliers’, ‘Shipping Company’, ‘CRM’ and ‘Transaction Processing System’
- data flows between the main process and the external entities.
Key considerations
DFDs are particularly valuable when understanding data dependencies, data transformations, and how data supports or triggers process activities.
The data flow diagram must:
- be drawn according to the organisational standards
- represent the main processes of the proposed system
- include any external entity(s) that interact with the process(s)
- represent the data stores required to support the processes
- show relationships (data flows) between the external entity(s), processes and data stores.
Level-1 DFD example
Now, let's create the Level 1 DFD, which provides a more detailed view of the processes within the XYZ Manufacturing organisation.
In the Level 1 DFD, decompose the organisation's main process into its key sub-processes and depict the data flows between them.
This diagram includes external entities, processes, and data stores and will provide a more detailed view of how data flows within the organisation:
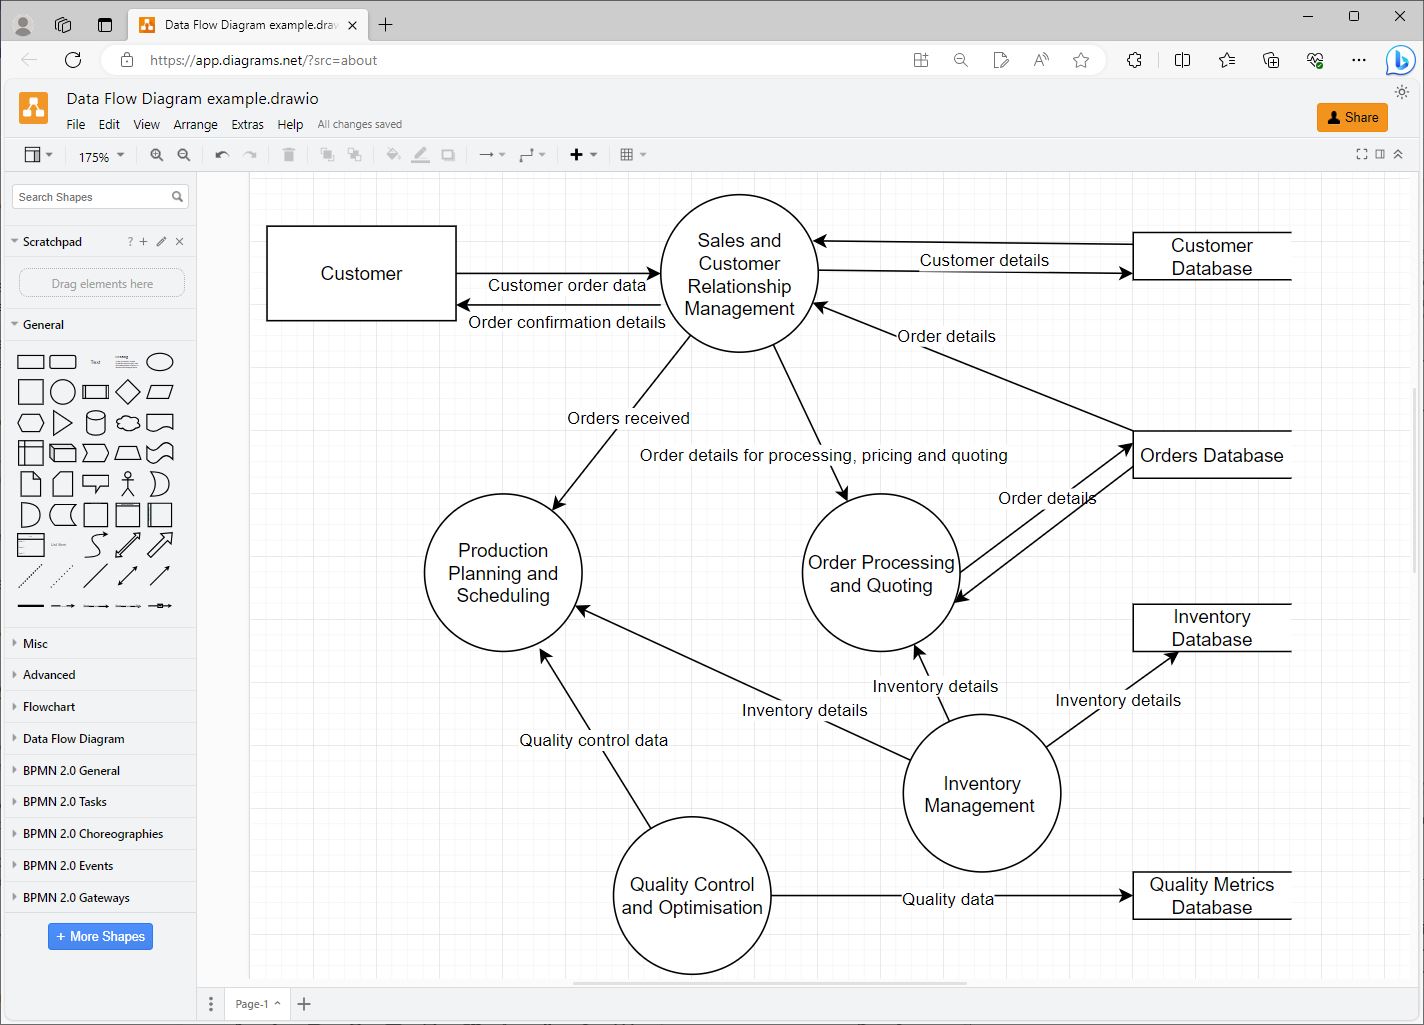
In the Level 1 DFD:
- "XYZ Manufacturing Company" represents the organisation as a whole.
- "Customer" is an external entity (representing customers who place orders with the company).
- The five main processes within the organisation are depicted: Sales and Customer Relationship Management, Order Processing and Quoting, Production Planning and Scheduling, Inventory Management, and Quality Control and Optimisation.
Now, let's discuss the data flows between these elements:
- Data flows between “Customer" and "Sales and Customer Relationship Management" to represent the customer orders and related data.
- Data flows between "Sales and Customer Relationship Management" and "Order Processing and Quoting" to illustrate the processing of customer orders.
- Data flows between "Inventory Management" and various processes to show the flow of inventory-related data.
- Data flows between "Quality Control and Optimisation" and production processes to depict the quality control checks and optimisation efforts.
- Data stores are represented as rectangles with three sides and are used to indicate where data is stored within the organisation. (e.g. orders database, customer database)
Drawing a DFD – Demonstration
Watch
This video (3:57 mins) demonstrates how you can design and develop data flow diagrams according to an organisational scenario. Pay attention to the various symbols used to represent roles, entities, data stores and the relationship between entities.
Lucidchart demonstration
Watch
This video (7:55 mins) further demonstrates how a process mapping tool called ‘Lucidchart’ is used to draw the data flow diagram.
Practice
Practice using a process mapping tool of your choice to draw the data flow diagrams as demonstrated in this sub-topic.
BPMN tools
There are a variety of tools, here are some examples.
- BPMN Editor
- Camunda Modeler Download. Refer to Camunda Platform 8 Docs for more information on this platform and how to use it.
- Visual Paradigm Online
Key considerations
The most basic process model includes a trigger event, a sequence of activities, and a result. A more comprehensive process model can include other elements, such as data/ materials, inputs and outputs, and call-out descriptions that supplement the graphical representation.
The BPMN diagram must:
- be drawn according to the industry standard BPMN specification
- include events (e.g. 'Start', 'Intermediate' and 'End')
- include different types of activities (e.g. user tasks, service tasks, business rule tasks and/or sub-processes) use 'Pools' to partition sets of activities between participants
- include gateways, sequence flows, message flows and associations with relevant data stores
- include text annotations where necessary to indicate assumptions made.
Watch
This video (1:44 mins) demonstrates how to use BPMN elements to create diagrams.
Scenario walkthrough activity
To model process data effectively in the context of the XYZ Manufacturing scenario, you can follow a modelling methodology such as Business Process Model and Notation (BPMN) or a similar approach. Here's how to model process data using BPMN as an example:
Step 1: Familiarise with the BPMN notation
Refer to the BPMN Quick Guide as often as required to ensure the notation rules and naming conventions are followed according to industry standards.
Watch
This video (12:49 mins) further explains the basics of the 'Business Process Modeling and Notation (BPMN)' standard.
Step 2: Create the process model
- Start with BPMN symbols: Use BPMN symbols to represent processes, activities, and data flow within your diagrams.
- Process modelling: Start by creating a BPMN diagram for each process or subprocess within the organisation. For example, create a BPMN diagram for the "Order Entry and Quoting" process.
- Data objects: Within each BPMN diagram, add data objects to represent the data elements associated with each activity. For instance, place data objects like "Order Details" and "Customer Information" next to the relevant tasks within the "Order Entry and Quoting" process.
- Data flow: Use data associations to indicate how data flows between activities, data objects, and data stores. Connect activities to data objects using data associations with clear labels. For instance, show how customer order data flows from "Receive Customer Order" to "Validate Order" and "Price Calculation."
- Data stores: If your organisation uses specific data stores or databases for storing data, represent them using the "Data Store" symbol in your BPMN diagrams. For instance, include a "Products Database" to show where inventory validation tasks query product availability.
Step 3: Annotate and document
- Add Descriptions: Use annotations and labels to describe data elements, data flow, and the purpose of data within each process. This helps make the diagrams more understandable for stakeholders.
- Documentation: Document the data modelling decisions and definitions in the accompanying documentation. Explain the meaning and usage of each data element and its relevance to the process.
By using these steps and using BPMN or a similar modelling methodology, you can effectively model process data for the XYZ Manufacturing Company. These models visually represent how data is used, stored, and flows within the organisation's processes, aiding in process analysis, improvement, and communication with stakeholders.
The diagram below is a sample process model drawn according to XYZ Manufacturing scenario to represent the ‘Order Processing Process’. Notice how the BPMN elements are used to represent events, activities, sub-processes, data store references and annotations in the diagram:

Using process modelling tools – Demonstration
Watch
This video (8:16 mins) demonstrates how to create a BPMN diagram using a tool called 'HEFLO'.
This next video (1:06 mins) uses draw.io/diagrams.net to create a BPMN diagram.
Practice
Practice using a process mapping tool of your choice to draw the BPMN diagrams as demonstrated in this sub topic.Watch
This video (1:57 mins) discusses the benefits of process modelling and how these models can be further reviewed and optimised for further improvements.
Conduct reviews
Reviews can be conducted in order to determine any inaccuracies in the process models developed. Review types include:
- Review internally: Before involving stakeholders, conduct an internal review of the models within your team or department. This allows you to address any inconsistencies or inaccuracies early in the development process.
- Review with SMEs: Anticipate questions and feedback from the SMEs. Be ready to explain the models, data flow, and process logic clearly during validation sessions. Ensure that the data flow aligns with the actual data movement within the organisation. Verify that data objects match the data elements used in practice.
- Review with Stakeholders: Review the process model diagrams with relevant stakeholders to ensure that the data modelling accurately represents the organisation's processes and data flow.
Email or text negotiation
Practice
Your role: You are working as a ‘Process Modeller’ at XYZ Manufacturing.
Your task: Draft an email to your client ‘John Doe’ to request validation of the process models you have developed. You must use XYZ Manufacturing’s standard email template to draft your email.
XYZ Manufacturing_Email template_v1.docx
Note: Assume you are including an attachment of completed process models with this email. Ensure that you mention information regarding this attachment in the body of the email for the email recipient's attention.
Congratulations on completing your learning for this topic Develop process models.
In this topic, you learnt how to:
- model data processes according to industry and organisation standards
- use process mapping tools to create process models
- model process data using context, data flow and BPMN diagrams
- validate developed models with client.
Assessments
Now that you have learnt the basic knowledge and skills for this module, you are ready to complete: Assessment 3 (Portfolio).