Financial administration is the process of administering and managing an organisation’s financial resources, such as procurement and utilisation of funds. The principles of financial administration uphold the value of financial discipline, supporting the business with achieving its goals and objectives.
Usually the person responsible for the financial administration of an organisation is the chief financial officer (CFO) or the finance manager. In smaller businesses, the person responsible is likely to be the business owner with the assistance of a book-keeper and/or an accountant.
The financial management of an organisation does not only include the budget process although this, of course, is the major component. There are various other aspects of financial management that need to be considered to ensure that the information used to compile budgets and forecasts as well as the information on the actual financial transactions of the business are accurate and therefore useful in determining the financial position of the business.
When it comes to documenting your budgets and projections depending on the software that you’re company is using will determine what data and documentation needs you may require.
The traditional way to document the budget is using the simple software Microsoft Excel.
Excel Budget Template
As we already know, accounting is the process of collecting financial data, classifying information, and recording, reporting, analysing and interpreting financial data to meet the information and reporting requirements of users concerned with the operations of a business. Generally, this process is represented as a cycle known as the accounting process.

Identification
- Business event
Measurement
- Dollar value
Recording
- Documenting business event and its dollar value
- classifying the type of business event
- summarising information regarding types of business events
Communicating
- Preparation of financial reports
- analysis and interpretation of reports

Budget preparation
- Budget estimates are calculated for the new budget year (identification)
- proposed budget is prepared based on the estimates (measurement)
Communication and approval
- Budget communicated to relevant parties
- negotiation of budget estimates
- final budget approved
Recording and reporting
Final approved budget is recorded as follows:
- classifying the type of business event
- summarising based on the classification groups
Analysing and communicating
- Final budget approved and distributed (communicating)
- budget is reviewed quarterly against actual data
- revised budget is communicated to staff responsible (communicating)
Presenting data
Data in its raw form can be hard to interpret, read and it can be hard for managers/stakeholders to make decisions if they do not understand the information given.
Data can be from:
- Cash flow projections
- Fixed costs information
- Sales records and projections
- Variable business costs
Presenting data in a format that is easily understood and appropriate to budget reporting can be via:
- Graphical representation
- Use of clearly formatted tables
- Presented via software
- Using explanatory notes of calculations used
- Highlighted estimates and projections
Five Data Storytelling Tips
With budget reports, financial reports are prepared as part of a cycle. Usually this is an end-of-year process where financial statements are prepared for annual reporting and audit purposes, in the case of larger organisations, or for small businesses these may be prepared by the accountant in preparation for tax time.
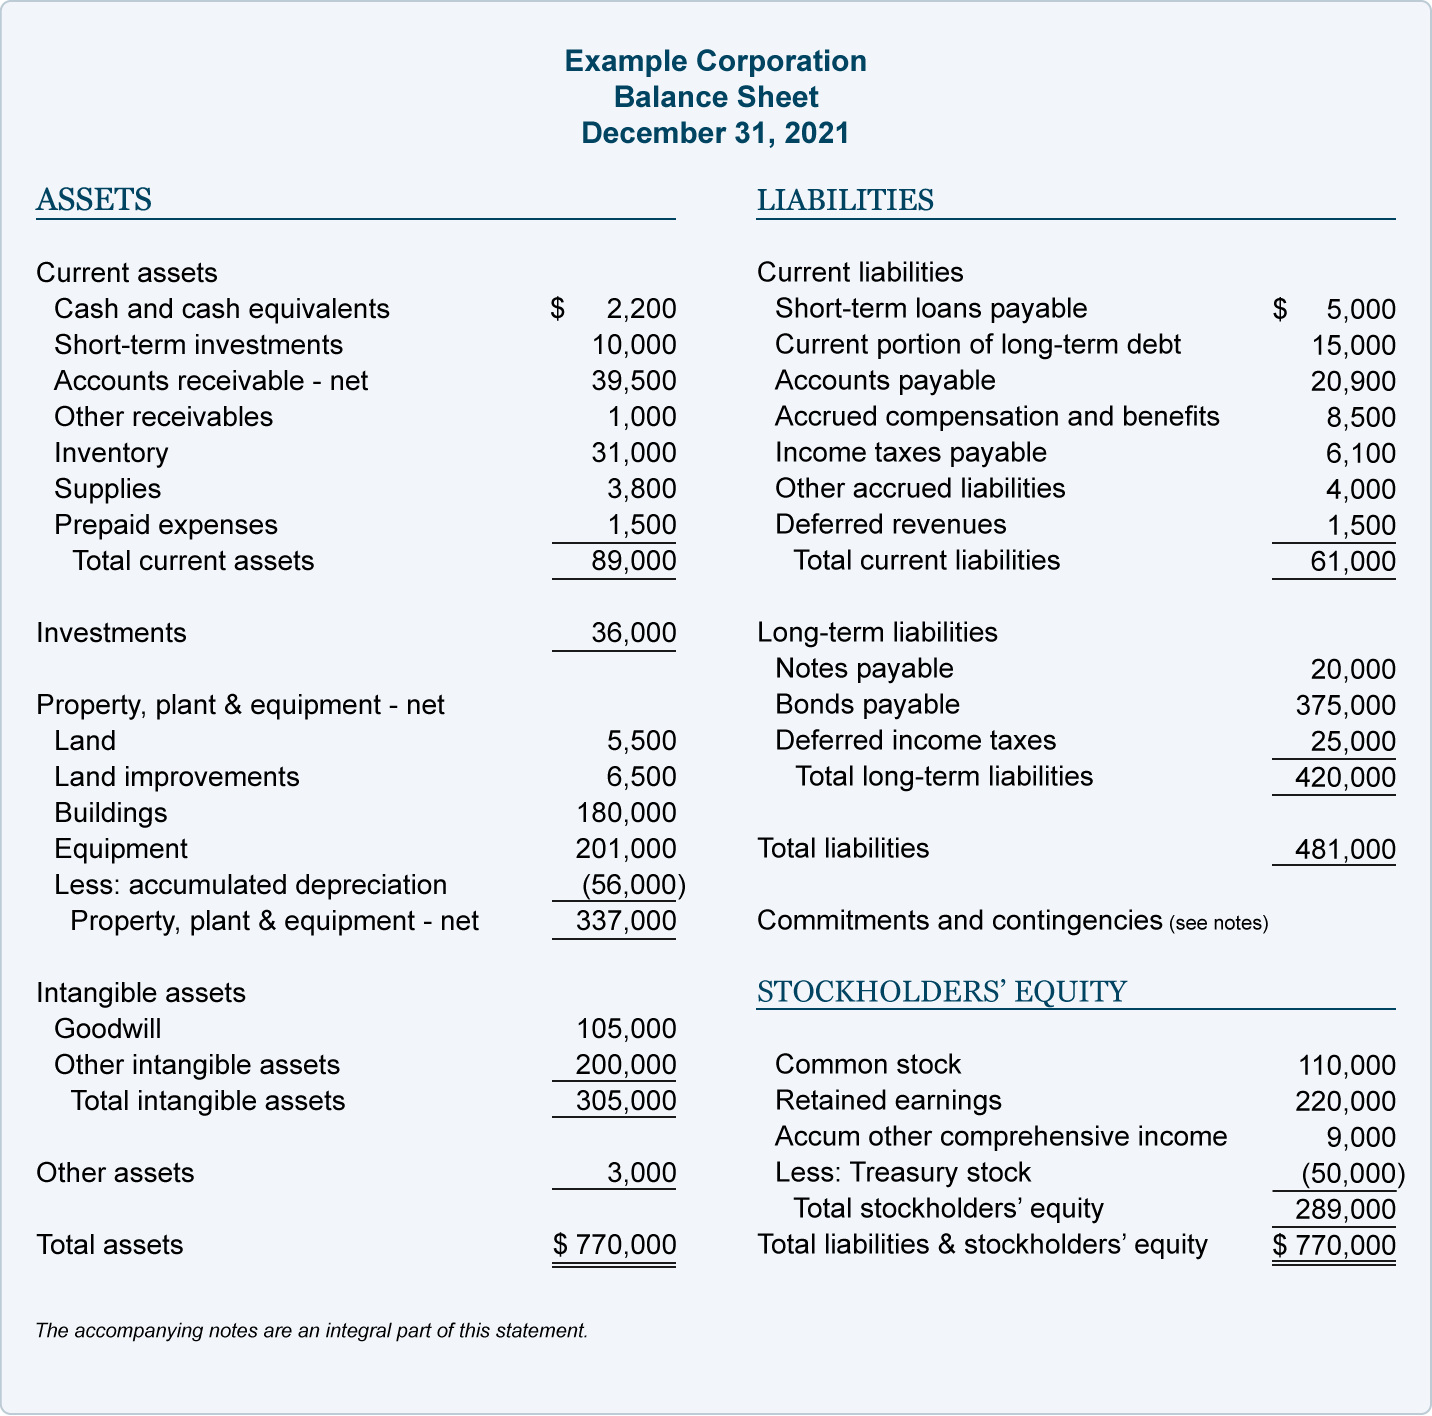
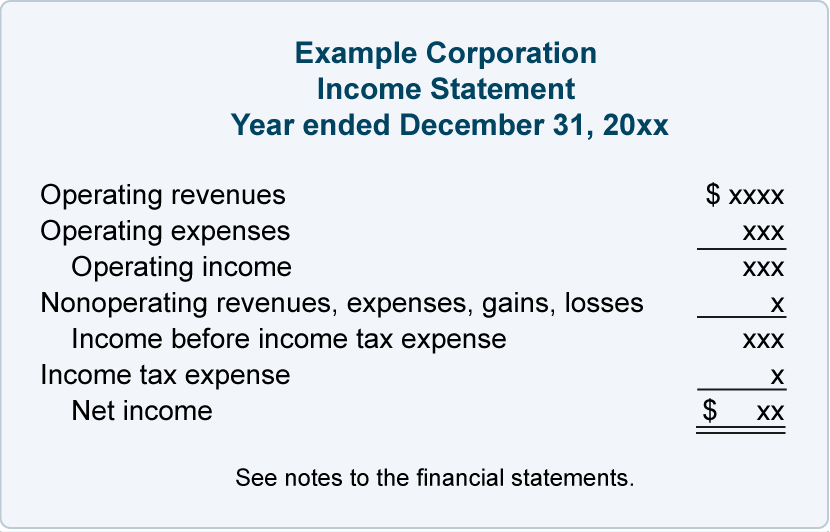
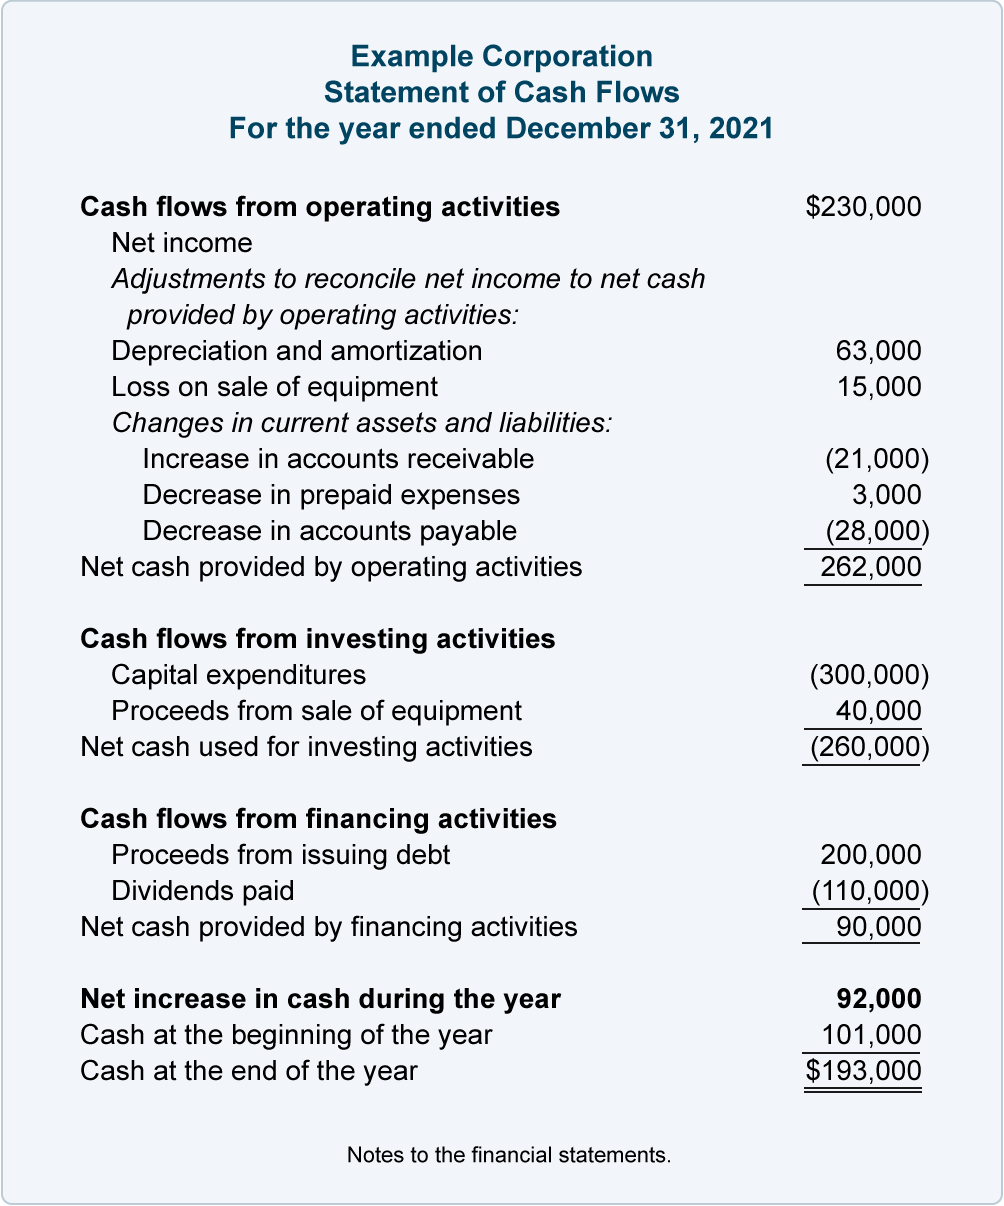
There are three main financial reports:
- the balance sheet
- the profit and loss statement
- the cash flow statement.
EXAMPLE: Balance Sheet
EXAMPLE: Profit and Loss Statement
EXAMPLE: Cash Flow Statement

Depending on the nature of the budget-setting process of an organisation, it is usual to establish budgets on an annual basis. This annual budget is then, naturally, segmented into months. The monthly budget periods, however, do not simply divide the annual figures by the number of months in the year, although that is the method used by some businesses to divide their budget allocations and estimates across the year.
Some organisations may have the resources to prepare a formal schedule for their budget and reporting process while smaller businesses may just have a brief checklist to make sure that nothing is missed. Whatever is the case the steps, milestones and actions are very much the same.
The most common time for businesses to start to look at next year’s budget is April, although depending on the size of the organisation the actual process may start well before this.
Another important consideration are the critical dates that have been established by the business as these will factor into the process quite significantly.
For example:
- Monthly reports deliverable by 15th of the following month.
- Quarterly budget preparation for management.
- Annual financial reports to be prepared within three months of end of EOFY (30 September).
Accounting reports are compilations of financial information that are derived from the accounting records of a business. These can be brief, custom-made reports that are intended for specific purposes, such as a detailed analysis of sales by region, or the profitability of a specific product line.
Reporting
Reports can include:
- Cash budgets
- Purchase budgets
- Sales budgets
- Performance reports
- Variance analysis
- Job cost records
- Manufacturing statements
- Job and service profitability reports
- Cost volume profit reports.
They should be:
- Accurate
- Timely
- Relevant
- Comprehensive
- Comply with organisational policies, procedures and practices
- Comply with management information requirements
- Presentable, clear and easy to read and understand
Analysing, interpreting and representing data
How to use data visualization
Examples of basic accounting reports:
- Balance Sheets
- Income Statements
- Cash Flow Statements
- Statements of shareholders equity
Five crucial accounting reports your business needs:
- Profit and loss statement
- Balance sheet
- Accounts Receivable Aging Report
- Revenue by customer
- Accounts payable aging
Establishing Critical Dates
Planning is the key to business success.
There are, of course, many other benefits to planning in a business setting. By reviewing the financial year in detail, trends of busy periods and slow periods become apparent, and through the use of this information a business can anticipate these occurrences and manage their finances accordingly.
These periods are identified as critical dates by the business. An example might be if a big shopping event is coming up, which may indicate that the business should invest in extra stock in anticipation of the higher volume of sales. Another example might be tax time for accountants and tax agents, or whether there are periods in the year that people get married, requiring more resources (time) for celebrants, accountants and tax agents.
Some retail-specific critical dates include:
- Black Friday: An American tradition adopted around the world, this is the Friday after Thanksgiving and participating stores slash the prices of their items online and in-store, leading to an annual shopping frenzy that often lasts the whole weekend.
- End-of-financial-year sales (EOFYS): The time of year when retail businesses sell off current stock before new stock arrives (around the month of June).
- Boxing Day Sales: Boxing Day sales are hugely popular and are part of the January sales, where customers flock to buy discounted items after Christmas.
- General sale times:
- seasonal clothing changes
- newly
- released items
- store
- specific events.
Other types of critical dates might include:
- Contract critical dates: For example, the commencement of a new supplier contract, or the date on which contracts with existing suppliers might need to be negotiated.
- Financial critical dates: This would include the required timeframes for monthly reports, budget preparation, annual financial reports.
- Operational critical dates: For example, the implementation of a new software, with a go-live date.

There are two (2) main causes for variances between the original budget and the actual results:
- The volume of activity is different.
- Dollar amounts of income and expenses are different.
Variances can either be favourable or unfavourable.

Example
A firm of accountants produces the following performance report information for the quarter ended 31 March.
| Master Budget $ | Actual Results $ | Variance $ | |
|---|---|---|---|
| Fees received | 80,000 | 91,500 | 11,500 F |
| Salaries variable per hour | 38,000 | 40,000 | 2,000 U |
| Motor vehicle expenses – fixed | 600 | 750 | 150 U |
| Motor vehicle expenses – variable | 700 | 720 | 20 U |
| Advertising – fixed | 1,500 | 1,400 | 100 F |
| Advertising – variable | 2,200 | 2,500 | 300 U |
| Office expenses – fixed | 22,000 | 24,000 | 2,000 U |
| Total expenses | 65,000 | 69,370 | 4.370 U |
| Net profit | 15,000 | 22,130 | 7,130 F |
This report shows a favourable variance of $7,130 due to increased fees which have been offset by an increase in expenditure in some cases. The budget needs to be reworked to show what the expenses should have been, based on actual results, e.g. the income of $91,500.
The variable expenses are calculated as a proportion of total fees received (based on a flexible budget approach). The budgeted variable costs based on actual total fees received are calculated as follows:
Variable costs ÷ total budgeted fees x total actual fees received
Salaries paid = $38,000 ÷ $80,000 x $91,500 = $43,463
Motor vehicle expenses = $600 ÷ $80,000 x $91,500 = $686
Advertising expenses = $2,200 ÷ $80,000 x $91,500 = $2,156
The reworked performance report for the quarter ended 31 March is as follows:
| Master Budget $ | Activity Volume Variance $ | Flexible Budget | Actual Results $ | Flexible Budget Variance | |
|---|---|---|---|---|---|
| Fees received | 80,000 | 11,500 F | 91,500 | 91,500 | |
| Less variable expenses | |||||
| Salaries | 38,000 | 5,463 U | 43,463 | 40,000 | 3,463 F |
| Motor vehicle expenses | 700 | 14 F | 686 | 720 | 34 U |
| Advertising | 2,200 | 316 U | 2,516 | 2,500 | 16 F |
| Total variable expenses | 40,900 | 5,765 U | 46,665 | 43,220 | 3,445 F |
| Contribution margin | 39,100 | 5,735 F | 44,835 | 48,280 | 3,445 F |
| Less fixed expenses | |||||
| Motor vehicle expenses – fixed | 600 | 600 | 750 | 150 U | |
| Advertising – fixed | 1,500 | 1,500 | 1,400 | 100 F | |
| Office expenses | 22,000 | 22,000 | 24.000 | 2,000 U | |
| Total fixed expenses | 24,100 | 24,100 | 26,150 | 2,050 U | |
| Net profit | 15,000 | 5,735F | 20,735 | 22,130 | 1,395 F |
There are various ways variance is measured:
- Labour rate variance: Difference between the actual and expected cost of labour.
- Variable overhead spending: Difference between the actual and budgeted rates of spending on variable overhead.
- Selling price variance: Difference between the actual and expected profit, caused by a change in the price of a product or service.
- Labour efficiency variance: Difference between the actual number of hours worked to produce a certain amount of product, and the time allowed by the business to produce that certain amount of product.
- Variable overhead variance: Difference between the actual and budgeted hours worked, which are then applied to the standard variable overhead rate per hour.
Cause of Variances
The purpose of calculating variances and presenting performance reports is a control function of the budgeting process and is performed to identify and investigate any deviations. Actual figures should be checked initially to ensure there are no accounting errors.
Variances in the following variables costs can be linked to the purchasing, production and human resource departments. A materials price variance is the responsibility of the purchasing manager.
Unit costs may vary due to:
- Suppliers updating their price lists
- Changes in the exchange rate, e.g. imported goods
- Seasonal conditions affecting supply, e.g. agricultural products
- The purchase of substitute materials
- Orders having to be filled by an alternative supplier
A materials usage variance is the responsibility of the production manager and may be the result of:
- Changes to production methods, e.g. new technology
- Inexperienced staff members, e.g. lack of training
- The quality of the materials
A direct labour variance may be linked to both the production manager and the human resource manager and may include:
- Changes in production methods
- Increase in award rates of pay
- Breakdowns and stoppages
Fixed costs are usually outside the control of the departments above and are linked to the administration department. Once the causes for the variances have been identified and analysed, the budget may need to be revised or strategies implemented to offset undesirable outcomes.
Now that we have explored what is a variance? What would this look like and how can it affect a business, what would you do when needing to talk to an organisation/ business about that?
Professional Communication Skills
Some communication techniques
- Open meetings
- emails
- one-on-one's
- visual presentations
- display confidence and seriousness
- be articulate
- create a receptive environment
- listen to your team and customer
This is where it is important that the company has clear guidelines (processes/procedures and policies) to ensure that all staff are aware of their responsibility and the right channel and communication method.
Let’s have a look at some examples from ACE Finance case studies of where policies and procedures would help staff understand how to address issues like variances.
EXAMPLE: Case Study Mel’s Makeup

Finance Authorisation Policy
Policy number: 157856
Policy date: 01/01/2021
Purpose of policy
As noted in this policy, all financial transactions must be authorised by the authorised person before the transaction is undertaken. This policy is to be read in conjunction with other specific finance policies where relevant.
Procedures
Before any of the following financial transactions are undertaken, the authorising person noted must authorise the transaction. Where an additional policy is noted, this policy must also be adhered to when undertaking the financial transaction.
| Finance transaction | Authorised person | Additional policy |
|---|---|---|
| Bank accounts | Finance manager | Banking account policy |
| Issuing petty cash | Finance manager | Issuing petty cash policy |
| Business credit card | Finance manager | Business credit card policy |
| Authorising new customers | Finance manager | Authorising new customer policy |
| Authorising new suppliers | Finance manager | Authorising new supplier policy |
| Purchasing stock | Finance manager | Purchasing stock policy |
| Purchasing assets/equipment | Finance manager | Purchasing assets/equipment policy |
| Debt collection | Finance manager | Debt management policy |
| Payment of invoices | Finance manager | Payment of invoices policy |
EXAMPLE: Isla & Co

Authorisation
The following must be authorised and signed off by Joelle:
- all purchases
- petty cash discrepancies
- month-end adjustments
- Xero data errors and discrepancies
Xero entries should be reversed and re-entered, not deleted to ensure an audit trail exists for all transactions.
All communication regarding paperwork sign-off will be placed in a manilla file titled 'Awaiting Authorisation' and placed on Joelle's office desk by 3pm. This is to ensure sign-off on the same day.
Urgent matters will be attended to immediately by phone or face-to-face contact but should still be placed in the folder for written sign-off confirmation.
Use this Budget Variance Report with an additional column for the Variances.
Analyse the report and calculate the amount for any variances. Record whether the variance is favourable (F) or unfavourable (U).
Enter the details into the PDF document.
Check your answers below.
| Budget | Actual | Variance | |
|---|---|---|---|
| Income | |||
| Sales | 140,000 | 135,000 | 5000 U |
| 140,000 | 135,000 | 5000 U | |
| Less Cost of Sales | |||
| Opening Inventory | 20,000 | 20,000 | |
| Cash Purchases | 40,000 | 40,000 | 2000 F |
| Credit Purchases | 38,000 | 36,000 | 2000 F |
| 98,000 | 96,000 | 8000 F | |
| Less Closing Inventory | 20,000 | 28,000 | |
| 78,000 | 68,000 | 10,000 F | |
| Gross Profit | 53,000 | 59,000 | 6000 F |
| Add Other Revenue | |||
| Discount Received | 300 | 300 | - |
| Commission Revenue | 1800 | 1800 | - |
| 2100 | 2100 | - | |
| 57,200 | 63,200 | 6000 F | |
| Less General & Admin Expenses | |||
| Wages | 19,700 | 19,700 | - |
| Electricity | 5000 | 6500 | 1500 U |
| Depreciation | 11,000 | 11,000 | - |
| Insurance | 1400 | 1400 | - |
| 37,100 | 38,600 | 1500 U | |
| Selling & Distribution | |||
| Advertising | 2400 | 2400 | - |
| Financial | |||
| Interest Expense | 4200 | 6000 | 1800 U |
| Bad Debts | 800 | 800 | - |
| Discount Allowed | 250 | 250 | - |
| 5250 | 7050 | 1800 U | |
| Net Operating Expenses | 44,750 | 48,050 | 3300 U |
| Profit | $12,450 | $15,150 | 2700 F |