In this topic we are going to have a detailed look at a type of system modelling called UML.
UML modelling is the standard method for modelling software systems. UML stands for Unified Modelling language and it was developed to standardise the way systems were represented visually. This helps teams involved in the development of the system communicate plans and concepts with each other and understand how the different parts of a system should work. When you work as a software engineer, you will need to be able to interpret UML models.
UML is popular and widely used because it is an open source modelling language. It was developed in the 1990s so that developers could have a standardized visual language to describe systems. Before that there was a wide variety of notations used and they weren’t universally understood. The most updated version of the language, known as UML 2.5 was published in 2015. The specifications are defined and developed by the OMG (Object Management Group) and are available from their website. It is a very detailed modelling system – the specifications document has around 800 pages.
What is UML?
The word language is important – like all languages it has a system of logic that provides a means of communication. In this case the purpose of the communication is to model out a complex system, such as the development of a software application, and express it in a way that can be understood by stakeholders.
Think about a development project you have been involved in. Now try explaining how it works. It’s usually very hard to explain a complex process unambiguously using words or pages of code. UML diagrams can present parts of the process in a way that will be understood by anyone who knows how to interpret UML models.
UML is a modelling language that:
- Provides concepts and a meaning for each of those concepts.
- Provides a notation that tells users how to represent those concepts graphically.
- Provides an organisation mode that tells users how to structure their models.
UML helps developers explain systems because it provides the (mostly visual) building blocks for the explanation.
For a very concise explanation of how software engineer use UML, watch the video, What’s UML and Why do you need it? from Learn to code with Karoly Nyisztor (1918).
How UML modelling is used
Common uses include:
- Designing software
- Communicating software or business processes
- Depicting details about a system for requirements or analysis
- Documenting an existing system, process, or organisation
There are 13 main diagram types and each diagram type provides a different view of the system, meaning it is possible to examine the system from many different angles. A single diagram type cannot model all aspects of a system. The diagram type chosen will also depend on who the diagram is for and their role in the development. UML is not a coding language so UML models can be used to explain a system to non-coders.
UML models
UML models are made up of one or more diagram types. Each diagram presents a particular view of the thing being modelled.
The diagrams are divided into two categories:
- Structural diagrams – show how one object relates to another
- Behavioural diagrams – show how the elements in a system behave.
Interactive diagrams form their own separate category within behavioural diagrams and they show communication between objects.
Look at the diagram below that shows each type of diagram that is found within each category.

We’re going to look at some of the key diagram types in more detail so that you know what they look like and how they are created. We’ll examine the standardised notation used for these diagrams and how to interpret these graphical symbols. UML is a language (a modelling language) so all the notation that you learn in the context of one diagram can be used in another.
Below is a summary of each of the UML diagram types that we will investigate in this topic. These are the diagrams types that you are likely to find the most useful.
| UML diagram types we will explore | |
|---|---|
| Class Diagrams | Show the object classes in the system and the associations between these classes. |
| Use Case Diagrams | Show the interactions between a system and its environment. |
| Sequence Diagrams | Show interactions between actors and the system and between system components. |
| Activity Diagrams | Show the activities involved in a process or in data processing. |
We’ll start by looking at class diagrams. They are one of the most fundamental types of UML diagrams.

A class diagram is a structural diagram and it is one of the most useful UML diagrams. Class diagrams describe the classes that make up the system, including their properties and methods and their relationships. A class diagram portrays the static relationships of the software.
A class represents a group of things that have a common state or behaviour.
When class diagrams are used
Class diagrams are used when the developer needs to:
- Model the collaborations that will be needed between classes to implement use cases
- Model the structure of classes and the interfaces in the systems
- Analyse the system and how it will work before building the system
The diagram can be the basis for the implementation of the system.
How to represent a class

- Class name
- attributes or properties
- methods
In a class diagram a class is represented by a rectangle. Its name goes at the top. The section below the name shows the attributes or properties of the class and the section below that shows its methods (methods are operations or functions).
Watch the video UML class diagram tutorial (Lucid Software, 2017) for an explanation of the other parts of a class diagram are and how it works. The presenter goes through a lot of information quickly so you will probably find it helpful to take notes as you watch. Pay particular attention to the names of things in the modelling system and what these names mean.
Insert activity here.
Summary of relationships that are shown in class diagrams
| relationship | meaning | notation |
|---|---|---|
| dependency | weakest relationship between classes, one class uses or has knowledge of another class, usually for a short time | a dashed arrow |
| association | a relationship with another class, usually over time, naming gives more information about the association | a solid line, or can be a line with an arrowhead that shows navigating direction |
| inheiritance (also called generalization) | one class can have the properties of another class | hollow arrowhead that points from the “child” class to the “parent” class |
| multiplicity | the number of objects that can be a part of the association | *: zero or more 1..*: one or more 1: exactly one m..n: between m and n |
| aggregation | stronger relationship than association, one class can own part of another class but also be independent of it | a hollow diamond beside the class that can be independent and a line leading to the “owning” class |
| composition | a strong relationship between classes, one class is a part of another class | a filled in diamond beside the class that is the part and a line leading to the “owning” class |
More about classes
Classes can also be defined as ‘classifiers’, they represent definitions of types of things in the system. There are concrete classes and abstract classes that are concrete subclasses and classify different types of values, interface, enumerations and generic class.
Each type of class is written differently in a diagram. A concrete class has a capital letter and is bold. Abstract classes are usually in italics with two sets of angle brackets as you can see in the following example:

Can you see how you would use a class diagram in any development projects that you’ve worked on? What aspects of the project would it help you with?
A use case diagram is a behavioural diagram that details your system's users (also known as actors) and their interactions with the system. To build a use case diagram, you use a set of standardised UML symbols and connectors. It describes the system from the point of view of users.
When is a use case diagram used?
A use case diagram is used to:
- Provide a high level view of the system which can help users understand its goals
- Document user requirements
- Explore alternative scenarios
- Provide a way to analyse classes
- Help define the user interface and give a good starting point for UI design
- Support project management because the use cases will be used to plan and estimate project length and cost
- Form a basis for testing by testing out each use case and alternative paths for use cases.
Use case modelling
Watch the video UML Use Case Diagram Tutorial (Lucid Software, 2018) for a very good overview of how to create one of these diagrams. As with all UML modelling there are specific notations to learn that are associated with this kind of diagram. To help you remember the main notations, draw each one as the presenter shows them to you and write its meaning beside it.
After watching the video there are some questions on use case diagrams designed to help you recall the key points about these diagrams.
Let’s look a bit further at how to make a use case diagram. We’ll examine a university event scheduling system.
First step: who are the actors? Students who want to access a list of events (primary actor). Academic dates which are contained in an external database (secondary actor).
Second step: what are the use case functions? For this example we’ll stay very simple. The student needs to log in to view an event schedule. The information from the event schedule comes from the external database. A further option is that the student can select specific dates to view information.
Third step: what are the relationships between the actors and the use cases? You need to represent these with arrows.
Draw the use case diagram for the system above.

Did you come up with something like this?
- The use cases should be within the system ‘rectangle’.
- There should be a clear title.
- Both actors should be outside the system and the student should be on the left.
- The relationships show a solid line for an interaction that is essential to the use case, the dashed lines show associations that are included in the use case (don’t have direct interaction with the actor but happen within the system) and dashed lines in the other direction go to a use case that is an option from the first use case.
Summary of use case diagrams
Use cases describe the functional requirements of a system from the point of view of external actors. They show the internal and external factors that influence a system. They do not go into detail about how the system will function.
What is a sequence diagram?
A sequence diagram is a behavioural diagram. It describes how objects in a system work together and the order they work together in.
It is an interactive model and it is the most commonly used interaction model.
When is a sequence diagram used?
A sequence diagram is used when it’s helpful to:
- Provide a view of the interaction between different elements of the system at different levels
- Specify detailed interactions of use cases
- Explore alternative scenarios in more detail, for example different sequence diagrams can be made for different instances of a use case
- Plan and understand the detailed functionality of a scenario.
Watch the video How to make a UML sequence diagram (Lucid Software, 2018) for an explanation of what the parts of a sequence diagram are and how to create one. The presenter goes through each part of the diagram and demonstrates the notations used. Make a note of these notations so that they become familiar to you.
After watching the video, answer questions about the parts that make up a sequence diagram to check your understanding.
A further example
Here’s an example of a sequence diagram showing the interactions that occur in a webpage user authentication system. Look at the diagram carefully then answer the questions that follow.

Insert activity here.

As the name suggests, activity diagrams depict activities. An activity diagram focuses on the flow of activities in a system. It is a high level behaviour diagram that is like a flow chart. It is used for workflow and process activities and shows the steps from end to end.
Activity diagrams are often drawn by business analysts, and developers to capture their understanding of requirements, for example complex scenarios in use case specifications.
What does an activity diagram do?
It shows the sequence of steps that make up a complex process, such as an algorithm or workflow.
- An activity diagram shows flow of control, similar to a sequence diagram, but it focuses on operations rather than on objects.
Activity diagrams are most useful during the early stages of designing algorithms and workflows.
What is an activity diagram used for?
Developers may decide to use an activity diagram to:
- Model high-level processes
- Model business workflows with swim lanes that can be people, organisations or systems
- Analyse the activities that take place within a use case
- Document an algorithm.
 |
Start symbol Represents the beginning of a process or workflow in an activity diagram. It can be used by itself or with a note symbol that explains the starting point. |
 |
Activity symbol Indicates the activities that make up a modelled process. These symbols, which include short descriptions within the shape, are the main building blocks of an activity diagram. |
 |
Connector symbol Shows the directional flow, or control flow, of the activity. An incoming arrow starts a step of an activity; once the step is completed, the flow continues with the outgoing arrow. |
 |
Decision symbol Represents a decision and always has at least two paths branching out with condition text to allow users to view options. This symbol represents the branching or merging of various flows, with the symbol acting as a frame or container. |
 |
End symbol Marks the end state of activity and represents the completion of all process flows. |
For an explanation of how these symbols are used and how to make an activity diagram, watch the following video, UML Activity Diagram, (Ave Coders, 2021 ). As you watch think about how you might use an activity diagram, even try roughly drawing up one as you follow along in the video.
An example of an activity diagram

Look at the diagram carefully and note these features:
- Taking money from the slot and debiting the account happen at the same time, as shown by the parallel thick bars. This is called a fork where the input (a balance that is larger than the amount requested) splits into two activities and a join where the two activities merge again.
- The first choice shown by the diamond is valid or invalid pin. Note the condition text that is written beside the choices to indicate the conditions that send an activity in that direction.
- “Swim lanes” show clearly who does what in this process.
Find out more
We have only looked at a small sample of UML models. There is a lot of information available about the other UML diagrams. Search UML modelling, or the name of a specific diagram, on internet and you will find a wide range of useful resources to extend your understanding.
The organisation OMG (Object Management Group) that is responsible for the specifications around UML standardisation has extensive information about UML.
There are a variety of online tools that make it easy to make these diagrams, although they can also be hand drawn, especially if diagramming a short sequence. Some drawing tools can convert some diagram types directly into code from the diagram.
How to use UML diagrams
Before making a decision about which kind of diagram to use, think about the purpose of your modelling. What do you need to model and why? There’s no point creating a diagram that doesn’t suit your purpose or analytical requirements.
Think about who will be using the diagrams that you will produce. What do they expect? What is most useful for them to see modelled? What detail do they need?
At the start of a project, you might be given a class diagram that shows the current domain that you might have to extend. The first diagram you are likely to produce is a use case diagram which shows the user experience. After that, a common practice is to develop activity diagrams based on each use case in the use case diagram. This may be followed by developing sequence diagrams to model the interaction at class level or subsystem level.
It is often an iterative process as you can see in the model below:
Iterative modelling

At every stage you create the diagrams that are needed for your specific project and that will help advance your project. The modelling must have a purpose.
Choose the information to include in your model carefully. Models and diagrams should be uncluttered. These are high level diagrams so don’t make the mistake of putting in non-essential information. Each diagram should express a small number of concepts. If it’s too cluttered, consider making another diagram with parts of the information.
The purpose of the diagrams is to convey information, if they are hard to understand they won’t achieve this purpose. Several diagrams, each with a different purpose, provide a clearer understanding than one diagram that has all the details. Effective diagramming communicates one aspect of a system well.
UML models are a tool. Like all tools, it takes practice to understand them and know how to use them well. Take the time now to do some practice using the following example or finding further examples online and working through them.
Develop
- a class diagram
- a sequence diagram
based on a given use case scenario below, using the iterative approach.
Use case scenario: Image 1
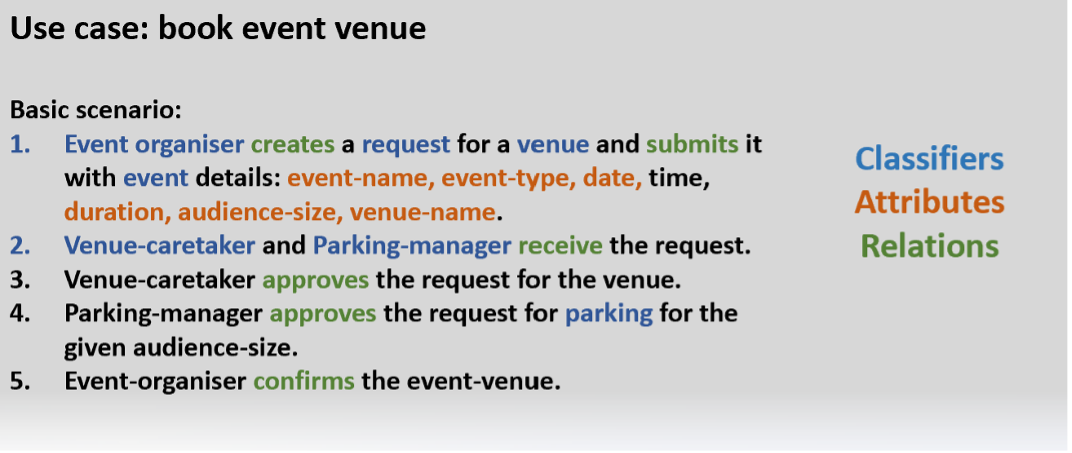
When you have finished, check your answers in the diagrams given.
Class diagram Image 2

If your diagram didn’t look anything like this, have another look through the section on class diagrams, re-watch the explanation video and then work through it again. Look carefully through this example diagram too and make sure it makes sense to you.
Sequence diagram: Image 3

If your diagram didn’t look anything like this, have another look through the section on sequence diagrams, re-watch the explanation video and then work through it again. Look closely at this example diagram to and check that it makes sense to you.