As you have leant so far, big data in its raw and unprocessed form can be obtained from various sources, formats and ever-increasing volumes. It is often impractical to test an entire volume of a raw big dataset as it can be:
- time-consuming
- resource-intensive (e.g. storage space and processing power)
- costly.
Raw big dataset – Big data that is in its natural form and is unprocessed. This includes large amounts of data acquired from a variety of big data sources (e.g. internal, external, batch, real-time, interactive etc.) and formats (e.g. structured, unstructured, semi-structured).
Therefore, a more practical approach is to select a smaller and manageable sample of the raw big dataset for testing and further processing.
Testing a smaller sample of the big dataset enables us to:
- visualise the data easily
- control the quality of data
- understand the data and its context
- examine variations or missing values
- discover any errors in misclassifications.
This brings us to the topic of data sampling.
What is ‘data sampling’?
Data sampling is a statistical analysis technique used to select, manipulate and analyse a representative subset of data points to identify patterns and trends in the larger data set being examined. 23
Data sampling helps to:22
- select a representative sample from the raw big dataset
- reduce the amount of data to a manageable size for testing
- reduce the processing time for data validation
- build and run analytical models more quickly while still producing accurate findings
- help improve the overall big data analysis process.
The basic idea of data sampling is represented as follows.
The data sampling process for big data testing should be focused on reducing the sample selection bias or sampling errors.
Sample selection bias is a type of bias caused by choosing non-random data for statistical analysis. The bias exists due to a flaw in the sample selection process, where a subset of the data is systematically excluded due to a particular attribute. 26
Sampling error is a statistical error that occurs when an analyst does not select a sample that represents the entire population of data. 27
Sampling methods
There are many sampling methods – however, all can be classified into one of two categories:
| Types of sampling methods | ||
|---|---|---|
| Probability sampling | Here, every member of the population has an equal chance of being selected to provide data, and a random sample does so. | |
| Non-probability sampling | Here, certain members of the population have a greater chance of being selected to provide data, so the sample is not random. | |
Since statistical reasoning relies on probably, we will focus our attention only on probability sampling methods for big data testing in this module.
From the various probability sampling methods, we will focus mainly on the following two techniques for the purpose of this module.
- Simple random sampling
- Stratified sampling.
Simple random sampling
This is the most basic sampling technique and often forms the basis for the other random sampling techniques. 28
A simple random sample is a subset of a statistical population in which each member of the subset has an equal probability of being chosen. 29
Watch the following video and browse more information from Investopedia 29 to learn more about simple random sampling.
Stratified random sampling
Stratified random sampling is a method of sampling that involves the division of a population into smaller sub-groups known as strata. 30
The ‘strata’ are formed based on specific categories and segments of the big dataset that needs to be included in the representative sample.
Watch the following video and browse more information from Investopedia to learn more about stratified random sampling. 30
Establishing a sampling strategy
When establishing a sampling strategy, consider the following steps:
Step 1: Define the frame
The ‘frame’ is a complete or partial listing of the items that make up the population from which the sample will be selected. 28
Depending on the business requirements for data analysis, select all required types of data from the required categories or segments (e.g. sales data for each distinct month in a calendar year). Start by defining criteria such as:
- The frame size – this is also referred to as the population size (e.g. number of records/rows in the raw dataset). Use N to represent the frame size.
- Units – this refers to stratum (groupings, categories or segments) that must be included in the sample for an accurate representation of the population (e.g. calendar years, months, quarters, product types, customer segments, etc.)
Step 2: Determine the sample size
When determining the sample size, you may need to consider criteria such as the following:
- Confidence interval– which measures the degree of uncertainty or certainty in a sampling method. The most common confidence levels are 95% or 99%.31
- Proportion – this is an estimated percentage of the total population. Usually, this is a value between 0 – 1.
- Confidence interval – this represents the desired level of accuracy of your estimate. Usually, this is a value between 0 – 0.5
- Sample size – this is the number of records/rows in the representative sample derived from the raw dataset. Use n to represent the sample size.
For more information on how to calculate the sample size, refer to the Sample Size Calculator on the Australian Bureau of Statistics official website.
Step 3: Select the appropriate probability sampling method
The selection of the sampling method will depend on the business requirement.
For more information on sample design, refer to the Sample Design from the Australian Bureau of Statistics official website.
In this section, first we will look at how to establish a sampling strategy for big data testing and then learn how to identify a representative sample of big data testing.
What is a ‘representative sample’?
When testing big datasets, it is necessary to select a sample that accurately represents the whole dataset to ensure that the results of your data testing will be maximally accurate and relevant.
A representative sample is a subset of a population that seeks to accurately reflect the characteristics of the larger dataset. 24
Important facts:
- If a sample is not representative, it is likely to be a random sample. However, with a random sampling approach, there is a higher risk of sampling error which can lead to incorrect results
- If a sample is representative, it is likely to be a stratified random sample, which examines the characteristics of a population group and breaks down the population into what is known as strata. Although this approach requires more upfront information about the dataset, the generated results are typical of a higher quality.
Watch the following video to learn more about representative samples.
Insights from the real-world
To identify a representative sample of the data, it is vital to first explore the dataset by first going through a process called ‘data discovery’.
As data is often intertwined with statistics. Therefore it is useful to obtain a statistical summary of the data that provides a quick and simple description of the data. Exploring the statistical summary gives a user a high-level view of the available data, where they can see clusters, patterns on behavioural data averages and more. 25
Identifying a representative sample
To identify a representative sample, you must select the most appropriate sampling method that will best accommodate the business requirements for data analysis.
| Sampling method | Considerations | Process for identifying a representative sample |
|---|---|---|
| Simple random sampling |
Consider some of the disadvantages of simple random sampling 28.
|
Note: In this method, a random number table is used for selecting a sample where code numbers are assigned to the individual items of the frame. A table of random numbers consists of a series of digits listed in a randomly generated sequence. This can be done using tools such as random number generators/calculators and even using specific functions in Excel and Power BI. |
| Stratified random sampling |
Consider some of the advantages of stratified random sampling 28.
|
For more information on stratified random sampling, refer to the Australian Bureau of Statistics Sample Size Calculator example using stratified random sampling. |
Example: Simple random sampling
Scenario: A business needs to select 10 out of 100 product names from a list. The business needs to be unbiased in its selection. Assume that the business had numbered all products from 1 to 1000 using a table of random numbers.
Use the Random Number Generator
What are the numbers that correspond to the items that you would include in the sample?
Approach:
Step 1: Determine the frame
- The frame (N) is 100
Step 2: Determine the sample size
- Sample size (n) is 10
Step 3: Select the appropriate probability sampling method.
The easiest method here is to select the simple random sampling method
- The chance that any particular product name be selected from the list during the first selection is = 1/100
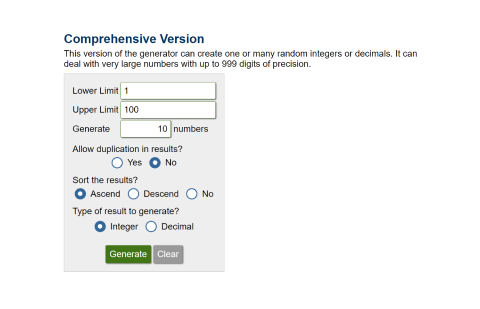
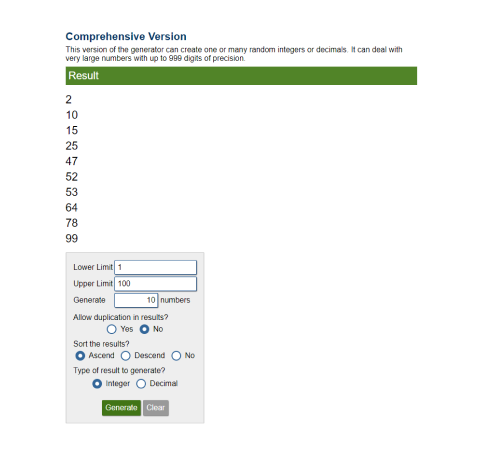
Here is a screenshot of the settings that you could use in the random number generator to get your sample item numbers.

Click on 'Generate'. This will give you 10 random numbers from which you would then select the corresponding product name from.

Example: Stratified random sampling
Scenario: A business needs to select 10 out of 100 client names from a list. The list of clients includes 60% local clients and 40% international clients. The sample needs to be representative of both client segments (i.e. local and international) proportionately.
Assume that each client name from each segment (local and international) is listed separately in two tables using a table of random numbers for each table.
What is the strategy to select a representative sample of client names?
Approach:
Step 1: Determine the frame: 100 client names
- The frame (N) is 100
Note: In this case, there are two stratums/categories of clients (i.e. Local and international). Therefore,
N = 100 (total clients) = 60 (local clients) + 40 (international clients)
Step 2: Determine the sample size: This is given in the business requirement as 10
- Sample size (n) is 10
However, as the sample size needs to be proportionate, we need to decide how many items can be selected from each stratum.
The number of clients that should be selected from the local segment is (60/100) * 10 = 6
The number of clients that should be selected from the international segment is (40/100) * 10 = 4
Step 3: Select the appropriate probability sampling method:
The best method here is to select the stratified sampling method as the sample needs to be representative of the type of clients proportionately.
Now we need to select a simple random sample within each of the strata and combine the results from the separate simple random samples.
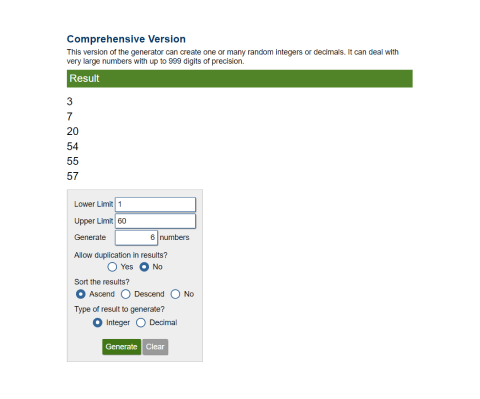
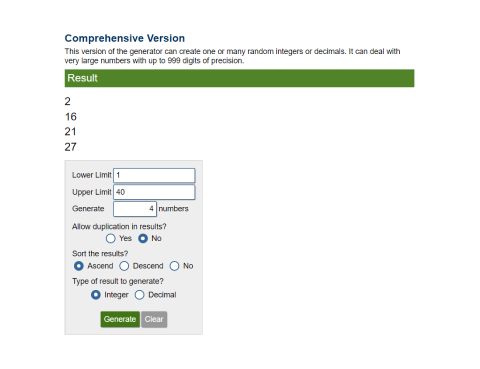
- In this case, you need to use the random number generator once for each stratum to get your sample item numbers.
Here is a screenshot of the settings that you could use in the random number generator to get your sample item numbers.
Sample from Local customer segment

Sample from the International customer segment

Complete the following questions.
Consider requirements, policies and procedures
When assembling or obtaining a sample of raw big data, it is important to ensure that it is done so according to the following.
- Legislative requirements – These are outlined in the data protection and privacy policies applicable to the business. For example, it may be required that all records with customer information be de-identified or omitted from the sample dataset.
- Organisational policies and procedures – These would outline the details of the process that should be followed when assembling and obtaining data from specific big data sources.
Preparing for demonstrations
You will be using the Power BI Desktop to carry out the demonstration tasks in this module. Therefore, do the following to prepare your computer with the required software before proceeding any further in the module content.
Install Power BI Desktop
Install Power BI Desktop software.
Watch the following demonstration video that will take you through the installation steps in detail.
Additional resource: Introduction to Power BI
Install DAX Studio
Install DAX Studio software.
Watch the following demonstration video that will show you how to install DAX Studio and how to launch DAX Studio directly from Power BI Desktop.
Download datasets
Download the following datasets:
AUS-towns (.csv file) – a non-transactional dataset 32
Sales 2020-2021 (.xlsx file) – a transactional dataset 33
You will be using these datasets to perform a variety of activities in this module.
Note: If you have a Mac computer, please follow the guidelines towards the end of Topic 9.1.4 Using Power BI Desktop and DAX Studio on a macOS computer to set up a virtual Windows environment on your Mac computer where you can then install the required software applications.
Assemble raw big data into Power BI
Go through the following learning module from Microsoft’s official website, where you will learn the step-by-step process of how to retrieve data from a wide variety of data sources into Power BI.
Watch the following video to learn how to get started with using the Power BI Desktop.
Watch the following video demonstration that will take you through the process of assembling two different raw big datasets into Power BI Desktop.
Obtain a representative sample dataset
The loaded source data table would typically contain a large amount of data that is hard to test and further process. Therefore, we need to create a sample dataset by selecting a smaller subset of data from the source data table.
It is important to ensure that the sample dataset you obtain is representative of the source dataset.
We will be using the DAX function called ‘SAMPLE’ to do this task in Power BI Desktop. Refer to the SAMPLE function (DAX)for more information on the syntax rules of this DAX function.
An example using simple random sampling
If using a simple random sampling approach, the SAMPLE function can be used in its most basic form.
For example, let us use the 'AUS-towns' table as the source table and 'Sample of AUS-towns' as our sample table.
Sample of AUS-towns = SAMPLE(100, 'AUS-towns', 1)
Notice in the formula that the sample size is taken as 100. The Number 1 indicates the ordering of the sample in ascending order. If you use 0, it will order the sample in descending order.
An example using stratified random sampling
If using a stratified random sampling approach, see the following examples of how the SAMPLE function can be used.
The example below is used to obtain a sample from the Customers table from each distinct segment:
Sample table = SAMPLE(100, 'Raw Data Table Name', [Segment 1], 1)
If more than one categorisation is required, this can be specified as follows:
Sample table = SAMPLE(100,
  'Raw Data Table Name',
  [Segment 1], 1,
  [Segment 2], 0,
)
The example shown below obtains a sample size of 100 customer records representative of each segment and location.
Sample table = SAMPLE(100,
  'Raw Data Table Name',
  [Segment], ASC,
  [Location], ASC,
)
Example: Consider that the requirement is to get a sample from the 'Aus-towns' source dataset, to include all stratum in both state_code and type columns. That means the sample should represent,
- 8 distinct state codes in the
state_codecolumn - 4 distinct types in the
typecolumn.
Let us try using the same simple random sample method to see if we can achieve this.
Another thing to note is that if your sample size is too small, it will be hard to capture data from all required stratum. Therefore, at a minimum, to calculate the sample size that could accommodate at least 10 values from each stratum, you can do the following calculation to get an estimation.
Sample size estimate = (8 + 4) * 10 = 120
In this case, any multiplication of 12 would work as a suitable sample size that would capture the required stratum.
The SAMPLE function can be used as follows.
Sample of Aus-towns = SAMPLE(120,
  'Aus-towns',
  [state_code], 1,
  [type], 1,
)
Watch the following video that demonstrates the process of obtaining a sample dataset from the source dataset.
Once sample data from the raw big data source is obtained, it is important to validate if the sample data is accurate. This involves checking that the data you have obtained from the raw big data source has been loaded into Power BI Desktop correctly. At a minimum, we need to:
- compare the sample dataset with the source data to ensure they match
- check that the right data is extracted and loaded into the right testing system.
A more practical and efficient approach for carrying out validation checks at this point is to use test scripts.
We will use DAX Studio to run a validation script that generates a comparison report. This will then indicate if there are any deviations between
- the record counts of the raw dataset and the sample dataset
- the representation of the required stratums (e.g. categorisations or segments).
According to the validation results displayed after running the test script, validate if the big data sample is correct and comment on identified inconsistencies.
At this stage, it is important to ensure that the correct number of records are loaded to the platform and that the sample dataset is representative of the raw big dataset.
Refer to the Sample DAX test script (.txt file) which shows an example of the DAX script that can be used for testing. Notice that the script includes relevant table names of the raw dataset and the sample dataset along with the required stratum names (e.g. segment names, category names etc.) and their distinct values as required.
Watch the following video that demonstrates the process of validating the sample dataset using DAX Studio and the customised test script.
Topic summary
Congratulations on completing your learning for this topic,Validate assembled or obtained big data sample.
In this topic, you have learnt how to:
- establish a sampling strategy for big data testing
- identify a representative sample for big data testing
- assemble and obtain a sample of raw big data
- validate the accuracy of big data samples.
Check your learning
The final activity for this topic is a set of practical activities that will help you prepare for your formal assessment.
Task 1: Establish a sampling strategy
You’ve been provided with the following two datasets.
- AUS-towns (.csv file) – a non-transactional dataset 32
- Sales 2020-2021 (.xlsx file) – a transactional dataset 33
- Consider that there is a requirement is to get a sample from the ‘AUS-towns’ source dataset, that is representative of all states and all regions.
- What strategy should be used to select a representative sample from this dataset?
- Calculate an estimated sample size.
- Consider that there is a requirement is to get a sample from the ‘Sales 2020-2021’ source dataset, that is representative of sales orders from each month (January to December) for both calendar years (2020 and 2021).
- What strategy should be used to select a representative sample from this dataset?
- Calculate an estimated sample size.
Task 2: Assemble data into Power BI.
- Save your Power BI Desktop file as “Demo1-Assemble big data”
- Assemble the raw big data source files provided into the Power BI data model according to the correct procedure and legislative requirements.
Datasets to be loaded:
- AUS-towns (.csv file) – a non-transactional dataset 32
- Sales 2020-2021 (.xlsx file) – a transactional dataset 33
Legislative requirement
- According to your organisation’s privacy policy all records related to customers should be de-identified.
- Except for the ‘Customer ID’ and ‘Segment’, all other identifiable customer data (such as name, phone, email, address etc.) should not be loaded onto the analytic platform for testing.
Procedure for assembling data
The procedure for assembling data is summarised in the following flow-chart.
Task 3: Obtain a representative sample dataset
According to the sampling strategy and the sample size estimation you’ve made in Task 1, use Power BI and the correct DAX function to obtain a representative sample from:
- AUS-towns – (Hint: Create a new calculated table called “Sample of AUS-towns”)
- Sales 2020-2021 – (Hint: Create a new calculated table called “Sample of Sales”)
Task 4: Validate the sample dataset
Validate the sample datasets against the source datasets Use customised test scripts in DAX Studio to validate the sample datasets you’ve created in Task 3, against the source datasets:
- AUS-towns
- Sales 2020-2021.
What’s next?
Next, we will dive into the more practical tasks related to validating the big data sample process and business logic.

