What is Figma?
Rather than re-hash, I am adding the best links I found.
- So far, I see that Digital are using it for creating the drawings/images we set tickets for.
- It can also be used to create animations and even produce apps
- Figma can integrate with external tools for particular functions (for example secure database)
Setting up
There are lots of "getting started with Figma" videos, but thought this one was one of the better ones.
- create an account with your work email
- create your own design following this next video
- Don't worry too much about settings and sizes for now
- get familiar with the tools/menus
Get started in just 24 minutes
Extra things
- There are great tips and tricks videos
- plugins seem to be a large part of using Figma
creating an app from Figma can be done as shown here, while not totally applicable for us, it shows some of the power of Figma.
with "actions" hover doesn't work on mobiles.
Examples
Rational
The use of GIFs must be to serve an educational purpose. The use of this form of animation must be appropriate for the learning.
To summarise, GIFs are short animated images. They comprise a set of individual images, merged, so they show as a moving image. They are a bit like those cartoons done on the corner of books, with each image changed a bit from the last to show movement.

The combination of the images forms one GIF file. If done properly, the GIF file should be relatively small in size (memory size) and can be used as any other image, such as in emails, LMS, Teams etc.
GIF files do not have sound, and ALT text should be considered additionally for visually impaired - I have not tested this yet.
Educational purposes
If you think the teaching of an idea or concept can be enhanced with an animated GIF, here are some ideas.
Making a GIF
First up, what are you trying to show? Maybe sketch it out or somehow articulate what you plan to do. This may help with the choice of tools or method to greate the GIF.
Below are a few examples and why I chose the particular animation.
1. In this case, I wanted students to learn the different names for parts of a curve. The dots showed where the curve changes and the naming convention appeared for each dot. I think of it as if I was trying to explain something on a whiteboard, the steps would I go through. I would draw the curve first, then the points and then label them.

2. In this example, the animation builds up a sequence as a flowchart. The detail is presented as each stage is presented. Then to avoid overload, some detail is removed. This GIF loops through twice, then stops on the last frame to show all content to allow students to take notes and stop continuous movement on the page.

3. Students who understand indices (e.g. squares and cubes) can see how logarithms relate to indices.

4. This animation follows the steps I would show on a whiteboard to work out the two key exact triangles for trigonometry. The steps to build the triangles are shown.

5. This animation shows the reflection of a function and subsequently its inverse.
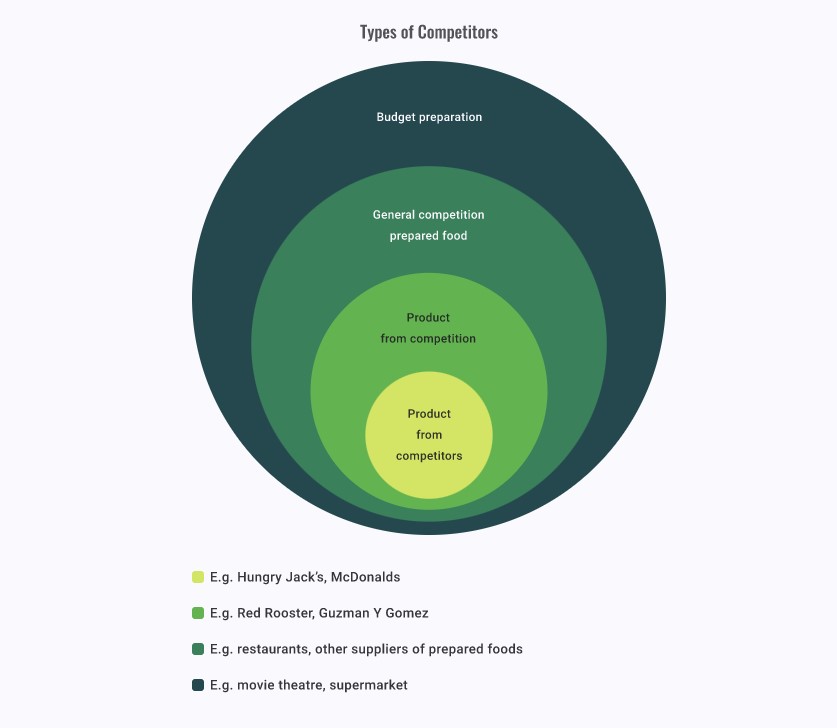
6. My version comparing competition
How to create the GIF
This is the easiest method I have found so far with the tools we have.
Think carefully about what you want to show, how and when.
I use PowerPoint as the editor. It is very flexible in what it can do with images and text.
There are 2 ways to produce the animation.
1. If there is movement, such as the maths one above, use the animation settings within PPT. This one uses the "path" animation. You can use the timing function and set times that the animations occur. Alternatively, do everything on click, and record the presentation. Use "save as" GIF.
2. If there is no movement of items, such as the purchasing one above, I made the final slide, with everything on it, and copied this to multiple slides. I then deleted everything I didn't want on each slide. Make it so it shows as you want it in "presentation" mode. This is closer to the "flip book" discussed earlier. Now, "save as" .jpg, all slides and you get a folder full of JPGs for each slide.
From ezgif.com, go to GIF maker and upload the slides.
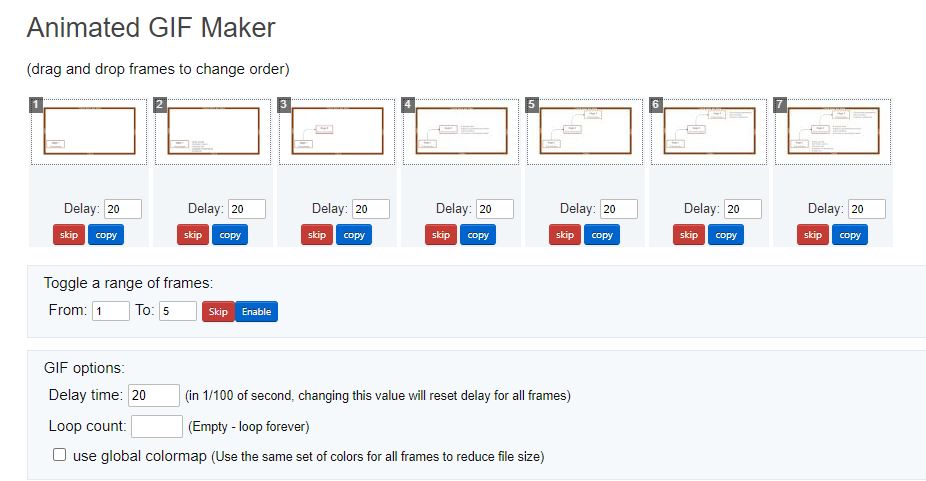
from here, you can change how long each slide is shown (in hundredths of seconds).
You can also set how many times you want to loop.
EZGIF maker
The site ezgif has a whole set of GIF editing functions.
"video to GIF" can be used to convert short videos to a GIF. For example, from a PPT animation after saving as an MP4.
Adding text to an existing GIF. (Like a BUS100)
Resizing (cropping) rather than using the full size of a PPT slide.
Optimising to reduce file size.
Change the looping count before stopping.
Change speed of GIF and direction (can also go back and forth from start to end to avoid an abrupt change).
H5P
From Construction CIV:
The map below provides the legislation and relevant regulatory body on the Security of Payment across Australia.
Finally, this is H5P Course Presentation. Other H5P types can be added into Course Presentation. The scaling has not transferred into our system very neatly in the case below. The navigation options have been removed, and the "Next" buttons added instead so it will only move forward through the slides.
Knowledge check
Method 1
Sometimes you may want to know exactly what a colour of an asset or object is so you can colour match. For example, adding something to a previously exisiting GIF or asset.
As an example, starting with:
Get a screenshot or find the file that can be opened using Paint 3D.
Select the "Brushes" option and find the "dropper" tool.
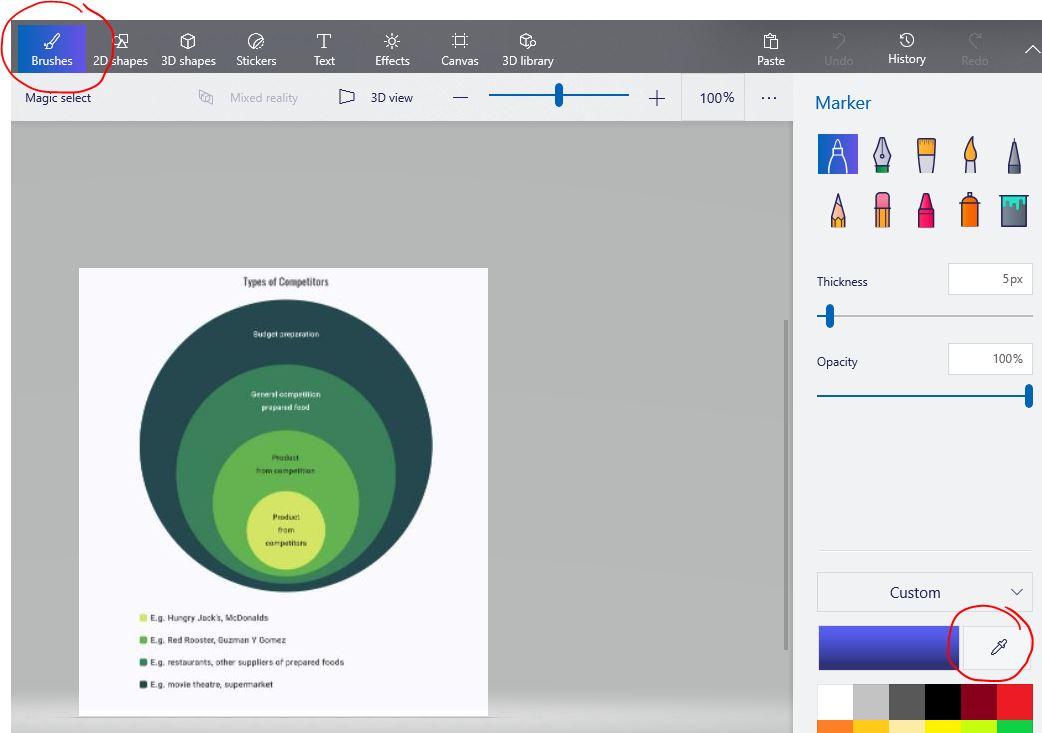
The dropper tool gives a circle, that you can move around the image. Once placed, it shows the colour (in the box next to the dropper). By clicking on the box, the hex code for the colour, and the RGB levels are shown.
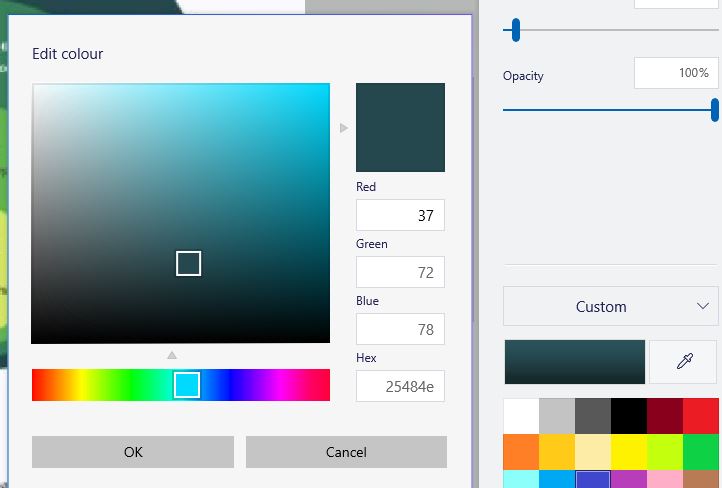
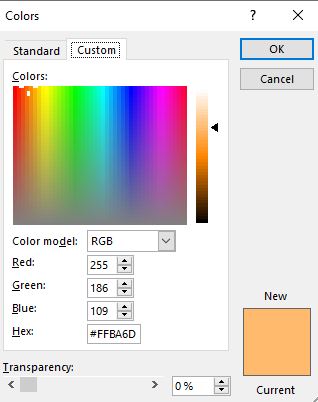
These colour levels can then be used within your design program such as PowerPoint to set object colour.
Method 2
Add the ColorZilla extension to your browser.
When this is run, a pop-up shows the colour of where your mouse pointer is.
*** I saw the default setting is to have access to all site you go to. I think it is prudent to set it to "access when activated".
Just testing something here
original
and from Dig

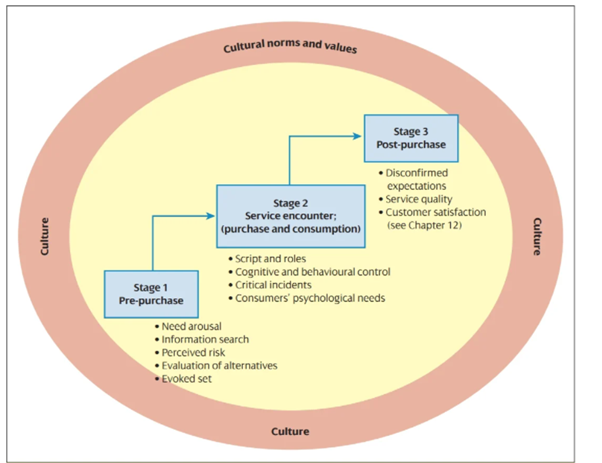
Stage 1: Pre-purchase
- Need arousal
- Information search
- Perceived risk
- Evaluation of alternatives
- Evoked set.
Stage 2: service encounter (purchase and consumption)
- Script and roles
- Cognitive and behavioural control
- Critical incidents
- Consumers' psychological needs.
Stage 3: post-purchase
- Disconfirmed expectations
- Service quality
- Customer satisfaction.
first attempt using ppt to make the gif
Customer decision-making process for services

then using editor to repeat twice only and cropped and optimised. Ending by showing all.

With border
This is an example of h1
This is an example of h2
This is an example of h3
This is an example of h4
This is an example of h5
This is an example of h6
T1
- the table column headings (e.g.
Customer ID,Customer Name,Phone,Email) indicate what type of information about customers is stored in the table - the table rows contain records of specific customer details
- the table contains a key column (e.g.
Customer ID) to uniquely identify each record in the table.
| Customer ID | Customer Name | Phone | |
|---|---|---|---|
| 2658 | Fiona Black | 0426 142 866 | fiona.black@mail.com |
| 1952 | Benjamin Low | 0496 100 200 | benlow@mail.com |
| 2587 | Grace Murray | 0423 654 258 | gmurray@mail.com |
| 9542 | John Kelly | 0438 962 800 | kellyjohn@mail.com |
Isolate sub-standard data
When it is found that sub-standard data exists in the sample dataset, it is important to isolate or separate that data from the rest of the data in the sample dataset.
This can be done by creating calculated tables using DAX functions; FILTER and EXCEPT. The process is as follows:
- Use the
FILTER()function to create a new table ('Table 2') with the data that needs to be isolated/separated from the original sample data table ('Table 1'). - Use the
EXCEPT()function to create a new table ('Table 3') that includes all the data from the sample dataset except the isolated data from'Table 1'.
New sample data table (Table 3) = Original sample data table (Table 1) – Sub-standard data (Table 2)
DEFINE
  MEASURE Customer[EmptyID] =
    CALCULATE(COUNTROWS(Customer), Customer[Customer ID] == BLANK()
  )
EVALUATE
  SUMMARIZECOLUMNS(
    Customer[Customer ID],
    Customer,
    COUNTROWS(Customer),
    'Order Detail with blank Customer ID',
    [EmptyID]
  )