In this topic, we will cover:
- User testing
- Acceptance testing
- Performance
- Compatibility.
User experience (UX)
User experience is not only about the user. The UX value loop, created by Joe Natoli, defines the space between the user and stakeholder needs as where UX value is created or added.

User needs:
- Make life/tasks easier/simpler
- Feel confident, competent and in control
UX:
- Sweet spot where UX improvements give value to both camps
Business goals:
- Make or save money
- Keep existing customers and gain new ones
If UX is about both the user and stakeholder; requirements and specifications also need to consider both user and stakeholder needs.
Throughout the design and development process, you will have collated and analysed data, including user and stakeholder needs, to create requirements. These needs, or requirements, can be split into 3 categories:
- Things people say they need.
- Things that people actually need.
- Things that people do not know they need.
Take what people say they will need or will do with a grain of salt.
Humans often make confident predictions about how they would behave in a future scenario. But these predictions are often false. How you think you will use something is based on past experiences or speculating on future use. There is often a disconnect between this speculation and reality. The only way to truly know if something is useful, valuable, relevant, or positive is by using it.
Have you heard of the term solution jumping? It is when someone jumps to suggesting solutions to a problem, rather than just describing the problem. When people jump to solution mode, they often fail to understand the problem and miss getting to the root of it. When analysing what people actually need, avoid solution jumping and instead focus on answering these questions:
- Look beyond the tool. Do you understand what users expect to be able to do, how they need to do it, and why it matters to them?
- Is there evidence that this is a recurring problem and affecting use or adoption?
- What research can provide you with insights? Do you need to know more about users, their expectations, and motivations?
By understanding the problem, and not solution jumping, you can also uncover things that people do not know they need. Rather than focusing on features and functions, designing for UX should focus on:
- Understanding the problem that users and stakeholders are facing
- What their desired outcome is – what they want to achieve (this is different to the desired solution)
- How they will solve the problem — with or without your specific product!75
User stories
Stories help product owners communicate to the dev team what needs to be built. Stories provide a framework that can be used for user testing (aka usability testing) and user acceptance testing (UAT).
Story
Title:
As a _________________ I want to _____________________ so that ______________________
Stories capture a complete slice of functionality. They are independent of other stories. It is not necessary to understand or complete one story before working on another.
Stories reveal the essence of a feature and provide a starting point to discuss parameters and meaningful acceptance criteria. Each story should make it clear what needs to be achieved for the product to pass UAT.
However, stories are not technical specifications. As we discussed earlier, you want to avoid solution jumping. A story should not dictate the solution, instead, it should capture a user’s goal and motivation. A short story helps to minimise the risk of writing detailed specifications at this early stage. Well-written stories provide a framework for discussion and problem-solving.
Keep your stories short and straightforward. You should be able to write a story on one side of an index card with the acceptance criteria written on the back. Long stories lead to specifications that are too detailed or stories that are overly complex.76
In the past, you may have created user stories centred around the end-user. The person using the front-end of the website to purchase a product, book an appointment, share media and so on. When you are creating a content management system, you also need to focus on the needs of the website administrator.
What are the main tasks the administrator will use the CMS for? Developing user stories can help us confirm and develop our use cases.
Use cases
Are user stories the same as use cases? By themselves, user stories are not detailed enough for a dev team to work with. While user stories provide a desired outcome, goal, or benefit; use cases are granular. They explain how the system will act.
User story: As a Flickr member, I want to set different privacy levels on my photos, so I can control who sees which of my photos. User stories are written in a language users could understand. They are not technical specifications.
User stories help us at the start of a project. They help the team understand what the team is making and why it is important. It centres the design on the user and avoids solution jumping. They provide a talking point for the team to work through which in the end, you will cover everything you would in a use case, but organically, not in a prescribed way.
Conversely, a use case does have technical language and is specific.77 ‘A use case is a written description of how users will perform tasks on your website. It outlines, from a user’s point of view, a system’s behaviour as it responds to a request. Each use case is represented as a sequence of simple steps, beginning with a user's goal and ending when that goal is fulfilled.’78
A use case describes interactions between a system and an actor or actors. Use cases are often documents and include details such as:
- use case title (short phrase, often starting with a verb such as Place Order Online)79
- rationale/description/goal
- actor/user
- preconditions (what must have already happened in the system)
- standard path or main success scenario (what will usually happen, a series of steps)
- alternate paths or extensions (variations on the above/edge cases)
- postconditions (what the system will have done by the end of the steps).77
Use cases do not include implementation-specific language or details about the UI screens.78
User stories are useful for determining the scope of work. They can then be mapped to use cases that can represent individual units of work that need to be implemented.

So, each user story will lead to a unit of work:

Use cases explain how a system should behave, which helps when brainstorming what may go wrong. They are useful for establishing the complexity (and therefore cost) of a process, which may help when prioritising requirements.
Use cases must result in something observable that is of value to the user.
Use cases should describe all the possible ways that the system can achieve, or fail to achieve, the goal.
Use cases can be used to:
- Determine system requirements
- Describe what the system should do
- Provide a basis for testing to ensure that the system works as intended.77
How to write a use case
‘Write the steps in a use case in an easy-to-understand narrative. Kenworthy (1997) outlines the following steps:
- Identify who is going to be using the website.
- Pick one of those users.
- Define what that user wants to do on the site. Each thing the user does on the site becomes a use case.
- For each use case, decide on the normal course of events when that user is using the site.
- Describe the basic course in the description for the use case. Describe it in terms of what the user does and what the system does in response that the user should be aware of.
- When the basic course is described, consider alternate courses of events and add those to "extend" the use case.
- Look for commonalities among the use cases. Extract these and note them as common course use cases.
- Repeat steps 2 through 7 for all other users.’78
Use case diagrams
In Unified Modelling Language (UML), use case diagrams are used to model the behaviour of a system and capture requirements. They consider high-level functionality and scope, illustrating the relationship and interactions between the system and actor(s).
Use-case diagrams have the following elements:
- Use cases describe the functions that the system performs to achieve the user’s goal. There must be an observable value to the user.
- Actors represent the roles of users that interact with the system The actor could be a human user, but it could also be a business, machine, or a different system.
- Subsystems, are stereotyped components that represent independent, behavioural units in a system.
- Relationships show connections between elements.80
Usability/user testing
Imagine you want to take a friend out for dinner. You trawl restaurant websites, reading through their menus, checking tagged posts on Instagram, and reading reviews wherever you can find them. You find a place that looks amazing. Reviews claim it is the city’s best steakhouse.
You send it through to your friend, “Check out the menu. Looks good right?”.
You see the “...”
You wait with bated breath. You are so excited about dinner and pleased with your research.
And then the reply comes... “I’m vegetarian.”
If only you had done some usability testing early in the process.
Usability testing (used interchangeably with the term user testing) focuses on the end-user and usability of the site. It is a popular user experience (UX) research method which allows you to uncover problems and opportunities. Usability testing also provides you with the chance to learn about your user’s behaviours and preferences.
User testing (or usability testing) has 3 components: the facilitator, the tasks, and the participant.

During initial design and development, a facilitator will share mockups or prototypes with test users. The facilitator or analysts will spend time observing the test user complete tasks. An experienced facilitator will know when to observe, interview, give instructions, answer questions, and ask follow-up questions.

Tasks are realistic activities that a user would perform on your site. User stories and use cases can help set these tasks, and they may be open-ended or highly specific.
Participants should be realistic users so find test users that match your primary persona. And encourage them to think aloud. This allows the facilitator to ask follow-up questions or observe useful information to understand the user’s behaviours and decisions better.81
Try your best not to test with people who are working on the project: they will likely fail to notice the problems that might hold up other users, may not be part of the target audience at all, and are likely to have conflicting goals with other users. How the intended audience really interact with a product is often different from the assumptions of a team who may know the web much better and are much more familiar with the product itself.82
Usability testing helps uncover problems including:
- Confusing wording, images, and graphics
- Frustrating processes that lead to site/task abandonment
- A disconnect between what the site delivers and the users' expectations.
A combination of observation and questioning in user testing helps us learn how users:
- Interact with the site
- Achieve goals/tasks
- Expect the site to work
- Search
- Interpret signifiers and menu items
- Feel about the aesthetic of the site
And of course, whether they like the site or get frustrated with it.
Complete usability testing throughout the early stages of design and development, or risk investing time and money creating a site that is not usable.83

User testing vs acceptance testing
User (or usability) testing happens throughout the design and development process, most notably when you are testing out mockups and prototypes before the site has been built.
During usability testing, the facilitator will spend a lot more time observing, asking questions, and just generally keeping the process more open-ended, compared to acceptance testing.
Acceptance testing (or User Acceptance Testing, UAT) is the final test. It is a final check to ensure that the site or product works as intended and meets the requirements, in the environment it will be used in.83
When completing UAT for a CMS, the client (often the future website administrator) is the person completing UAT tasks. These tasks are driven by agreed acceptance criteria.
Acceptance criteria are the accepted conditions or business rules that a product (the website) needs to meet to be accepted by stakeholders.76
User story to acceptance criteria
In the planning stage, you completed a set of user stories that determined the scope of work for the CMS. Use these statements when creating acceptance criteria to be used in testing, so you stay within scope.
You will be familiar with the most common format for writing stories:
As a [type of user], I want [some goal] so that [some reason].
There is a similar formula for writing acceptance criteria:
Given [how things begin], when [action taken] then [outcome of taking action].
A story may link to several acceptance criteria.

Take for example, a dev team working on a gallery app. Gallery visitors want to rate the art and keep track of favourites. The story is:
- As a gallery visitor, I want to rate the art so that I can track and rank the art I have rated. Acceptance criteria for this story could include:
- Given a logged-in user viewing a gallery, when the user clicks a star in a rating widget for an image, then the value of that star should be recorded as that user's rating for that image.
- Given a logged-in user viewing a gallery, when an image the user has rated is displayed, then the rating widget should reflect the user's previously entered rating.
- Given a logged-in user viewing a gallery, when the "Favourites" switch is toggled on, then only images the user has rated should be shown, in descending order of rating.76
User stories are not just one-and-done sentences. They help the product owners write acceptance criteria, defining the boundaries of a user story and measures of success.
Consider the user story: ‘As a conference attendee, I want to be able to register online, so I can register quickly and cut down on paperwork. What would the acceptance criteria include? Perhaps:
- A user cannot submit a form without completing all the mandatory fields.
- Information from the form is stored in the registration database.
- Protection against spam is working.
- Payment can be made via credit card.
- An acknowledgment email is sent to the user after submitting the form.’77
Writing the acceptance criteria is an important process of working through the details of a user story.77
Each user story will lead to one or more acceptance test(s):

Website administrator example
How would you write a user story for a website administrator and turn this into acceptance criteria?
User story:
As a website administrator, I want to be able to keep the Contact Us page up-to-date so that our customers contact the correct team/person.
Acceptance Criteria:
Scenario: [use case title]
Given [context]
When [event]
Then [outcome]
So, our acceptance criteria becomes:
Scenario: Update ‘Contact Us’ page.
Given the admin wants to be able to update the About page, when they want to do so, all important components of the page are editable, they are able to easily update each component and the process is what they would expect.
- All important components of the page are editable
- Each component is easy to update
- The process is what they would expect

Testing tools help you identify and understand problems affecting your website. Repeating tests help establish a baseline so you can assess performance improvements or deteriorations following updates.
Remember to test your website using a combination of real devices, operating systems, input types, and browsers on a range of network speeds. Analytics reports can help you determine what systems and connections your users typically use.84
Test plan
Test for defects, ease of use, accessibility, quality assurance, and performance.
- Who will run tests?
- What tools will they use?
- How will results be recorded and reported?
Performance analysis tools can help to understand reports and optimise performance.
Once you have identified that your site has a performance issue, you need to find and fix the cause. Firstly, establish if the fault is occurring server-side or client-side.
Slow network responses on initial page load or during Ajax requests, may indicate a server-side issue. Output diagnostic information to help discover the culprit.
Browser developer tools can help to diagnose client-side issues – such as long-running JavaScript functions, page re-layout due to a DOM update, or CSS changes affecting many elements. When the browser has significant work to do, performance will suffer.84
First, we will focus on front-end performance.
Browser rendering process
A user accesses your site, and the following happens:
- ‘The browser makes an HTTP request for a specific URL. Under the hood, several network processes are taking place to resolve the domain name to an IP address and route the request to a server.
- The server receives and parses the request. It will reference a specific URL and may have data appended as a query string, in the HTTP header, or message body. It returns a response which, in this case, we’ll presume is HTML content.
- The browser starts to receive HTML data, which it parses. The document may reference further assets, such as images, fonts, style sheets, and JavaScript, which trigger additional HTTP requests to the same or another server.
- Eventually, the browser has enough information to start the rendering process. Behind the scenes, it has started to build the HTML DOM (document object model) which defines the page in a hierarchical tree structure. Style calculations also determine which CSS rules apply to each DOM node, and a CSSOM (CSS object model) is created for JavaScript interaction.
- The browser initiates the layout (or reflow) phase. This calculates the dimensions of each element and how it affects the size or positioning of elements around it.
- The layout is followed by a paint phase. This draws the visual parts of each element onto separate layers—that is, text, colours, images, borders, shadows, and so on.
- Finally, a composite phase draws each layer to the screen in the correct order.’84
The page is now viewable. But JavaScript can continue to make further HTTP requests triggering further layout, paint, and composite phases. If you minimise HTTP requests and reduce browser processing, site performance will be improved making a more enjoyable user experience.
Google Lighthouse
The open-source tool Lighthouse evaluates webpage performance and quality on Google Chrome. Lighthouse is accessible via:
- Chrome DevTools
- A node.js module in the command line
- PageSpeed Insights.85
Chrome DevTools
Accessing Lighthouse via Chrome DevTools allows you to audit pages that require authentication, and the reports are easy to read.
In Google Chrome, go to the URL you wish to audit. Open Chrome DevTools and click the Lighthouse tab.
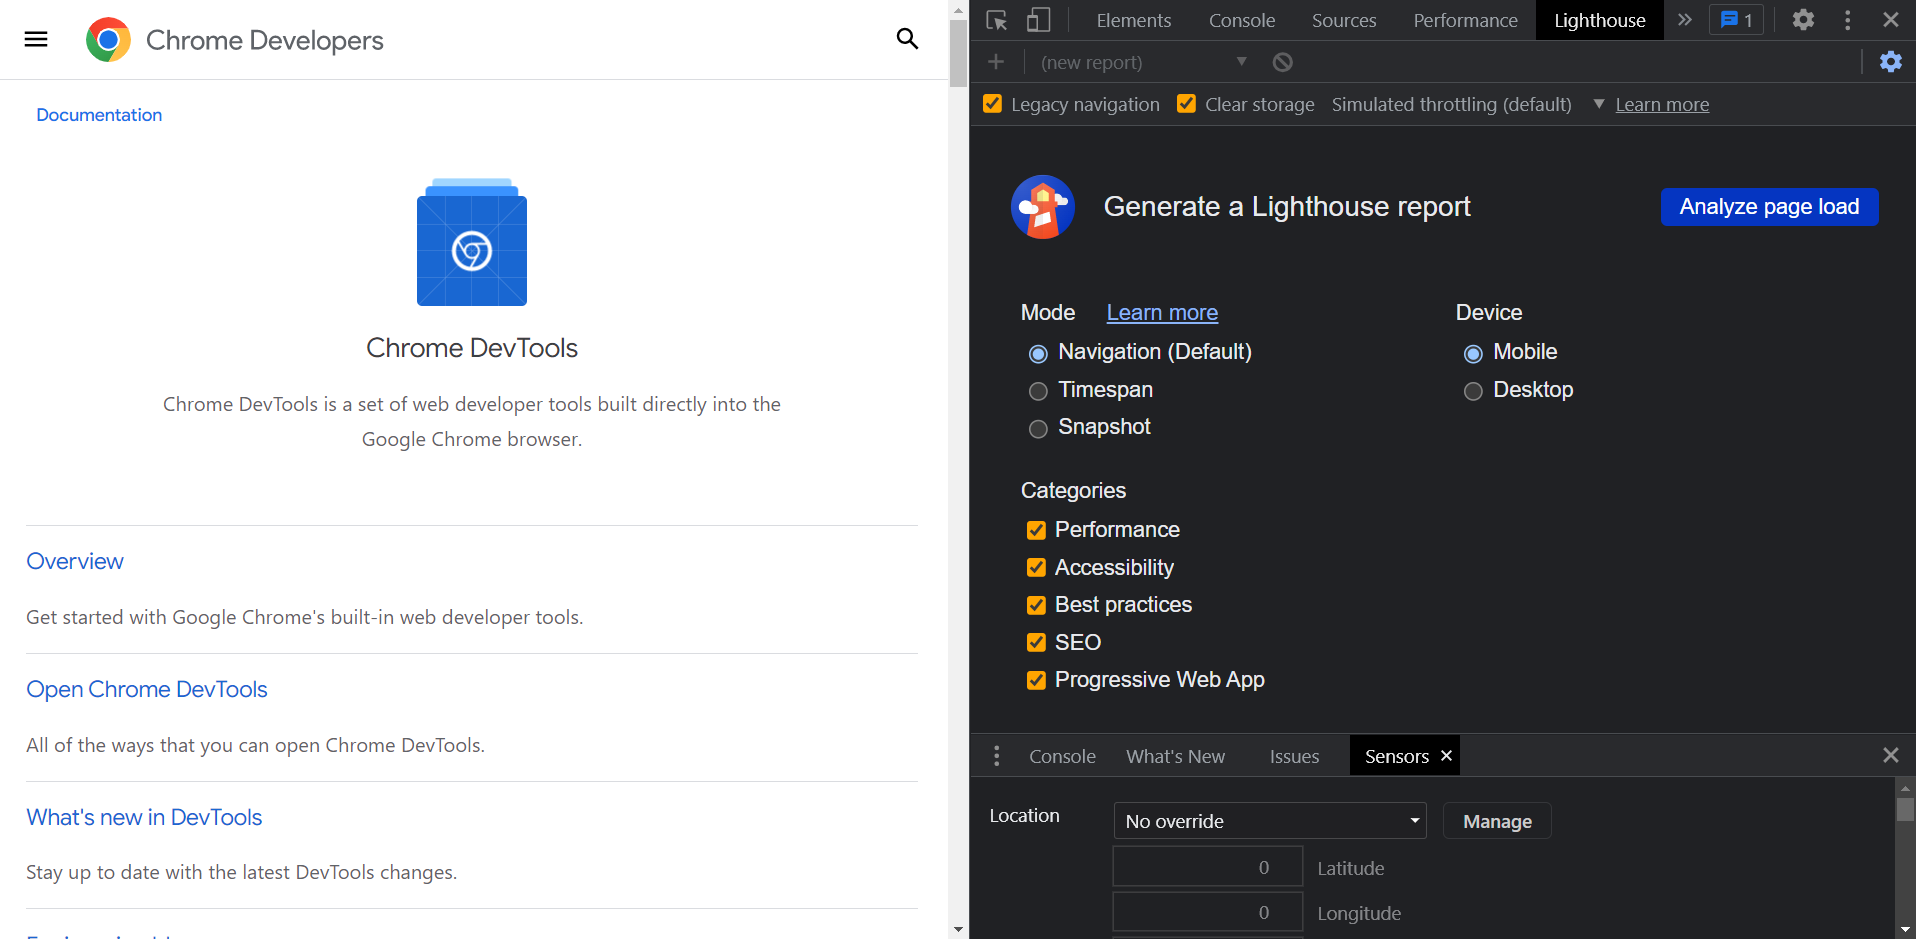
By default, legacy navigation, clear storage, and simulated throttling will be selected. To amend lightbox settings, click the cog.
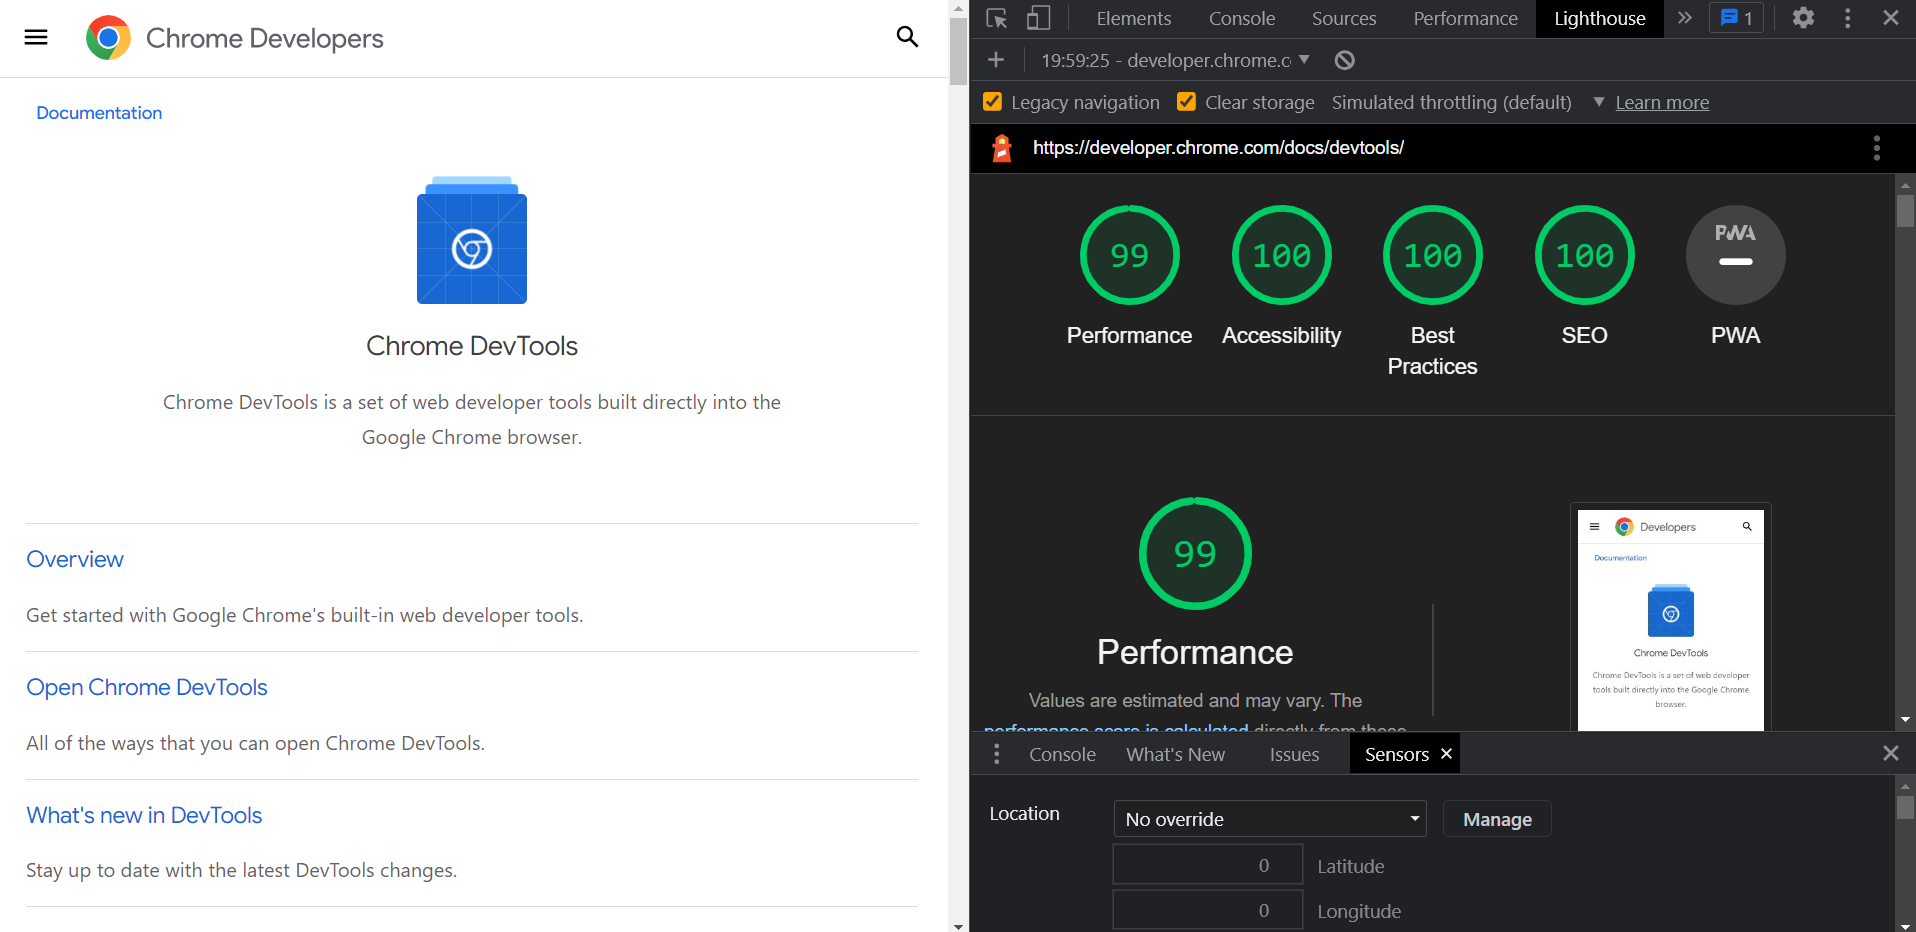
Select the categories and devices you want to analyse and click Analyze page load. After 30 to 60 seconds, a report is displayed. This report can be printed or saved as a JSON using the tools menu (vertical hamburger icon).
Node command line tool
To access Lighthouse using the command line, you will first need to install the current Long-Term Support version of Node. Then, install Lighthouse:
npm install -g lighthouse
-g flag installs Lighthouse as a global module.
To run an audit, run:
lighthouse <url>
And to see all options, run:
lighthouse --help
A report will be generated in command line.
PageSpeed Insights
PageSpeed Insights is a web UI that allows you to run Lighthouse without installing anything. Go to PageSpeed Insights and enter the URL you want to analyse. Click Analyze to generate a Lighthouse report.
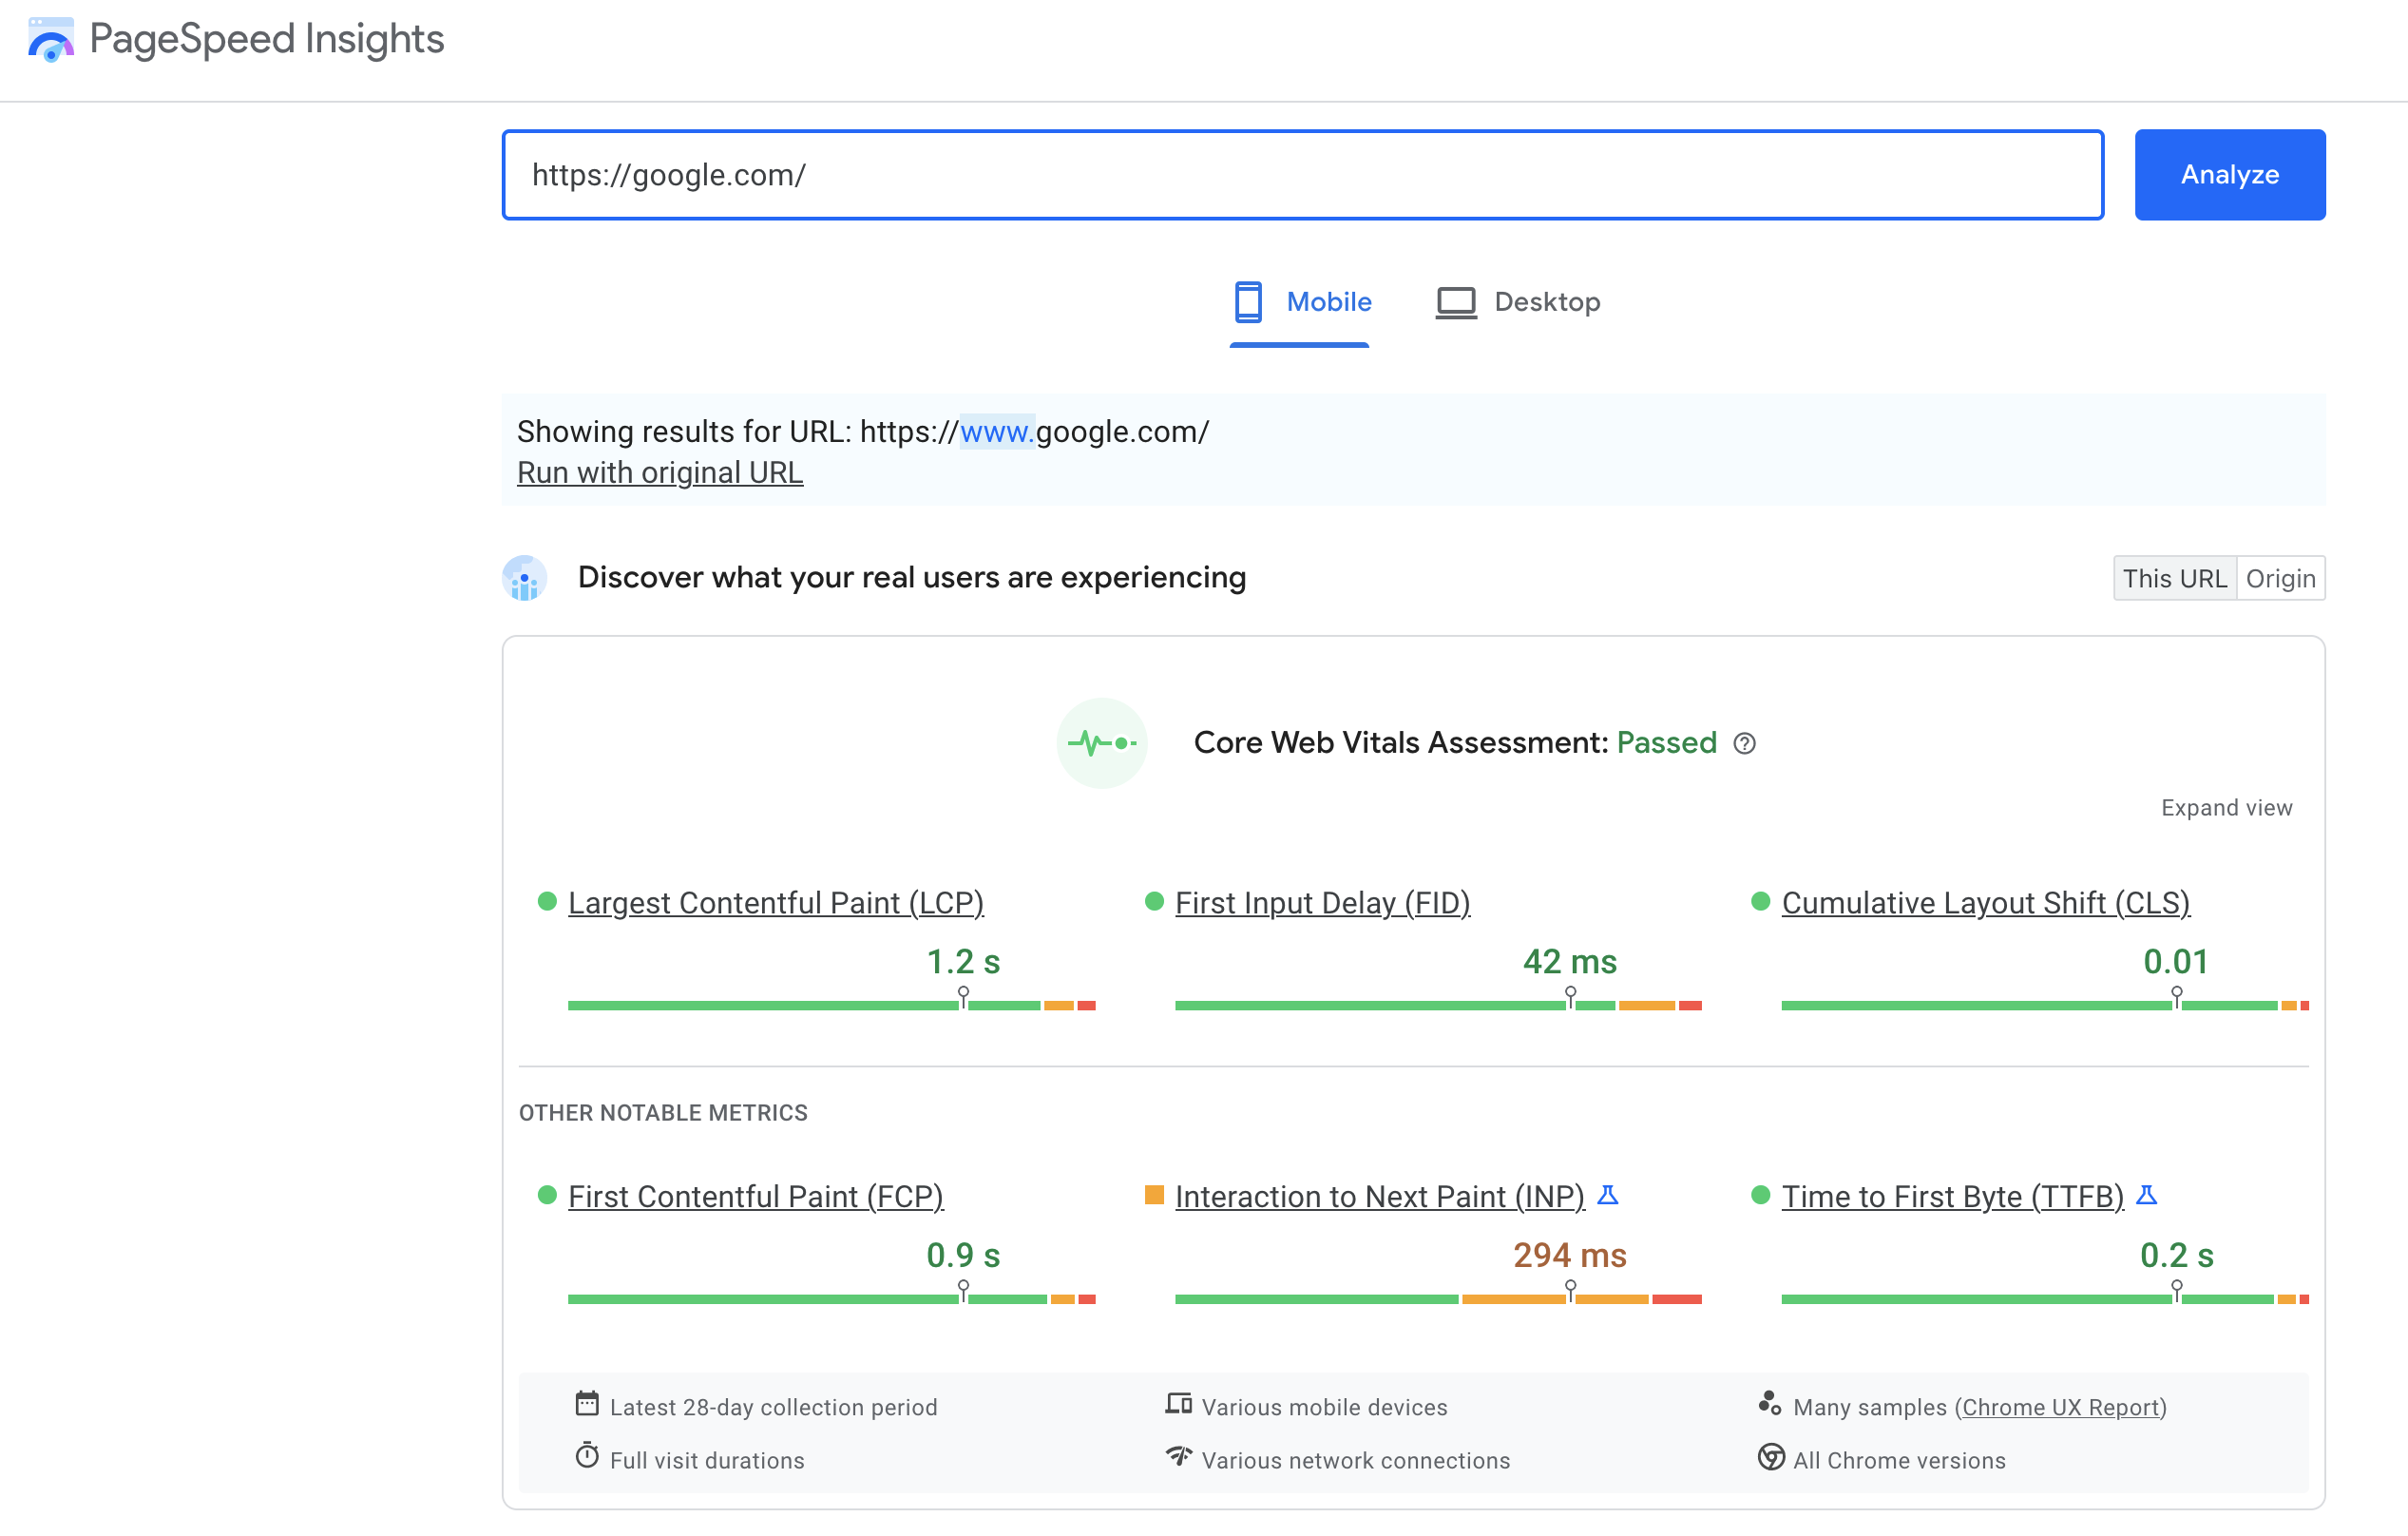
The report will display on the page. PageSpeed Insights allows you to toggle between Mobile and Desktop reports. This report only has information on performance.
How to read Lightbox reports
The report generated in Chrome DevTools is easy to read and comprehensive. So, we will focus on reading this report.
The report gives web pages a percentage score for performance, accessibility, best practices, SEO (Search Engine Optimisation), and PWA (Progressive Web App) if appropriate. The percentage score is based on how the page scores on a variety of metrics.
Metrics and overall scores are colour coded.
- 0 to 49 (red): Poor
- 50 to 89 (orange): Needs improvement
- 90 to 100 (green): Good86
Performance
Several things influence how users perceive performance.
- ‘Perceived load speed: how quickly a page can load and render all of its visual elements to the screen.
- Load responsiveness: how quickly a page can load and execute any required JavaScript code in order for components to respond quickly to user interaction
- Runtime responsiveness: after page load, how quickly can the page respond to user interaction.
- Visual stability: do elements on the page shift in ways that users don't expect and potentially interfere with their interactions?
- Smoothness: do transitions and animations render at a consistent frame rate and flow fluidly from one state to the next?’87
To assess this, the performance score is made up of 6 weighted metrics. The weighting takes into account the degree to which the item influences the user’s perception of performance.
| Performance Metric | Description |
|---|---|
| First Contentful Paint (FCP) | The time when the first text or image is painted. |
| Time to Interactive | The time taken for the page to become fully interactive. |
| Speed Index | How quickly the contents of a page are visibly populated. |
| Total Blocking Time | Sum of all time periods between FCP and Time to Interactive. |
| Largest Contentful Paint | The time when the largest text or image is painted. |
| Cumulative Layout Shift | The movement of visible elements within the viewport. |
Lower figures indicate better performance. I.e., a quicker time to load with greater visual stability and smoothness.
The report also provides opportunities and diagnostics data. This data does not contribute to the score, but addressing these items can improve the page’s score.86, 84
Accessibility
The accessibility score is made up of a weighted average of all accessibility audits. Unlike the performance score, a page will not get points for partially passing a metric. For example, if some, but not all, buttons on a page have accessible names, the page gets zero (0) for Buttons do not have an accessible name audit.
The report organises metrics into ARIA (Accessible Rich Internet Applications), Names and labels, Additional items to manually check, Passed audits, and Not applicable.
There are over 40 accessibility audits. The report will highlight some opportunities to improve the accessibility of your web app. However, only a subset of accessibility issues can be automatically detected so you should manually test items listed in Additional items to manually check.88
Best practices
The best practices score indicates the overall code health of a web page. There are 16 checks with equal weighting (approximately 6 points each). These 16 checks include audits in the following categories:
- General best practices
- Make your page fast
- Make your page secure
- Create a good user experience
- Avoid deprecated technologies
- Diagnostic audits89
SEO (Search Engine Optimisation)
The SEO score assesses how well a page follows basic search engine optimisation advice. The audits are all equally weighted, except for Structured Data which is unscored. SEO audits can be grouped into the following categories:
- Make sure search engines understand your content
- Make sure search engines can crawl and index your page
- Make your page mobile-friendly
In addition to these automated checks, Structured data is valid needs to be manually checked. While SEO score can indicate how good a page’s SEO is, other factors may affect your search ranking, including performance on Core Web Vitals.90
PWA (Progressive Web App)
A good PWA ubiquitously delivers enhanced installability, capabilities, and reliability with a single codebase, regardless of device. It is built and enhanced using modern APIs.
PWA audits check how apps perform the following:
- Starts fast, stays fast
- Works in any browser
- Responsive for any screen size
- Provide a custom offline page
- Is installable91
Practice
Have a go now. Select 2 web pages of your choosing and run Lighthouse reports on them.
Read the reports. Can you identify ways to improve the scores?
Chrome Performance Insights
Another useful testing tool available in DevTools is Performance insights. Performance insights allow you to:
- Record or import a trace
- Get an overview of page runtime performance
- Identify improvements with actionable insights
You can click on insights to review issues and get advice on how to fix them.
DevTools’ Network Panel
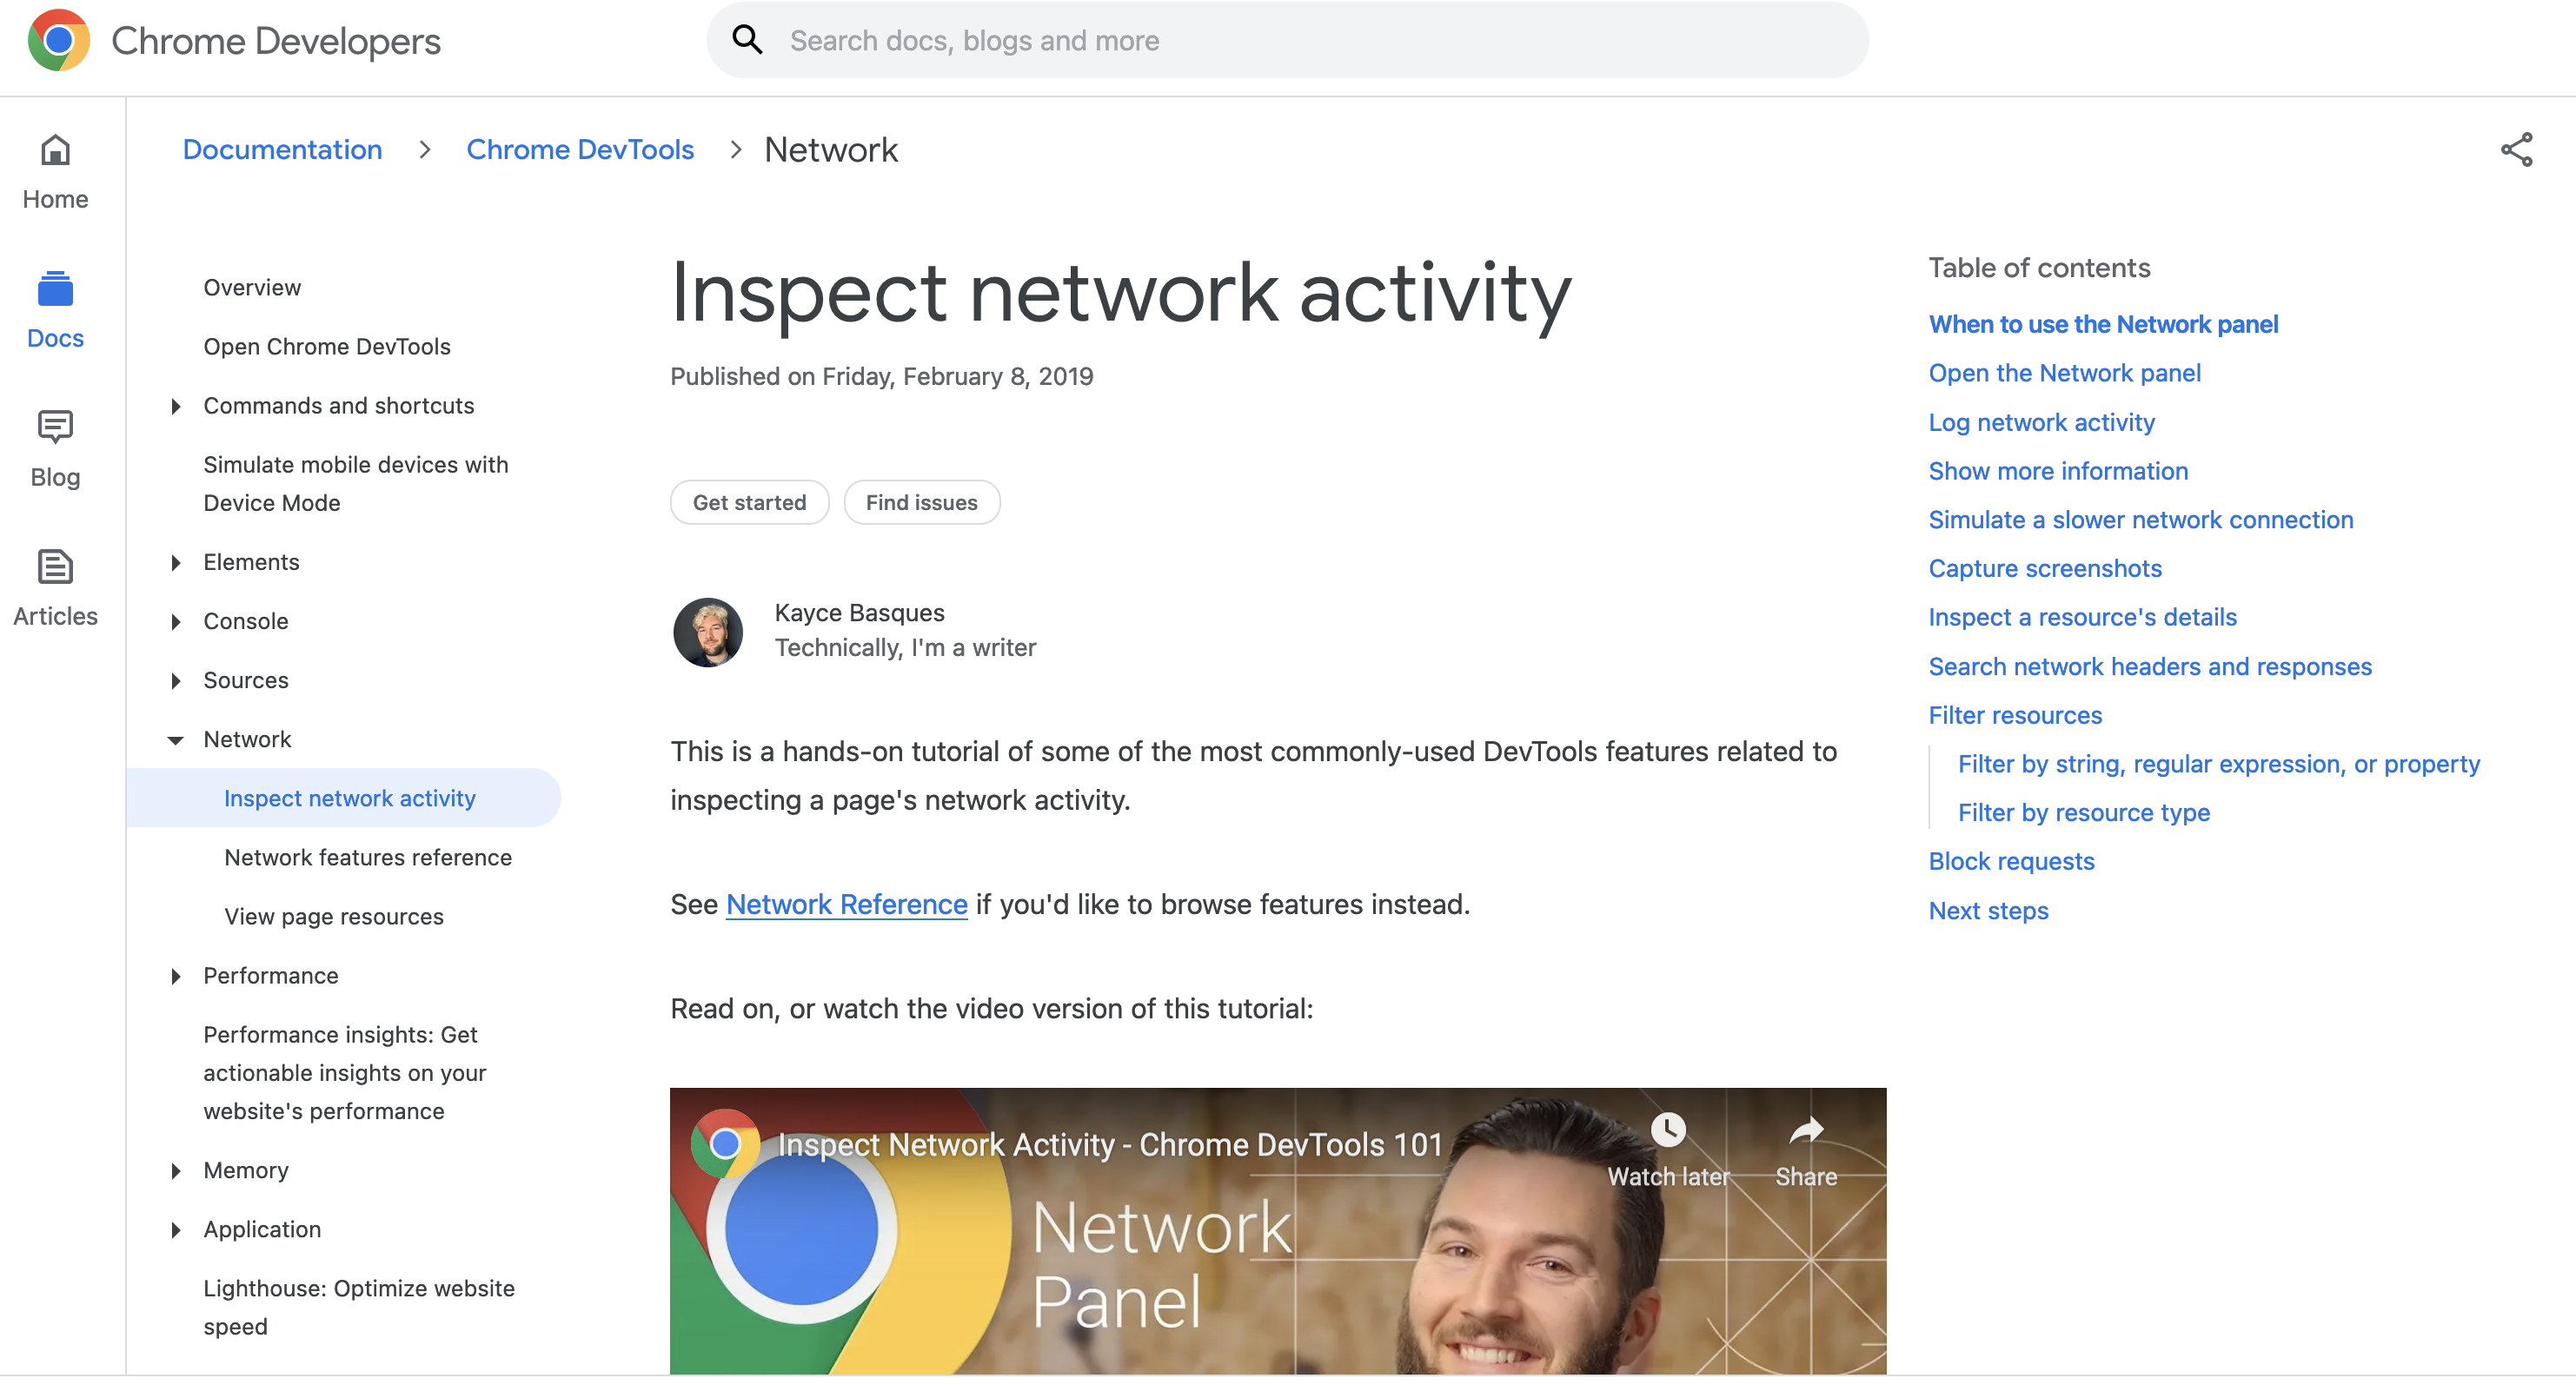
You can test performance using the Network panel in most browsers' developer tools. This displays a log of all network activity during page load and data flow.
Go to a social media page of your choice and open the Network panel in DevTools.
Find the status bar at the bottom. You should see a summary including:
- Number of requests
- Total data transfer
- The total size of uncompressed resources
- Total download time
- The time when the document DOMContentLoaded and window load events were triggered.
By default, the log will be cleared between page loads. This can be changed by selecting Preserve log. You can also opt to Disable cache and select or define download speed profiles in Throttle network speed.
You can show All or select specific items. The table can be reordered to find the largest or most costly resources easily. Click on the name of an asset to see more detail.
The Filter box allows you to search for specific assets or enter criteria. For example:
- is:running: show any incomplete or unresponsive requests
- larger-than:S: limit to files larger than S, which can be expressed as bytes (10000) Kilobytes (1000k), or megabytes (1M)
- -larger-than:S: limit to files smaller than S
- -domain:*.yourdomain.com: show third-party requests that are not from your primary domain
Can you identify the resources with the largest size on your selected social media page? How about the asset with the largest time? Filter to show third-party requests. Can you identify any resources that may have a negative impact on performance, privacy, or security?84
DevTools’ Performance Panel
DevTools in Chrome, Firefox, Safari, and Edge provide a Performance tab that allows you to record a snapshot of browser activity when actions are made. You must record a profile before it can be analysed.
Navigate to the Performance tab in DevTools. The Settings cog allows you to select throttling options for both network and CPU before clicking Record.
Go to a webpage to analyse. Open the Performance tab and hit Record. Load or use the webpage. Hit Stop to generate the performance report.
This report is very comprehensive and can be saved for analysis.84
What does this report tell us?
‘The top timeline chart shows frames per second, CPU usage, network usage, screenshots, and the heap memory size. An area can be selected with the mouse to focus on a specific point.
Result panes can be expanded and collapsed. Versions of Chrome differ, but panes may include:
- Network: loading times for individual files
- Frames: screenshots at points on the timeline
- Interactions: input and animation timings
- Timings: events such as DOMContentLoaded and the First Meaningful Paint
- Main: thread activities such as function calls and event handlers
The final Summary panel changes as you click items in the upper panes. The breakdown may include function call and event details as well as timings where appropriate:
- Loading: time to load assets from the network
- Scripting: JavaScript execution resulting in visual changes (which can also include CSS animations and transitions)
- Rendering: the browser process of calculating which CSS rules apply and how the layout is affected
- Painting: the browser process of filling in pixels and drawing layers in the correct order
- System: other browser activities
- Idle: no activity
The panel can typically be used to discover inefficient activities, including:
- expensive event handlers, such as those attached to scroll or mouseover actions
- long-running JavaScript functions
- slow or badly throttled network requests
- a continually rising JavaScript Heap, which could result from memory leaks or poor garbage collection
- style changes that affect many DOM elements
- animations that incur frequent layout changes’84
DevTools’ Console Logs
The Console Log allows you to profile JavaScript execution by logging messages when events occur. Performance Timing APIs are supported to help analyse code.84
performance.now() returns the elapsed time in milliseconds since the page was loaded. The floating-point number returned represents fractions of a millisecond:
As an application gets more complex, performance.now() can become strenuous. The API allows you to mark when an event occurs and measure the time elapsed between 2 marks. Define a mark by passing a name string to performance.mark():
Each mark() call adds a PerformanceMark object to an array. This defines the name and startTime.
Clear a mark with performance.clearMarks(markName). All marks are cleared when no name is passed.
Calculate the elapsed time between 2 marks by creating a performance.measure():
If there is no start mark, the performance measure will start from the moment the page is loaded. If there is no end mark, the measure will run to the current time.
‘Marks and measures can be accessed with:
- performance.getEntriesByType(type), where type is either "mark" or "measure"
- performance.getEntriesByName(name), where name is a mark or measure name
- performance.getEntries(), to access all items in the array.’
Output the name and duration of every measure:

Compatibility testing is when you test your site across combinations of devices, operating systems, and browsers.
A site may perform well on your own preferred browser, operating system, and viewport, but that does not guarantee it will perform as well on your user’s preferred combo. User research and personas will aid in identifying what browsers or devices you think your target users will use. But the reality is that your users will use a variety.
Compatibility testing is important because you want to ensure your site works for all users, so they stay on the site and complete their goal.
Choosing your testing suite
In a perfect world, you would be confident that your site would work in every situation. But realistically there are going to be a finite number of tests that it is practical to run. Prioritise the devices/viewports, operating systems, and browsers based on user research, market research, and resources.
Ideally you should test with:
- desktop computers running all major operating systems (Windows, Mac OS, Linux)
- the latest version of all major desktop browsers (Chrome, Safari, Microsoft Edge, Firefox) on default settings
- mobile devices running all major operation systems (Android, iOS)
- major browsers across those mobile operating systems (Chrome, Safari, Samsung Internet).
Source: StatCounter Global Stats - Browser Market Share
Source: StatCounter Global Stats - OS Market Share
You can access the latest market shares (including breakdowns by platform and geographical region) on Statcounter.
The number of devices (including desktops, tablets, and mobile) you could test on is endless with new makes and models coming onto the market all the time. Test with whichever real devices you have access to but try for a variety of viewport sizes and orientations.82
Device testing
Testing on real devices is preferable, but not always possible. Fortunately, there are online tools available to provide an approximation of how your site looks and performs on different devices. Device Mode on Chrome DevTools is one of those tools.
Device Mode on DevTools allows you to see an approximation of how your site looks and performs on mobile devices.
It is important to note that Device Mode is an approximation only. It does not actually run code on a mobile device and so cannot simulate all aspects of a mobile device. You are still best to test your site on a real device and use remote debugging to view and debug code from your desktop or laptop while it is running on the mobile device.
Device Mode is a loose collection of features in DevTools that provide mobile device simulation. These include:
- Simulating a mobile viewport
- Throttling the network and the CPU
- Simulating geolocation.92
Simulating a mobile viewport
In DevTools, click Toggle Device Toolbar. This will open a UI that allows you to simulate a mobile viewport.
You can drag the handles from the side, bottom, or corner to resize. Alternatively, specify values in the width and height box.
By default, the UI will open in Responsive Viewport Mode. Select the dimensions dropdown to select various popular devices. You can also alter the orientation.
Use the vertical hamburger menu to add options for Device Type. This allows you to check mobile and desktop touch and no touch. If you have selected a set device, the device type will be greyed out. If applicable, the simulation will allow you to use your mouse to mimic touch movement.92

- Device dimensions
- Mobile or tablet context
Throttling the network and the CPU
From the device toolbar, you can select various throttle settings including mid-tier mobile, low-end mobile, and offline.
‘Mid-tier mobile simulates fast 3G and throttles your CPU so that it is 4 times slower than normal. Low-end mobile simulates slow 3G and throttles your CPU 6 times slower than normal.’ This is relative to the normal capability of your laptop or desktop that you are using to view the device toolbar.
If you want only to throttle the CPU, and not the network, navigate to the Performance panel, click Capture Settings, and select the appropriate slowdown option.
To throttle the network only, and not the CPU, navigate to the Network panel, and choose Fast 3G or Slow 3G from the Throttle list.92

- Performance panel
- Network panel
Simulating geolocation
To override geolocation, click Customize and control DevTools and select More tools > Sensors. From here you can select presets from the Location list or enter custom coordinates in Other... If you want to test how your site performs when geolocation is in an error state, select Location unavailable.92

- Menu to customise and control DevTools
Try it out
Open DevTools now and see how this page looks and performs on various devices.
Browser testing
There are a variety of browser testing tools available. Check out the following:
Knowledge check
Production-ready site
For this milestone, you should be able to:
- Create easy customisation for the client
- Migrate a local CMS project to a remote server
- Conduct compatibility testing
- Use plugins to extend a theme
- Conduct acceptance testing.
Extend your custom theme that you created in the custom theme mōhio to:
- Make use of the WordPress Customisation API
- Include plugins to improve the site’s:
- Security
- SEO
- Performance.
You should also:
- Perform compatibility testing
- Use a plugin to migrate the site to a remote server
- Perform acceptance testing with your tutor.