Financial reports, and financial data, provide an overview of a financial position, performance, and cash flow. Reports are important documents because they show how the company is performing financially in the short and long term. Investors, creditors, and other stakeholders use financial reports to make decisions about whether to invest in, lend to or trade with a company.
Sections 292 to 294B of the Corporations Act require the following companies to prepare financial reports:
- disclosing entities, including entities listed on a stock exchange, borrowing corporations and entities that borrow funds by issuing a prospectus or product disclosure statement.
- public companies
- large proprietary companies
- small proprietary companies which are foreign controlled and whose results are not included in consolidated reports lodged with the ASIC
- small proprietary companies that are requested by 5% or more of shareholders or by the ASIC to prepare financial reports.
- registered schemes.
The table below lists the components of the annual financial report.
| Document | Section of the Corporations Act |
|---|---|
| Statement of financial position as at the end of the year (if consolidated accounts are not required) | 295 (2) and 296 (1) |
| Statement of comprehensive income for the year (if consolidated accounts are not required) |
295 (2) and 296 (1) |
| Statement of cash flows for the year (if consolidated accounts are not required) | 295 (2) and 296 (1) |
| Statement of changes in equity (if consolidated accounts are not required) | 295 (2) and 296 (1) |
| Consolidated financial statements, if required by accounting standards– which may include parent entity financial information | 295 (2) and 296 (1) |
| Notes to financial statements (disclosure required by the regulations, notes required by the accounting standards, and any other information necessary to give a true and fair view) | 295 (3) |
| Directors’ declaration that the financial statements comply with accounting standards, give a true and fair view, there are reasonable grounds to believe the company/scheme/entity will be able to pay its debts, and the financial statements have been made in accordance with the Corporations Act | 295 (4) |
| Directors’ report, including the auditor’s independence declaration | 298-300A |
| Auditor’s report | 301 and 308 |
Two reports disclosing entities must lodge to comply with the Corporations Act 2001 are:
- An annual financial report within three months after the end of the financial year. Section 319 of the Corporations Act requires a disclosing entity or registered managed investment scheme to lodge the complete financial reports within three months after the end of the financial year.
- Half-year or six months or semi-annually: Unless the entity is not a disclosing entity when lodgement is due (section 302 of the Corporations Act) or if the entity’s first financial year lasts for eight months or less (see ASIC Corporations (Disclosing Entities) Instrument 2016/190), half-yearly reports must be:
- prepared in accordance with Chapter 2M of the Corporations Act
- subjected to audit or review
- lodged with ASIC within 75 days of the half-year end.
Auditors must review financial reports in accordance with S307 of the Corporations Act 200112:
- If the financial records are sufficient to enable the financial report to be prepared and audited.
- If all information, explanation and assistance necessary to conduct the audit were provided.
- If the reports comply with accounting standards and represent a fair and true view of the accounts of the entity.
- If records and registers have been kept.
The balance sheet shows a company's assets (what it owns), liabilities (what it owes) and shareholders' equity (the value of the company's shares). The income statement shows how much revenue the company has generated and how much profit it has made over a given period. The cash flow statement shows how much cash is available to satisfy or pay for business liabilities at any given time.
Relevant data will be included in the following:
- consolidated financial report
- stakeholder’s equity report
- reports aiding the acquisition of corporate entities
- tax affected account report.
Using MYOB Essentials or similar, you can export the necessary financial data to prepare a consolidated financial report using Excel. MYOB does not produce consolidated financial reports. The ‘send to’ option in MYOB allows you to export the report into Excel or output it as a CSV or tab delimited file.
Follow the steps to export journal entries:
- Start-up MYOB. From the main menu at the top of screen: File - Export Data - Journal Entries
- The Export Transaction Journals screen appears:
- In the first two boxes, accept Tab Delimited and Header records
- In the third box, Source Journal, change Nominal to All
- Enter the beginning and end dates of your current financial year.
- Continue.
- In the next screen, the MYOB fields are listed on the right.
- Click on the first nine fields Journal Number to Exchange Rate, so that they are marked Fields 1-9.
- Export. A file is generated called JOURNAL.TXT.
- Save JOURNAL.TXT, and make a note of which folder you saved it in.
- Minimise MYOB. Start-up Excel. Open a blank worksheet.
To import the data into Excel, select Data - Import External Data - Import Data for Excel 2003, Data - Get External Data - From Text for Excel 2007, or Data - Get External Data - Import Data for Excel after 2003. When the Select Data Source box appears, find JOURNAL.TXT and open it.
A full tutorial can be accessed here14.

Preparing consolidated financial statements involves adding together the financial data disclosed in the financial statements of the parent and subsidiary after making two (2) types of consolidation adjustment eliminations. The adjustments are as follows:
- At acquisition – the elimination of the cost of the parent entity’s investment in the subsidiary against the equity acquired in the subsidiary, e.g. offset cost of investment against equity acquired.
- Subsequent to acquisition –the elimination of transactions between entities within the economic entity subsequent to acquisition by the parent entity.
Consolidated financial statements are prepared outside the framework of the parent and subsidiary accounts and include data disclosed in the accounts of the parent and the subsidiary. No entries or adjustments are made in the accounts of the parent and the subsidiary. The process of consolidating or adding together the data disclosed in the accounts of the parent and subsidiary can be achieved through the use of a consolidation worksheet. It is necessary to prepare a consolidation worksheet for every reporting period.15
Public companies must lodge a Consolidated Finance Report with ASIC (the Australian Securities and Investments Commission). This report is an annual return that includes the financial statements of all entities that are controlled by the company.
The Consolidated Finance Report is used to provide a snapshot of the overall financial position of a company and its subsidiaries.
It usually includes a profit and loss statement, a cash flow statement and a balance sheet.
In your assessment, you will need to prepare consolidated financial statements. Review and download the example financial statements from Grant Thornton16.
The following youtubes provide helpful information about consolidated reports and how to consolidate accounts using Excel.
Prepare a profit and loss statement
A profit and loss statement, or income statement, is one of the most important financial documents a business produces. It shows how much money has come in and gone out over a specific period. The profit and loss statement can also be used to track the success of a business, spot trends, make predictions about the future, and calculate things like tax liabilities.
The Income Statement can be presented in two (2) industry-standard formats: the nature of expense format and the function of expense.
| Formats | Description |
| Nature of expense | The expenses in an income statement are either classified by their nature or by their function. An income statement by nature method is the one in which expenses are disclosed according to their nature, such as depreciation, transport costs, rent expense, wages and salaries etc. There is no reallocation of these expenses to different functions of the entity (i.e. cost of goods sold, selling costs, administrative costs and other expenses).17 |
| Function of expense | An income statement by function is the one in which expenses are disclosed according to their functions such are cost of goods sold, selling expenses, administrative expenses, other expenses/losses etc. This method allows us to calculate gross profit and operating profit within the income statement and therefore it is usually used in the multi-step format of income statement. Most large and medium-sized businesses use the function method of expense disclosure.18 |
Business Victoria19 has example financial statement templates. The image below shows how to calculate profit and loss.

An example of a profit and loss statement appears below.
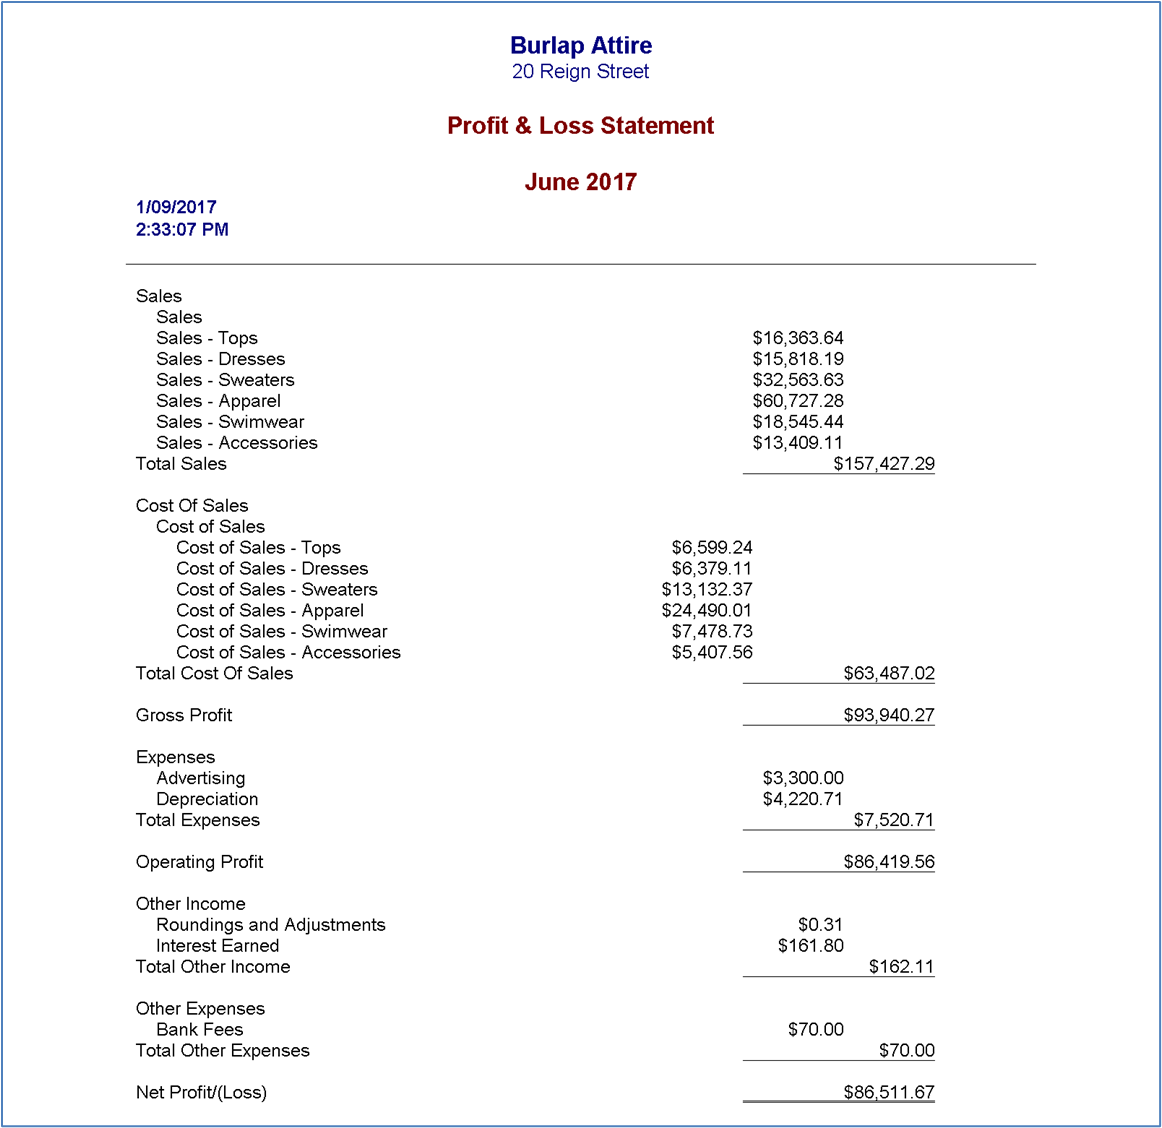
More information about profit and loss statements and a template are available here20. Another template with instructions is available here21.
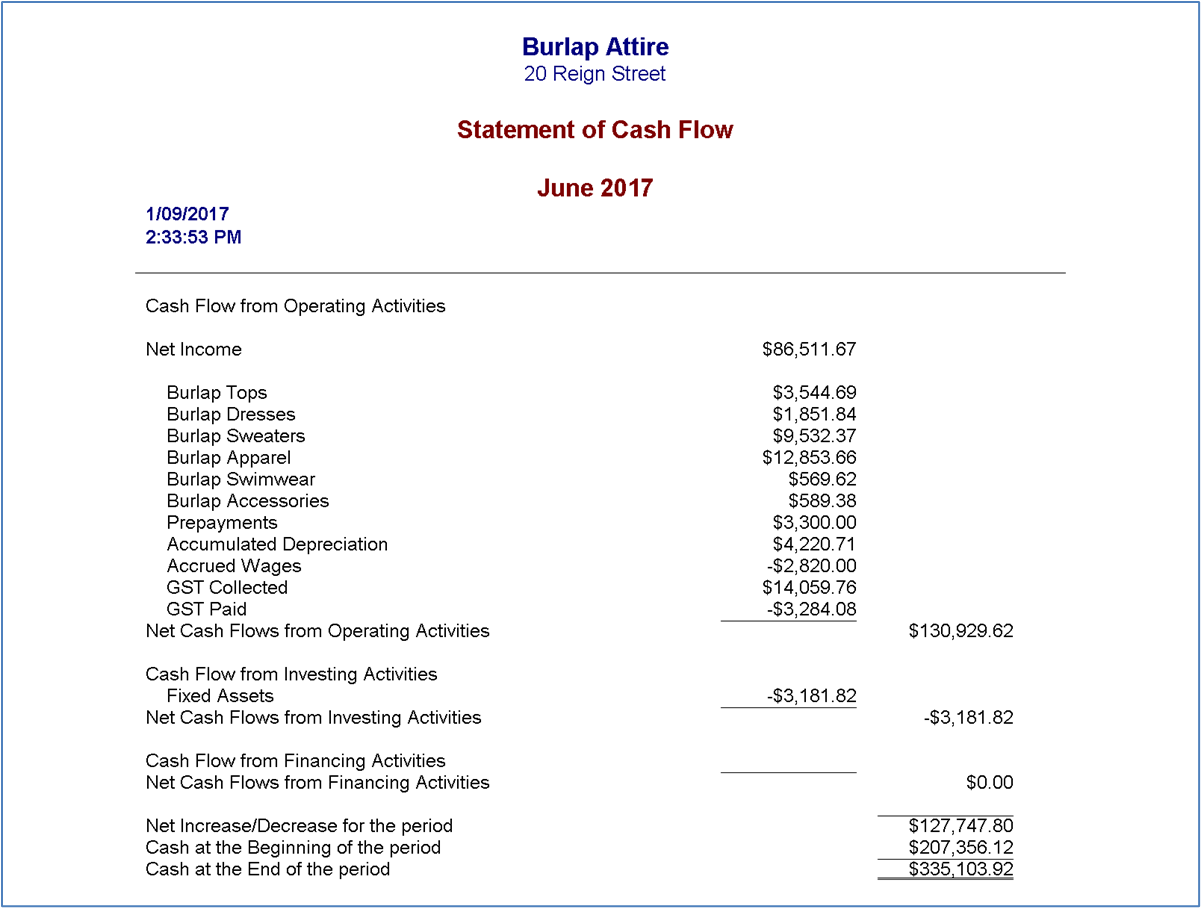
Prepare a cash flow statement
A cash flow statement is a financial report that shows how much cash a company has generated and used during a specific period. The statement can assess a company's ability to generate cash flow from its operations, invest in new projects, and meet financial obligations.
Typically, this type of financial report is divided into three sections:
- Operating activities. Operating activities include revenue generated from the sale of goods and services and the costs associated with producing those goods and services.
- Investing activities. Investing activities include purchasing or selling long-term assets, such as property or equipment.
- Financing activities. Financing activities include issuing or repaying debt, as well as issuing or buying shares of stock.
An example appears below.
Another example and instructions to produce a cash flow statement are available here22.
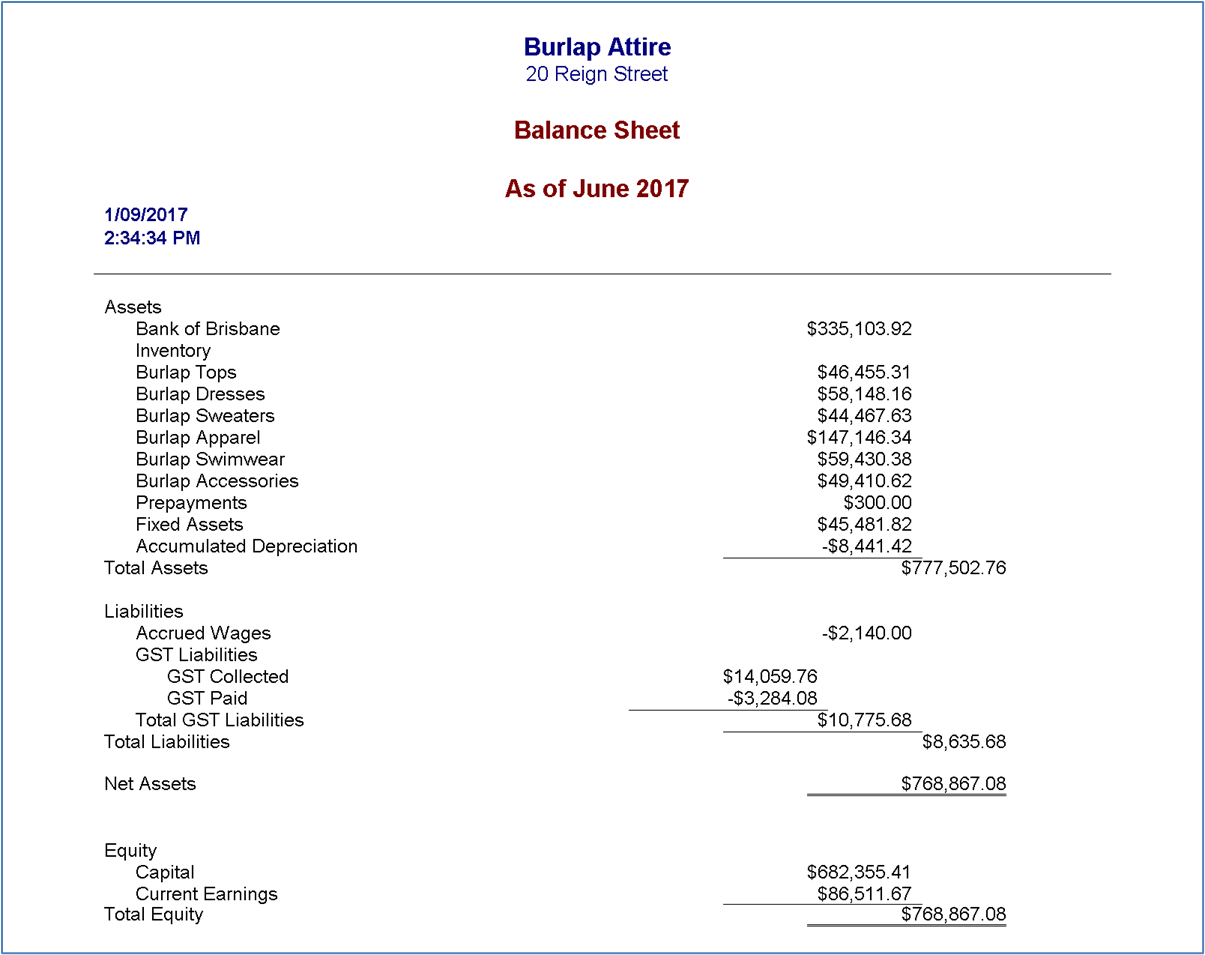
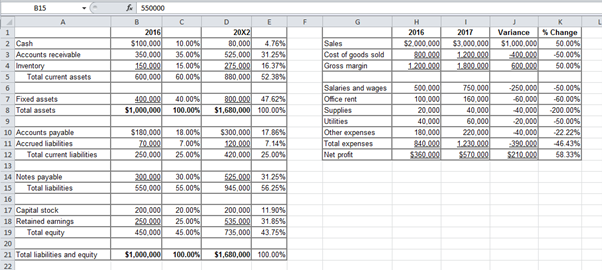
Prepare a balance sheet
The balance sheet is a financial statement that shows the financial position of a business at a particular point in time. It lists the assets, liabilities, and equity of the business. Assets are things that the business owns and can use to generate income. Liabilities are amounts that the business owes to others. Equity is the difference between the assets and liabilities of the business.
Balance sheets are used by businesses to report their financial position to creditors, shareholders and other stakeholders. They are also used by businesses to monitor their financial performance over time. Balance sheets must be prepared in accordance with Australian Financial Reporting Standards (ASX FRS).
There are two types of balance sheets - cash basis and accrual basis.
The most common system in Australia is accrual basis accounting, which records revenue when it is earned and expenses when they are incurred, regardless of when the cash changes hands. This gives a more accurate picture of a company's financial position and performance. On the other hand, cash-based accounting records revenue when cash is received and expenses when cash is paid out. This can lead to discrepancies between actual performance and reported performance.
Read more about cash and accrual accounting here23.
An example of a balance sheet appears below.
Another example and instructions to produce a balance sheet are available here24.
Follow procedures relating to conflict of interest, confidentiality, and disclosure
In relation to all financial reporting in Australia, conflict of interest, confidentiality, and disclosure requirements are important. Requirements are regulated by the Corporations Act 2001 (Cwth) (the ‘Act’). The Act sets out the rules that companies and other corporate entities must follow to ensure that their financial statements are accurate and complete.
One of the key provisions of the Act is the requirement for directors to disclose any conflict of interest they may have in relation to a financial transaction or arrangement involving the company. Directors must comply with disclosure requirements and keep information confidential.
Failure to comply with these requirements can lead to serious consequences, including fines and imprisonment. Therefore, companies and their directors must be aware of their obligations under the Act and take steps to ensure compliance.
Additional information about each requirement appears below.
Conflict of interest
Conflict of interest arises when an individual or organisation is faced with the choice of either advancing their own interests or fulfilling their professional or ethical responsibilities. This can manifest itself in several different ways, such as when a company is asked to audit its own financial statements or when a board member has a personal stake in a decision that needs to be made.
While conflicts of interest can occur in any industry, they are particularly common in the financial sector. This is because financial reporting is often seen as being rife with opportunities for manipulation and self-dealing. As a result, regulators have put in place several rules and regulations to prevent conflicts of interest.
The procedure to prevent conflicts appears below.
A [member] shall take reasonable steps to identify circumstances that could pose a conflict of interest. Such circumstances may create threats to compliance with the fundamental principles. For example, a threat to objectivity may be created when a [member] competes directly with a client or has a joint venture or similar arrangement with a major competitor of a client. A threat to objectivity or confidentiality may also be created when a [member] performs services for clients whose interests are in conflict, or the clients are in dispute with each other in relation to the matter or transaction in question.
Confidentiality
There is a reason why certain information is confidential and not meant to be shared with the public. When it comes to financial reporting, certain figures and data need to be kept under wraps so as not to give away too much about a company's strategy or future. This is especially important during earnings season when investors and analysts try to piece together clues about how a company is performing.
While it may be tempting to leak information to get ahead of the competition, companies must remember that confidentiality is key when it comes to financial reporting. Violating this trust can lead to serious consequences, such as fines from regulators or lawsuits from shareholders.
To respect the confidentiality of information acquired because of professional and business relationships and therefore, not disclose any such information to third parties without proper and specific authority, unless there is a legal or professional right or duty to disclose, nor use the information for the personal advantage of the member or third parties.
The principle of confidentiality imposes an obligation on all members to refrain from:
- disclosing outside the firm or employing organisation confidential information acquired because of professional and business relationships without proper and specific authority or unless there is a legal or professional right or duty to disclose.
- using confidential information acquired because of professional and business relationships to their personal advantage or the advantage of third parties.
Disclosure
Disclosure is a key component of financial reporting. When investors and other users of financial statements can see how a company is performing, they can make better investment decisions. Financial statement disclosures also help ensure that companies are held accountable for their actions.
Companies must make different types of disclosures in their financial statements; some disclosures are required by law, while others are made at the company's discretion. In general, disclosures should include information important to users of the financial statements and not already included in the financial statements.
Companies must be careful when disclosing information to ensure they do not violate securities laws or other regulations. In some cases, companies may be required to get permission from regulators before disclosing certain information.
The following are circumstances where members may be required to disclose confidential information appear below:
- Disclosure is permitted by law and is authorised by the client or the employer.
- Disclosure is required by law, for example:
- Production of documents or other provision of evidence in the course of legal proceedings; or
- Disclosure to the appropriate public authorities of infringements of the law that come to light; and
- There is a professional duty or right to disclose, when not prohibited by law:
- To comply with the quality review of a member body or professional body
- To respond to an inquiry or investigation by a member body or regulatory body
- To protect the professional interests of a Member in legal proceedings; or
- To comply with technical standards and ethics requirements.
Preparation of a stakeholder funds report is an important step in ensuring compliance with reporting requirements.
The steps to preparing a stakeholder funds report are:
- Review the reporting instructions and identify the key stakeholders who will need to receive the report.
- Collect the data for the report, including information on contributions, expenditures, and balances.
- Format the data for presentation in the required format.
- Distribute the report to the appropriate stakeholders.
An example of a stakeholders’ equity report appears below.
Watch the video below to learn more about stakeholder reports in accounting.
Check for errors
When reviewing any report, it is important to check for errors.
Different types of errors can occur, and it's important to identify them so they can be corrected.
Common errors include:
- Incorrect amounts. This is the most common type of error, and it can happen when figures are misrecorded or transposed.
- Misclassification of expenses. This happens when expenses are incorrectly classified as either capital or revenue expenditures.
- Wrong dates. Sometimes numbers are entered incorrectly, which can lead to inaccurate statements.
- Errors in calculations. These can occur when formulas are not correctly applied or when there is a mistake in the underlying data.
If amendments are required, correct the errors, and save a new version according to organisational policies and procedures.

When a company is looking to acquire another company, a variety of reports need to be prepared to make the best decision possible. Reports help the acquiring company understand the financial health of the target company and any potential liabilities they may be taking on. In addition, reports can help to identify any areas where the target company may be weak so that the acquiring company can make sure they are aware of any potential problems before completing the acquisition. By preparing accurate and timely reports, you can ensure a smooth corporate acquisition.
The IFRS 3 establishes principles and requirements for how an acquirer in a business combination:
- recognises and measures in its financial statements the assets and liabilities acquired, and any interest in the acquiree held by other parties
- recognises and measures the goodwill acquired in the business combination or a gain from a bargain purchase
- determines what information to disclose to enable users of the financial statements to evaluate the nature and financial effects of the business combination.
The core principles in IFRS 3 are that an acquirer must measure the cost of the acquisition at the fair value of the consideration paid, allocates that cost to the acquired identifiable assets and liabilities based on their fair values, allocates the rest of the cost to goodwill; and recognises any excess of acquired assets and liabilities over the consideration paid in profit or loss immediately. The acquirer discloses information that enables users to evaluate the nature and financial effects of the acquisition.
Applying the acquisition method involves:
- identifying the acquirer
- determining the acquisition date
- recognising and measuring the identifiable assets acquired, the liabilities assumed and any non-controlling interest in the acquiree
- recognising and measuring goodwill or a gain from a bargain purchase.
If a business/corporation acquires another business they need to provide details of it in the notes to the financial reports. Read page 39 “Acquisitions and disposals” example note from Grant Thornton IFRS Example Consolidated Financial Statements 2021.14
Develop charts, diagrams, and tables
There are many different types of charts, diagrams and tables that can be used in financial accounting. The three most common chart types are:
- line graphs show how a variable change over time by connecting data points with a line.
- bar graphs compare two or more items by displaying them as bars of different heights
- pie charts show how a whole is divided up into parts by displaying them as slices of a pie.
There are also many different diagram types that can be used in financial accounting. The two most common diagram types are flowcharts and network diagrams. Flowcharts illustrate the steps in a process by using arrows to connect boxes that represent steps. Network diagrams show the relationships between objects by using lines to connect them.
The three most common table types are crosstabs, pivot tables and data tables.
Some examples appear below.
Graphs
Graphs use visual elements to make large numbers and complex information more understandable. They efficiently display large amounts of data and help identify and interpret patterns in the data. The common graphs are bar graphs, pie charts, line graphs and scatter plots. Each type has a different function in displaying data, such as showing comparisons, analysing proportional distributions, identifying changes over time, and clarifying the connection between two numerical measurements.
Column graphs – Consist of patterned rectangles displayed along a baseline called the x-axis (horizontal axis). The height of the rectangle represents the amount of data. These graphs best show changes in data over time (short time series) and comparisons of several items (the relationship between two series).

Bar graphs – Column charts in which the rectangles are arranged horizontally, and the length of each rectangle represent its value. Bar graphs best show data series with no natural order.

Line graphs – Connect data points with lines; different series are given different line markings (for example, dashed or dotted) or different tick marks. Line graphs are useful when the data points are more important than the transitions between them and to show the comparison of long series and a general trend.
Tables
Tables are recommended for relatively smaller amounts of values that belong to a single category. Whereas graphs provide a quick overview of data, tables can emphasise these values. Incorporating data in texts even exceeds such a level of emphasis, especially when there are only two values to present.
If it succeeds in communicating the results and interpretations to the audience, the researcher can use any of these methods of presenting data.
The advantages of using tables and graphs to organise data include easy visualisation of statistics, poignant descriptions of data, the provision of a summary of the overall work and the interest people show to graphics over words. Disadvantages include the technical precision, time, and funding resources necessary to create tables and graphs.
Graphs are meant to be focused on the data in question and how it trends. Graphs have exact numerical figures shown on axes, usually organised on the left and bottom of the graph. Common graph types include dot-and-line and bar graphs. Graphs are most used in analyses and situations that require raw and exact data.
Charts
Charts are designed to show differences in things like surveys and figures in a more aesthetically pleasing way. Charts have numerical figures in line or popping out of the visual representations themselves. Pie charts are the most common type of chart.
A pie chart is a circle with radii connecting the centre to the edge, and the area between two radii is called a slice. Data values are proportionate to the angle between the radii, and pie charts best show parts of a whole.

Follow the steps below to generate graphs, tables, and charts in Excel
Step 1: Get your data into Excel.
Input your data into Excel or import data from MYOB.
Step 2: Choose a type of chart/ graph to create.
In Excel, you have plenty of choices for charts and graphs to create. (For help figuring out which type of chart/graph is best for visualising your data, check out a free e-book, How to Use Data Visualization to Win Over Your Audience.)25
Step 3: Adjust your labels and legends, if desired.
To change the labelling layout and legend, click on the bar graph, then click the Layout tab. Here you can choose what design you prefer for the chart title, axis titles, and legend.
The resulting graph would be changed to look like the example below.

Step 4: Reorder data, if desired.
To sort the data so the software choices appear in descending popularity order, click on the column that is most important to you, click on the Data tab, and click Filter. Then go back to Column B, click the down arrow, and click Sort Largest to Smallest.
To see the full tutorial on generating graphs, tables, and charts in Excel, click here. 26
Tax-affected accounts are those which have had tax withheld or credits reduced. If the business owns foreign assets, receives foreign income, or does cross-border transactions, it may have tax-affected accounts.
Businesses in Australia are required to comply with several taxation requirements when preparing their corporate accounting reports. The most important of these is the payment of company tax, which is levied on the profits of companies at a rate of 30%. Businesses must also declare all income and expenses in their financial statements and may be required to pay Fringe Benefits Tax (FBT) on any benefits provided to employees. Other taxes applicable to businesses include Goods and Services Tax (GST), Pay As You Go (PAYG) withheld tax, and stamp duty.
To confirm compliance, check that your tax-affected account reports include mandatory payments in the correct amount.
Financial reporting requirements and information about auditing is available here.27
Locate information about BAS and other taxes from the Australian Taxation Office (ATO)28
BAS statements are prepared by completing a BAS form from the ATO or using financial software.
Additional information about tax-affected accounting and reporting is available here.29
Ensure the correct structure and format
Organisations have a few options regarding the structure and format of financial reports. The most common way to structure a report is by type of account, such as assets, liabilities, and equity. Another way to structure a report is by time, such as monthly or annual.
Another popular format for reports is the statement of cash flows. This layout presents an overview of a company's incoming and outgoing cash flow.
There are many templates available for creating different types of financial reports. Some are specific to certain software programs, while others are more general in nature. Choose a template that is easy to use and understand.
Follow the steps to confirm the requirements:
- review the instructions provided by your employer
- heck relevant policies and procedures
- download the required templates
- ask a supervisor or manager, if you need help