Quality planning activities take place alongside the project initiation and planning phases of project management (PM). Some of the inputs for quality planning activities come from these PM phases. Quality planning determines applicable standards for the project and how to satisfy them. The goal is to create a quality management plan (QMP) which documents:
- The way the team will implement the quality policy
- How the quality of both the project and the product will be assured
- The resources required to ensure quality
- Additional activities required to carry out the quality plan. 6
By the end of this topic, you will understand:
- quality planning activities
- external risks and factors that can influence a project
- the role of stakeholders in quality management
- the importance of having a quality management plan
- how to develop a quality management plan
- what is meant by quality metrics and measurement
- what is meant by quality checklists, process improvement plans and quality baseline
- commonly used tools and techniques for quality planning.

In 1.2, we said that quality planning activities include developing the following items:
- Quality management plan (QMP)
- Quality metrics
- Quality checklists
- Process improvement plan
- Quality baseline
- Updates for the project management plan (PMP)
Inputs for QP activities
Inputs for QP activities may include:
- Items from the project management plan:
- Project charter
- Scope statement
- Project objectives
- Work breakdown structure (WBS) and WBS dictionary
- Risk management plan
- Quality policy and quality objectives
- Other relevant policies and procedures
- Financial requirements for the project, including relevant accounting cost codes
- Relevant legislation and standards
- Lessons learned from other projects, including audit results, test plans and cases and data analysis
The scope statement and objectives describe the required project deliverables. The risk management plan describes the identified or potential risks for the project and how they will be managed. The quality policy describes the organisation’s commitment to comply with standards and requirements for delivering its products and services. The quality objectives are the measurable goals that must be met to fulfil the quality policy.
Other relevant policies and procedures depend on the work tasks to be carried out and the required resources. Examples may include policies and procedures covering workplace health and safety, confidentiality and privacy, use of organisational equipment and premises, employment of contractors and consultants etc. Relevant financial requirements may cover travel and other expenses, accounting cost codes to be used for reporting etc. Relevant standards include legislation and industry requirements.
Where to find these documents
The project charter, scope statement and objectives are usually developed and approved as part of initiating the project. In addition, the project manager usually develops the risk management plan during the project management planning phase.
Depending on the size and type of project, and the organisation’s approach to project management, a WBS, WBS dictionary, and project schedule may have already been developed. If not, they may need to be developed as part of the quality planning activities. Ask relevant departments or managers for access to relevant policies and procedures, financial requirements and records from previous projects.
Work Breakdown Structure (WBS)
A work breakdown structure (WBS) defines what will be done for a project. The activities and sub-activities for the required scope of the work are displayed in a hierarchical structure in an easy-to-understand chart or table.
Watch
If you want to learn more about a WBS, watch the following videos and research further.
What is a Work Breakdown Structure - WBS? PM in Under 5 (6:44) by Online PM Courses:
Project Management Tips: How to Build a WBS For Your Project Using Microsoft Word (13:47) by Tony Zink:
Resource
Work Package vs Activity Blog by Belinda Goodrich on the PM Learning Solutions
WBS Dictionary
A WBS dictionary is a table or spreadsheet that lists and describes each component in the WBS. Its purpose is to help clarify these items later when team members are working, or stakeholders have questions when viewing deliverables. A WBS and WBS dictionary can also be developed using project management software.
Resources
If you would like to find out more about a WBS dictionary, review the following resources:
What is a WBS Dictionary? On the work breakdown structure
12 Things to Include in a WBS Dictionary by Bernie Roseke on the Project Engineer website
Project Schedule – Gantt Chart or Network Diagram
A project schedule records when the agreed work activities will be carried out during the agreed timeframe. The most common formats are a Gantt chart or network diagram.

A Gantt chart is a bar chart showing the tasks and milestones scheduled over time. A Gantt chart can be developed as a spreadsheet or word-processing table for a small project. A network diagram is a schematic view of the project tasks and the workflow needed to complete them.
Project management software usually includes Gantt chart or network diagram functionality. This functionality makes it easier to track the project and update the schedule as the work progresses.
If you would like to find out more about a project schedule, watch the following videos and review the resources:
Watch
Project Management in Under 5: What is a Gantt Chart? (5:21). Watch this video by Mike Clayton of Online PM Courses explaining Gantt charts and how they apply to project management.
Resource
A simple Gantt chart template (Excel spreadsheet) is available from the Microsoft Office Products website
What is a Network Diagram in Project Management? Wrike FAQ Blog
All projects are subject to external risks and environmental factors. Some risks include world events, economic changes, politics and trading relationships with other countries. Many of these risks are outside the organisation’s control and can impact a project in many ways, such as delayed or unavailable resources and equipment. Worldwide events such as the COVID-19 pandemic mean that many projects must be re-scheduled or abandoned. The project management plan includes a risk management plan prepared by the project manager. This identifies risks for the specific project, estimates the severity of the consequences of these risks and documents strategies to lessen the impact of each risk or prevent it from happening.
Environmental factors relate to the organisation’s environment or situation. These factors include how the organisation views and responds to risk, its comfort level with financial investments, its perspective on innovation and the perception of itself as a brand it wishes to foster. An organisation may have its own system for dealing with and managing these external risks and other factors, which is carried out independently of a project's risk management process. A project manager needs to understand the organisation’s approach to dealing with these over-arching risks and environmental factors and be able to manage project-related risks within the organisation’s broader risk requirements.

A stakeholder is anyone involved with a project or affected by it. Stakeholders can be internal or external to the organisation. Key stakeholders include:
- Project owner, sponsor or project client
- Customers, users or consumer clients who receive the product or service
- Project team members and experts hired to give input for the work
- Other individuals or entities that approve aspects of the work
The ultimate judges of quality are those stakeholders who will use the delivered product or service. Their judgement, however, may be subjective. PQM defines the required quality characteristics and determines how these will be measured objectively. The project management process includes engaging and communicating with stakeholders, managing their expectations and collecting their input. Stakeholder expectations can be broader than the written requirements for the deliverables. They may have other needs, perspectives and attitudes about the project, which can be important.
Depending on the size and complexity of the project, the project management plan may include a stakeholder list and an analysis of stakeholder characteristics. This is called stakeholder mapping. It determines what stakeholders need to know about the project, when, and how. The project manager prepares a stakeholder communication plan as part of the overall project management plan.
Stakeholder attitudes can be positive and supportive or present challenges that can threaten the project. For example, the construction of a large shopping complex in an area thriving with native plants and animals has stakeholders who welcome the convenience of a supermarket. In contrast, others may strongly oppose the development due to environmental or other concerns.
Stakeholders in the construction of such a development may include:
- Investors
- Small business owners
- Neighbours
- Community groups
- Regulatory bodies
- General public
- Media
Stakeholder engagement and consultation increase the success of a project. Collaboration between the project management team and stakeholders ensures stakeholder input and expertise, identifies potential issues and manages stakeholder involvement and potential risks from stakeholder behaviour.
Consultation with stakeholders who are experts in different aspects of the project is critical for the project team’s work, especially in identifying quality objectives, standards and processes to use. In addition, stakeholder input is needed during each quality management phase. Key tasks that need stakeholder input include preparing, reviewing and approving key documentation such as the quality management plan (QMP) and quality control plan (QCP).

Depending on the organisation and size of the project, the project manager may be responsible for stakeholder engagement and communication. Or the project owner may hold this responsibility and liaise with the project manager to carry out engagement activities. Large and complex projects can involve several partner organisations with joint project owners. This is called a multiheaded client project.
The consultation process required between these stakeholder partners is complex, and this can cause substantial delays.
A project is most flexible in its early stages. Stakeholders may be aware of this and attempt to exert influence at this point. As the project progresses, it gains momentum, and stakeholder influence tends to reduce. Project managers need to continually track and manage stakeholder expectations until the project is completed to reduce the risk of last-minute objections and ensure the project’s success.
Watch
Stakeholder Engagement: Five-step Process by Online PM Courses - Mike Clayton (4:04):
Resource
Read 9 Types of Quality Management Stakeholders and How To Manage Them
This project-specific plan describes the activities, standards, tools and processes needed to achieve quality deliverables for that project.
Developing a QMP defines what quality means for a specific project. It describes the activities, standards, tools, procedures, processes, instructions and records needed to ensure the quality of work processes and the delivered product or service.
The benefits of having a QMP include:
- Increased customer satisfaction
- Fewer unknowns and less room for error because quality is present at every step
- An environment that encourages the team to create great results
- The team, and your organisation, have become known for quality and consistent output and are trusted to continue to do so
- Increased collaboration and review by team members because everyone works together to ensure project quality
Five possible results when there is no QMP:
- The project and deliverables may not meet the needs and expectations of the project owner, project sponsor, users, stakeholders and customers
- Taking immediate corrective action can be expensive
- Ensuring ongoing quality of deliverables may involve ongoing costs
- Communication with the project team, stakeholders, users and customers is more challenging because of the lack of clarity and different expectations
- Project team morale may suffer, leading to staffing issues
There are visible and less visible outcomes and costs of allowing poor quality over time. These are like an iceberg, with there being many less visible costs than those immediately visible, as illustrated below:

What is a Quality Management Plan?
is a component of the project management plan that describes how applicable policies, procedures, and guidelines will be implemented to achieve the quality objectives. It describes the activities and resources necessary for the project management team to achieve the quality objectives set for the project(PMBOK® Guide—6th Edition, Page 286).
The quality management plan
The contents of a QMP need to be tailored for the specific project. The plan should include only the necessary items and nothing more. It is important that stakeholders and all reviewers can read it easily and give input and approval as quickly as possible.
Content items may include:
- The approach being taken for quality management
- Details of the deliverables and the processes to be followed
- Applicable standards and industry or legal requirements
- How quality requirements will be defined for the deliverables and processes
- Risks identified related to quality and how quality issues will be resolved
- Quality management roles and responsibilities
- How and when work and process quality will be managed, for example, standards and requirements for deliverables and when reviews will be done for these standards
- How quality will be measured, metrics and measurements to be used, and the tolerances allowed
- Tools and techniques that will be used to manage quality
- How and when quality review and reporting will be carried out
- When and how quality will be controlled, for example, how the team will evaluate or test the deliverables
- Implementation checklist
- How defects will be prevented and corrected
- How quality improvement will be included
- Definitions specific to the project
The items in the QMP provide a blueprint and tools for quality assurance (QA) and quality control (QC) activities.
Watch
Quality management Plan by ELFH 341 Project Management (8:36):
Project Quality Plan Template Review by Victor Allen (5:35):
Who should develop the QMP?
Items in the QMP should be developed by stakeholder professionals with relevant skills, knowledge and experience for the project. For example:
- Project manager
- Quality manager
- Project team members
- Stakeholders from quality assurance, legal, operations etc.
- Stakeholders who are experts in areas related to the project
- Customer representatives
Because every project is different, gathering input from all relevant people is important. For example, the knowledge and experience needed to develop a QMP for a construction project are very different from what is needed for a software development, manufacturing or health services project.
Responsibility for communicating with participating stakeholders, gathering input and finalising the QMP usually rests with the project manager or quality manager. The QMP is presented for review and approval by key stakeholders, including the project sponsor or owner.
Steps to follow to create a QMP
Michael Luchen, from The Digital Project Manager, suggests following several steps when creating a QMP for a software development project. Some of these are more relevant for software projects:
- Create a shared understanding of what quality means for your project
- Divide up quality management responsibilities
- Write acceptance criteria
- Select an appropriate production management tool to support the possible automation of any processes
- For a technology-related project:
- Decide the specifications of user equipment and devices for running the software
- Carry out unit testing using coded tests written by the development team
- Set up a deployment pipeline to allow for additional quality checks for each user equipment/device platform when there are multi-devices
- Prepare a plan for a final test of pathways that users may take through the software 7
Resources
- How To Develop A Quality Management Plan, by Michael Luchen at the digital project manager
- How to Develop a Quality Management Plan, by Harry Hall at Project Risk Coach
- QMP template: Centres for Disease Control and Prevention
- Example QMP: California State Treasurer’s Office, Debt Management System project
Example
Too much resource, such as cotton for a clothing company, may mean too much money sitting in raw material stock, which means that cash flow is less than it should be and that bills cannot be paid on time. On the other hand, too little cotton may mean that orders cannot be made on time and that customers will be annoyed.
Quality metrics and requirements are used to test and measure the performance and value of products, services and processes. The right quality metrics help to translate customer needs into measurable goals and deliver customer satisfaction.
Quality metrics describe processes or project work quality that can be measured by looking for defects. The term quality requirements describe either the full suite of required documentation for a project or required statements or specifications for individual items.
Some common examples of quality metrics are:8
| Quality Metric | Description |
|---|---|
| Customer satisfaction | Customers’ experience with a product or service |
| Ratings | Rating of products and services by external rating systems |
| Failure rate | Probability of failure over a period of time |
| Mean time between failings | Period of time between software system being down |
| Quality of service | Technical measure of system or network service, e.g., error rate, transmission delay, bit rate etc. |
| Quality control | Testing or sampling of products or services, e.g., hotel randomly checks cleaning of rooms to meet a sample percentage |
| Defect rate | Number of defects in a batch or defects per 1000 lines of code |
Requirement metrics stipulate what is needed to meet a standard or requirement set by an external party. These vary depending on regulatory jurisdiction, industry and type of project. Examples include:
- Standards and legislation
- Materials and ingredients specifications
- Maintenance specifications
- Performance statements, e.g., responsiveness required for a user interface
Resources
- 7 Types of Quality Metrics, by John Spacey at Simplicable
- 11 Examples of Quality Requirements, by John Spacey at Simplicable
Selecting quality metrics
Selecting the most suitable metrics depends on understanding the project and the work involved. Consider the following when assessing the appropriateness of QA metrics for a project:
- Duration and timeliness of testing
- Actual cost and budget variance
- Standards and specific requirements for testing
- Data to be obtained from testing
- Total number of test cases required
- Number of actual test hours required
- Test design and test review efficiency
- Test team availability and expertise
Identifying the best metrics and correctly applying them is critical for any QA process. Metrics maintain focus, produce desired results and reduce risks throughout the project. In addition, data obtained from testing informs the quality manager on how to apply resources best.
Quality metrics provide information about:
- Overall equipment effectiveness (OEE): The percentage of efficient production time within the specified quality requirements
- Percentage of product compliance: The percentage of products that comply with internal guidelines and government regulations
- On-time and complete delivery: The percentage of complete products delivered on time, without any errors or delays
- New products introduction (NPI): The percentage of new products that are introduced within time, volume and quality targets
International Standards Organisation (ISO)
The International Standardisation Organisation (ISO) provides global standards used by over one million organisations in over 170 countries, including Australia. The ISO 9001 standards give the criteria for QMS to ensure that consistent, high-quality products and services are delivered to customers. Application and certification of the ISO 9001 standards benefit business processes and profitability. As ISO 9001 has global recognition, certification increases an organisation's credibility and international opportunities.
Measuring performance against quality standards guides production and determines if quality requirements are met. In addition, early identification of errors, and potential weaknesses, in a process or product reduces the risks and costs of poor quality.
Standards, limits and tolerances
Quality control standards, limits and tolerances provide the requirements for testing and analysis and are also included in the QMP. Tolerance ranges are mean values with a plus (+) or minus (-). Different measurement tools have different tolerances; the most appropriate measurement must be chosen for the project.
Documenting quality metrics
Details that should be documented for each quality metric include:
- The name of the metric
- The standard to be applied by using the metric
- Tolerances
- How often quality should be measured using that metric
- How and when the measuring should be reported
A table or spreadsheet can be used for this documentation. Here is an example of a project involving the production of a new range of boutique dresses:
| Metric | Standard | Frequency | Report |
|---|---|---|---|
| Fabric appearance | No broken threads or uneven weave visible to the naked eye | Inspect five garments from each dress type | Weekly quality management review (QMR) |
| Seam strength | All seams straight, with no visible ceasing or tension | As above | Weekly QMR |
| Material waste | Cut five garments from 1 roll of material | Inspect cut pieces and waste from each roll | Weekly QMR |
| Customer satisfaction | 8 out of 10 rating with no score below 7 | Ratings from launch advertising and aftersale reviews | Monthly QMR |
| Product defect rate | <1 per batch | Per production of 500 garments | Per batch |

Quality checklists and process improvement plans are developed as part of the quality management plan (QMP). The quality baseline is the final outcome of the quality planning phase.
Quality Checklists
Depending on the project, several different quality checklists may be required. These include quality inspection checklists and an overall planning checklist to confirm that everything needed for the QMP has been completed.
Quality inspection checklists are used for several purposes, including:
For suppliers: describing the quality standards and product requirements for third-party components and items
For the project team: describing criteria for quality inspections and reviews carried out in the quality assurance phase
These checklists may also be called quality control (QC) or quality assurance (QA) checklists. Quality control checklists may include a section stating the country or market of sale of a product and the regulations or standards that the product must meet.
Here is an example country of sale information on a QC checklist for a soft toy:
| Product Category | Market of Sale | Recommended Sampling /AQL Levels | Reference Documents |
|---|---|---|---|
| Plush Toy | US | GII; 0/2.5/4.0 | ASTM F963 |
In this example, ‘Reference Documents’ names compliance with ASTM F963, which is mandatory for all toy imports to the US under their Consumer Product Safety Improvement Act. Regulatory requirements differ by country. Therefore, separate checklists may be needed for different markets for the same product. It is useful for third-party component suppliers to know the relevant standard in the country where the finished product will be sold.
Reading
Include developing a quality control checklist
Download the quality checklist template for overall quality planning
Process Improvement Plan
A process improvement plan describes how a process needs improvement or revision. Identifying the changes needed to existing processes or new processes required is important for software systems implementation and job and process training projects. Process improvement analysis is also needed when there are issues with an existing process or to check for potential issues.
There are seven steps involved in process improvement planning, as outlined below:

| Step | Description |
|---|---|
| Map | Document the existing process or workflow using a flow chart or work breakdown structure (WBS) |
| Analyse | Use tools such as root cause analysis to:
|
| Redesign | Redesign process to improve it:
|
| Assign | Assign representatives of the most affected groups and:
|
| Implement |
|
| Communicate |
|
| Monitor |
|
Activities in PQM phase 2, quality assurance, include process analysis. A process improvement plan may be implemented after this analysis to carry out process changes as required. Process analysis is discussed in topic 3.4 of this learner resource.
Quality Baseline
The project or quality manager presents the finished quality management plan (QMP) and accompanying quality documentation to stakeholders, project sponsor or project owner. Their feedback is obtained, and updates are made to the documents as needed. The sponsor or project owner approves the final QMP and accompanying documents.
The approved QMP and all accompanying documents are collectively called the quality baseline. This approval confirms that the described quality requirements are complete and will be followed and delivered by the project.
Resource
Quality Baseline by Grist Project Management
A range of tools and techniques are used during the PQM phases. Some are used in more than one phase.
Techniques for gathering information
The following techniques are useful for gathering information in any phase, and especially in quality planning:
Captures unfiltered ideas and input for later analysis and decision making. Brainstorming allows others from diverse backgrounds and experiences to share their opinions. To begin the brainstorming process, present a problem and allow everyone to share their views. Explain to the group that no one can shut down ideas initially. In a group, generate a list of causes of a problem or solutions to a problem. The list can be created on a whiteboard or large paper that everyone can view. Evaluate the list and agree on the best ideas.
Analysing ideas by grouping characteristics or factors for and against each idea.
An enhancement of brainstorming to assist in ranking ideas. The group collects anonymous input from members and supports discussion of all input. Each member then prioritises the input items individually and is prioritised again by their cumulative score.
Useful tools in Quality Planning (QP)
QP tools and techniques include the following:
Cost-benefit analysis
A cost-benefit analysis is a tool that can be used to assess the benefits and costs of a proposed project or different actions. It can be used to make decisions about what action to take or to compare other options.
The first step in a cost-benefit analysis is to identify each option's costs and benefits. This can be done by looking at direct and indirect costs and benefits. Direct costs are easily quantifiable, such as the cost of materials or labour. Indirect costs are more difficult to quantify, but examples include the environmental impact of an action or the effect on people's health.
Once all costs and benefits have been identified, they need to be valued. This can be done using monetary values or assigning value to things that cannot be easily quantified.
The main benefit of using a cost-benefit analysis is that it provides an evidence-based approach to decision-making. It can help project managers and decision-makers weigh up different options and make informed decisions about which actions to undertake. This means that decisions are based on facts and data rather than hunches or gut feelings.
Steps to conduct a cost-benefit analysis
- Determine all potential costs associated with the project, including both monetary and non-monetary costs.
- Determine all of the potential benefits associated with the project or action to be taken. This includes both monetary and non-monetary benefits.
- Compare the costs and benefits to determine if the project or action is worth undertaking.
- Make sure to consider all relevant factors when conducting your analysis. This includes things like time frame, risks, and opportunity costs.
- Update your cost-benefit analysis as new information becomes available.
Cost of quality
The calculation of all expenses related to quality, including:
- Prevention costs
- Appraisal costs
- Failure costs:
- Internal: during production, including re-work, scrap
- External or non-conformance: after delivery, including repair, return and replacement
Useful tools in both QP and Quality Control (QC)
The following tools are useful for both QP and QC:
- Cause-and-effect diagrams, or Ishikawa diagrams (visual tools that illustrate the relationship between an outcome and its influencing factors), are diagrams that identify, sort and display the possible causes of a problem,
- Flowcharts document the logical steps in a process or components of a system. These help in identifying where quality problems may occur by developing ways of managing these and creating repeatable processes
- Check sheets: Used in data gathering to organise information. They are especially useful for inspections to focus on specific aspects that can contribute to potential or identified quality problems
- Pareto diagram: A graph representing defects' frequency and their cumulative impact with bars and line graphs. Descending values are represented with the bars, and the cumulative total by the line
- Histogram: A graph that represents data points into ranges or bins. These look like bar graphs but differ in the way data is represented
- Control chart: Also known as Shewhart charts, this is a graph that applies statistics to monitor the changes that occur in a process over a period
- Run chart: A line graph that plots data in a time sequence to identify trends or patterns in a process
- Scatter diagram: Also known as a scatter plot or graph, these correlate two data sets to determine the relationship between the two variables
- Benchmarking: The application of previous production results to inform quality improvement standards. These provide a reference point for each project
- Design of experiments: Also known as a test plan, this refers to the list of tests to be applied to assess the quality of a product
- Statistical sampling: Inspecting a few items and extrapolating the results to the whole production. The type of sampling, frequency or size of the sample should be documented in the quality management plan (QMP). There are two types:
- Attribute sampling: does a sample conform? For example, true/false, right/wrong, pass/fail etc.
- Variable sampling: what is the degree of conformity? For example, the weight of chickens or other food produced etc. 11
Useful tools in Quality Assurance (QA)
Tools and techniques used in QA include the following:
- Affinity diagrams: used to organise large numbers of ideas for review and analysis
- Process decision program charts (PDPC): used to identify the steps in reaching a goal and to analyse the individual steps to identify potential issues
- Interrelationship diagraphs: displays the cause and effect relationship between multiple variables, complex problems or desired outcomes
- Tree diagrams or systematic diagrams: used to break something down into smaller details
- Prioritisation metrics: used to rank the relative importance of ideas or issues
- Activity network diagrams: several types of schematic displays of a logical relationship or interdependencies, including PERT, CPM, ADM and PDM
- Matrix diagrams
- Quality audit: this is discussed in more detail in chapter 3
- Process analysis
As a project professional responsible for managing and leading a project, you should know how these techniques are carried out and feel comfortable using them. 11
Use tools to resolve quality issues

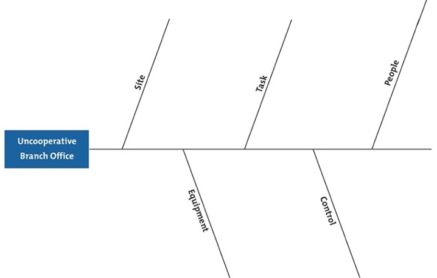
You can select any of the tools previously mentioned to help analyse the cause of issues and resolve quality issues. A recommended approach to identify the root cause is to use a cause and effect diagram which is illustrated using a fishbone diagram. The head of the fish shows the effect, and the fish bones show the causes or possible causes) that have contributed to the problem. This allows for the problem to be analysed to resolve issues.
Cause and effect diagrams are also commonly known as fishbone diagrams as it looks like a fishbone.
To create a cause and effect diagram, follow the four steps:
- Identify the problem
- Work out the significant factors involved
- Identify possible causes
- Analyse your diagram.
Identify the problem
Write down the problem. Be specific if you can and identify:
- What is the problem?
- Who is involved?
- When did it occur?
- Where does it occur?
Work out the major factors involved
Identify the factors that may be part of the problem, such as:
- Structure
- Systems
- Shared values
- Skills
- Staff
- Product
- Place
- Price
You can either do this on your own and then ask for feedback or work with your team to thoroughly understand the contributing factors to the problem.
|
Instructions to create a fishbone diagram:
|
 |
|
Identify possible causes For each possible cause of the problem, add shorter lines to elaborate on each of those causes. |
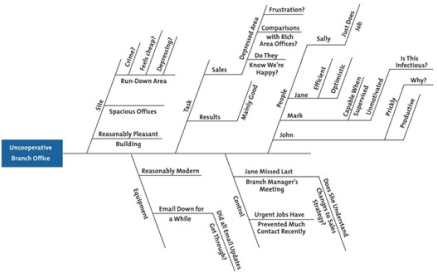 |
Source: Mindtools
Analyse your diagram
Review all of the possible causes of the problem identified in the diagram.
Resource
Read Global Knowledge Tools and techniques useful in quality planning assurance and control to see examples of the tools and techniques.
Validation and verification
The terms validation and verification, or V&V, can be confusing. They are both techniques used for QA and QC. Put simply:
- Validation confirms that the correct product has been created that meets customer needs
- Verification confirms that the product was produced correctly
Validation can involve testing by non-project team members, such as user testing or customer trials. The project team carries out verification.
Verification and validation in software testing
Validation answers the question, ‘Did I build what was needed?’ It tests how well the software meets the business needs for which the product was designed. Validation is called acceptance or business testing.
Verification answers the question, ‘Did I build what I said I would?’ It involves testing to ensure that the product meets the specifications and requirements defined for it.
Used together, V&V ensures that software delivers on its purpose and works as well as possible. As a result, V&V is central to methodologies such as Waterfall and Agile development processes. 12
Data validation and verification
Data validation involves checking if a piece of information or data falls within a defined range of values. For example, a computer user enters the name of their state in an address field. The program validates the entry against a list of state names. Validation happens when a record is created or updated, for example, a customer account or profile.
Data verification involves checking current data for accuracy and consistency. Verification is critical when data is migrated or merged. Data can be prepared for migration in several ways, including checking for duplications and ensuring that items such as names and addresses are up to date. Small errors in preparing data can cause large issues, such as mismatching names and addresses, so invoices are sent incorrectly. Verification is also used to ensure accuracy and consistency in corporate data over time. 13