Our ability to learn and get better at tasks through experience is part of being human, but did you know computers can do the same?
The study of using algorithms that enable a computer to predict a result without being explicitly taught is known as machine learning.
The more data the computer receives, the more finely tuned its algorithm becomes and the more accurate it can be in its future predictions.
Machine learning has granted computer systems entirely new abilities and is already widely applied in our everyday lives, including:
- Facial recognition
- Text and speech recognition
- Online viewing recommendations
- Disease detection
- Self-driving cars
- Virtual personal assistants
In this topic, we will delve into machine learning and the various approaches and techniques used, based on needs and specific objectives.
Computers are given the ability to learn using statistical techniques and algorithms without manual programming. Algorithms are used to build a model based on data to make predictions or decisions, improving their accuracy over time. This is based on the idea that systems can learn from analysing data, identify patterns, and make predictions with minimal human intervention.
Machine learning cycle
A mapping (function):
F: x <> y
X: observations (data), past experience
Y: prediction, new knowledge, new experience

Put simply, machine learning algorithms learn from past data to make predictions about future data. When new data is introduced, the machine learning algorithm uses what it has learned to make predictions about the future.
Machines can optimise their learnings using various approaches, allowing them to improve their algorithms and produce better results.
The machine learning cycle is continuous and choosing the correct machine learning algorithm is just one of the steps. The steps in the machine learning cycle are as follows:
Different machine learning algorithms are suitable for various data and business problems. Depending on the nature of the problem, different machine learning techniques may be required to improve the accuracy of predictive models. There are different ways to train machine learning algorithms, each with advantages and disadvantages. To understand how machine learning truly works, we must first look at the kind of data entered, labelled or unlabelled. This will then greatly influence the best machine learning model to deploy.
Labelled data is data that has been classified into categories. For example, a dataset of images of animals might be labelled as ‘cat’, ‘dog’, ‘bird’, etc. This data type requires human intervention to label the data and train the machine.
Unlabelled data is data that has not been classified into categories.

Machine learning model approaches can be split into the following categories:
- Supervised
- Unsupervised
- Reinforcement learning
Supervised learning
Just like the name, supervised learning Is a type of machine learning that observes, supervises, and provides direct guidance to the machine to ensure activities are done correctly. It feeds the machine with labelled data by telling them the input and exactly how the output must look. This allows the computer to learn the relationship between the two; once the model has learnt the relationship, it can be used to classify new and unseen datasets to predict outcomes.
An example may include creating a machine learning application that distinguishes one animal from another.

The figure above shows a dataset of images of dogs and cats, with the labels 'dog' and 'cat'.
The machine learning model would use previous data to predict the label of new data points. This means that if we bring in a new image without a label, the model would guess if the image is of a dog or a cat, thus predicting the label of the data point.
The result of the prediction is being supervised by humans, which will determine if the machine learning prediction is accurate or not. This is how supervised learning works.
Supervised machine learning is often used for:
- Classification (images, documents or written work)
- Regression (predicting house prices)
- Clustering (grouping data points together)Classification and Regression
There are two types of supervised learning
- Classification (defined labels)
- Regression (no labels defined)

When the label is continuous, it is a regression; when the data comes from a finite set of values, it is known as classification.
In essence, regression used for supervised learning helps you understand the correlation between variables.
An example of supervised learning is weather forecasting. The use of regression analysis in weather forecasting considers; known historical weather patterns and current conditions to predict the weather. The algorithms are trained using pre-processed examples. At this point, the performance of the algorithms is evaluated with test data.
Regression models: Continuous regression models predict a real value, such as the weight of an animal.
A regression can output any real value from a continuous interval, making them very versatile.
Classification model: This model predicts a state, such as whether an animal is a cat or a dog.
A classification model predicts a state, such as whether an animal is a cat or a dog. It reads some input and generates an output that classifies the input into some category. For example, a model might read an email and classify it as either spam or not — binary classification .
The output of a classification model is discrete since the prediction can be a value from a finite list. If there are more than two states, such as a model that predicts if a picture is of a dog, a cat, or a bird, it is still a discrete model. These models are called discrete multivariate models. Classifiers can have many states, but they must always be finite numbers.
Unsupervised learning
As covered in the previous subtopic, you are now familiar with supervised learning; this is having complete control over the data used to train the machine learning model. Both the inputs and outputs are known; inputs are predetermined, and the corresponding outputs need to match a certain model.
In contrast, unsupervised learning is where the machine learning model is given data with no labels or classifications. The model must learn from the data itself and try to find patterns.
Unsupervised learning is best suited when the problem requires analysing massive amount of unlabeled data. For example, using data extracted from social media applications like Twitter, Instagram and Snapchat.
Unsupervised learning algorithms segment data into groups of examples (clusters) or groups of features. The unlabeled data creates the parameter values and classification of the data. In essence, this process adds labels to the data to become supervised. Unsupervised learning can determine the outcome when there is massive data. In this case, the developer doesn’t know the context of the data being analysed, so labelling isn’t possible at this stage.
Therefore, unsupervised learning can be the first step before passing the data to a supervised learning process. Unsupervised learning algorithms can help businesses understand large volumes of new, unlabelled data. Similarly, in supervised learning, these algorithms look for patterns in the data; however, the difference is that the data is not already understood.
For example, in healthcare, collecting huge amounts of data about a specific disease can help practitioners gain insights into the patterns of symptoms and relate those to patient outcomes. It would take too much time to label all the data sources associated with a disease such as diabetes. Therefore, an unsupervised learning approach can help determine outcomes more quickly than a supervised learning approach.
The two main branches of unsupervised learning are clustering and dimensionality reduction. They are defined as follows.
Clustering and Dimensionality reduction
Clustering: The task of grouping our data into clusters based on similarity.

Dimensionality reduction: This is the task of simplifying our data and describing it with fewer features without losing many generalities.

Check out the following video to find out more information regarding the differences between supervised and unsupervised learning.
Reinforcement learning
Reinforcement learning is a behavioural learning model. The algorithm receives feedback from the data analysis, guiding the user to the best outcome. This type of learning differs from the supervised learning model because the system isn’t trained with the sample data set.
Rather, the system learns through trial and error. Therefore, a sequence of successful decisions will result in the process being “reinforced” because it best solves the problem.

One of the most common applications of reinforcement learning is in robotics or game playing.
Take the example of the need to train a mouse through a maze to get to the cheese. The robot changes its approach to navigating the terrain based on the outcome of its actions. When the mouse hits a wall, the data is recalibrated, so the steps are navigated differently until the robot is trained by trial and error to understand how to correctly work through the maze. In other words, the robot learns based on a successful sequence of actions.
Reinforcement learning is used in the context of self-driving cars, where it teaches the car how to navigate a road by trying different routes and receiving rewards for successful navigation.
Supervised vs unsupervised vs reinforcement
To summarise, below is a table that summarises the differences between the three learning models.
| Machine learning | |||
|---|---|---|---|
| Supervised learning | Labelled data | Classification
|
 |
| Unsupervised learning | Unlabelled data | Dimensionality
|
 |
| Reinforcement learning | Behavioural learning model | Gaming Finance sector Manufactorung Inventory Robot navigation |
 |
You need a plan and roadmap to successfully use machine learning to improve your business outcomes. You can't just hire a group of data scientists and hope that they'll be able to produce results for the business.
Once the business problems are identified and machine learning can correct these, you can then begin experimenting to find the most suitable model.
Define an opportunity for growth
Start with a problem that can be tied to a business outcome, an opportunity for possible growth.
Scenario:
A company has noticed that a once popular product is no longer selling well.
To grow the business, they want to understand how to optimise their products' packaging to increase future sales. They have data on customer preferences and needs, and by modeling this data, they hope to be able to predict the best set of options that will meet customers' changing needs. The selected pilot is also a marketing tool to demonstrate to the business that the company can anticipate customers' future requirements.
Conducting a pilot project
Be sure to explain the project's purpose and what type of data you will use. Good pilot projects are a small part of a larger problem you are trying to solve for the business. If the pilot is a success, you'll have already established the context for your objectives. Your following moves will be clearer, thanks to your newfound understanding.
You will learn from this pilot project, whether it is successful or not - in fact, you may learn even more from a failed pilot. You may discover things like:
- Customer buying patterns
- Products that are more or less popular
- Reasons contributed to the change
These new patterns that emerge from the data and predicting what this could mean for your business could help your growth and success strategy.
Evaluation
Once you have conducted your pilot project, learnt a few things, and seen patterns emerge about customers and their requirements, you can now distinguish how the results differ from how your business is conducted on a regular basis.
You can now evaluate the results and see whether certain assumptions about your customers and what they want to differ from the results presented in the pilot project.
This is a great example as you may be surprised that when you remove any form of bias, results may differ significantly from what you first thought the issue may be. One of the biggest mistakes that company leaders make is basing their decisions off of their own assumptions and biases. They often take the data they're given and interpret it through their own personal lens instead of looking at it objectively. This can lead to some major problems down the line.
This is one of the most important benefits machine learning can provide to a business. Being able to understand your business differently can allow for significant growth.
As you add new data sources, you will better understand what your customers want. This information can then be used to help your company make decisions that will improve revenue.
Next actions
Pilot projects offer many benefits as they begin to give you an understanding of how you can use machine learning and how analytics can help you better understand your business. With machine learning, it is beneficial to have more data sources to increase the accuracy of insights. Business leaders should be brought into the process to help with decision making and the more data is entered the more you will be able to learn about your business practices and customer patterns.
Determining learning model
When applying machine learning to a business problem, one of the most complex and crucial tasks is selecting the most appropriate model. This is the best starting point in the journey to making machine learning work in your best interest as well as making it an indispensable tool for predicting future business outcomes.
One of the most important tasks when selecting a model is to make sure that the model will perform well in the future when new data continues to be introduced. The selected algorithm has to be accurate with new data, otherwise overfitting may occur and may cause problems in the future.
When you select an algorithm, be sure that the data set being used is a representative sample of your information. Your pilot will be much more successful if your data set is a representative sample of the aspect of the business that you are focused on.
For example, you might be by choosing an algorithm through a sample data set, what you could do next is add a data set from a totally different source that could be helpful to your hypothesis. In this way you will be able to see the outcomes from both the well understood data set and a new data set.
Tools to determine algorithm
Selecting the algorithm that is best suited for your data is a challenge, luckily there are tools available to help assist with choosing the right algorithm for your business needs. You need to ensure the algorithm chosen does not lose accuracy over time by making sure you continuously re-train the model as the data changes.
Using an automation tool enables you to quickly determine the best combination of algorithms that will provide the highest score and the best fit for your data. Automation tools are important not just because of the complexity of the algorithms but also because you have to make sure that the algorithms you select to build your models will not impact data latency and data consistency.
Approaching tool selection
A variety of open-source tools are intended to help data scientists select the right algorithm. These tools are often tied directly to the language:
- Python
- R
- Java
There are many different machine learning algorithms that data scientists can use to solve problems. By experimenting with different algorithms, data scientists can improve the ability of models to predict outcomes and create models that will scale.
With machine learning, you have the opportunity to use the data generated by your business to anticipate business change and plan for the future. While it is clear that machine learning is a sophisticated set of technologies, it is only valuable when you find ways to tie technology to outcomes. Your business is not static; therefore, as you learn more and more from your data, you can be prepared for business change.
When looking to conduct machine learning, a learning system is needed in order to provide a structure and framework within which learning can take place. It also helps to ensure that learning is taking place effectively and efficiently.
Just like any program or system that you chose to use, if you want the design to work successfully then an efficient system needs to be in place.
There are many reasons to design a learning system. Some reasons include wanting to improve learning outcomes, make the learning process more efficient, or adapt the learning system to the specific needs of the business or organisation.
“A computer program is said to be learning from experience (E), with respect to some task (T). Thus, the performance measure (P) is the performance at task T, which is measured by P, and it improves with experience E.”

Experience:
- Housing prices
- customer transactions
- clickstream data
- images
Task:
- Predict prices
- segment customers
- optimise user flows
- categorise images
Performance:
- Accurate prices
- coherent groupings
- KPI lifts
- correctly sorted images
https://www.zldoty.com/what-is-machine-learning/2017-04-06-001-machine-learning-definition-etp-framework/
An example may include teaching a computer to play chess. A learning system will be created to ensure the computer can plays chess to win. In order for this to be successful the learning system has to work to meet this task.
The following video showcases the amazing ability of a trained computer to not only play chess but to also surpass the performance of a human brain and defeat the world’s chess champion player.
In order to design an effective learning system, steps need to be followed. These include:
- Choosing the training experience
- Choosing the target function f(x)
- Choosing a representation for the target function
- Choosing a function approximation algorithm
- Estimating training values
- Adjusting the weights
- The final design
Choosing a training experience
The training experience is a dataset of instances from which to learn. It provides inputs to the learning algorithm, and the algorithm outputs a model that can be used to make predictions. The quality of the training data affects the quality of the learned model. Thus, the training data should be chosen carefully and it should be relevant and representative of the real-world data that the model will be used on.
In choosing a training experience you will need to consider these 3 attributes:
- Type of feedback
- Degree
- Distribution of examples.
Type of feedback
Type of feedback needs to be provided to the algorithm based on the choices and performance of the machine. This can either be direct or indirect feedback.
With direct feedback, you get immediate feedback about your actions. With indirect feedback, you get a sequence of moves and the final outcome of the sequence of actions.
Degree
The second important attribute is known as degree, this indicates the degree of control the learner will have in the sequence of training.
Depending on the experience, constant feedback may be relied on about moves played or decisions made to support the machine learning experience, or the machine may propose a sequence of actions itself without constant feedback and may simply ask for help when needed.
Distribution of examples
The third attribute indicates how performance will be measured through a diverse set of training examples. The more experience a machine learning algorithm gets, the better it will perform. The algorithm gets experience by going through different cases and examples.
Choosing the target function f(x)
The next step in designing a learning experience, is to figure out what kind of knowledge the software will acquire, and how it will use this knowledge to improve performance. For example, this can be applied to a game of chess, when the player makes a move, the machine learning algorithm will then decide the number of possible moves that can be taken to achieve success. This can be shown in the Deep Blue beat G. Kasparov in Chess tournament in 1997 where the computer was able to calculate 200 million possible moves every second.
Choosing a representation for the target function
Once you have chosen the target function, it is now time to figure out exactly what knowledge will be needed and how it will be put to use. This works hand in hand with identifying the target function as once the machine algorithm identifies all possible moves, the representation for the target function will now identify which move will have the most success. This can be seen in the game chess, where the machine algorithm will identify out all moves which will provide the most success
Choosing a function approximation algorithm
Training data isn’t enough to execute the most efficient move, we need to choose a learning algorithm that can approximate the target function chosen.
The final design
The final design is created when the system goes from a number of examples, failures, and successes, to correct and incorrect decisions, and finally to what the next step will be.
The final design is comprised of four components
- The performance system: This solves the given performance task.
- Critic: This generates training examples by recording the history of moves and decisions.
- Generaliser: It provide a hypothesis that it has estimated to be the target function.
- Experiment Generator: A new problem is created for the system to further explore.
In machine learning, algorithms are used to automatically detect patterns in data and then use the detected patterns to make predictions or recommendations. Algorithms play a key role in machine learning by providing a set of instructions for how a machine should learn from data. Without algorithms, machine learning would not be possible.
There are a variety of algorithms used in machine learning, including:
- Decision tree
- Naïve bayes classification
- Clustering
- Linear regression
- Random forest
- KNN
Depending on the algorithm chosen, will determine whether they are trained with labelled data or trained unlabelled data. These can be categorised into supervised or unsupervised learning algorithms.
The following table provides an outline of the various algorithms that are either supervised or unsupervised.
| Supervised learning algorithms | Unsupervised learning algorithms are |
|---|---|
|
Trained using data that has been labelled by humans. They also take feedback in order to improve their predictions.
|
trained using data that has not been labelled. Unsupervised learning models do not take any feedback.
|
Some common reasons for using different algorithms include:
- To achieve different levels of accuracy or performance
- To solve different types of problems
- To work with different types of data
- To implement different types of models
Below is an illustration on the various tasks that unsupervised and supervised learning algorithms are used for:

Decision tree
Suppose that you want to plan a summer holiday in Mexico with your family; there are many questions that you need to factor in before you make the decision. Some questions you may ask yourself include;
- are there local beaches?
- are there resorts and restaurants close by?
Each of these questions will either have a YES or NO answer. These will all contribute to your final decision.
This is what you call a decision tree algorithm. All possibilities within this are shown using the branching method where the branches of the tree are the outcomes of the tests, and the decision is made after computing all of the attributes.
The initial node is called the root node the final nodes are called the leaf nodes, the rest of the nodes are called intermediate or internal nodes. The root and intermediate nodes represent the decisions while the leaf nodes represent the outcomes.
The following illustration represents what a decision tree is.

Looking at the example you will be able to see that:
- Each internal node represents an attribute for testing the incoming data
- Each leaf node represents a class label
- Once a tree has been learned, we can predict the label for a new instance by using its attributes to travel from the root down to its leaf
- The label of the leaf will be used to assign to the new instance.
The following is another example of a decision tree based on the weather.

The following is how the branching works to make the final decision.
(Outlook = Overcast, Temperature=Hot, Humidity= High, Wind= Weak) YES
(Outlook= Rain, Temperature=Mild, Humidity=High, Wind=Strong) NO
(Outlook= Sunny, Temperature=Hot, Humidity=High, Wind=Strong) NO
What is an ID3 Algorithm?
ID3, which stands for Iterative dichotomiser 3 is a machine learning algorithm that is used for classification tasks. The algorithm works by iteratively dividing the data into two or more groups at each step.
This approach is called the top-down greedy approach because we start from the top of the tree and at each iteration, we select the best feature to create a new node. The best feature is the one that maximizes the information gain.
At each node N, select a test attribute A which can help us best do classification for the data in N.
Generate a branch for each value of A, and then separate the data into its branches accordingly.
Grow the tree until:
- It classified correctly all the training data; or
- All the attributes are used.
Note: each attribute can only appear at most once in any path of the tree.
How to choose the test attributes
- At each node, how can we choose a set of test attributes?
- These attributes should be discriminative, i.e can help us classify well the data inside that node.
- How to know an attribute to be discriminative?
- Assuming two classes in the data which of A1 one and A2 should be selected as the test attribute?

What is Entropy and information gain?
Creating a decision tree using entropy and information gain ensures that the optimal attribute delivers the most information gain or the lowest entropy.
The formula for Information Gain:
Information Gain= Entropy(S)- [(Weighted Avg) *Entropy(each feature)
The formula for Entropy:
Entropy(s)= -P(yes)log2 P(yes)- P(no) log2 P(no)
Meanings of entropy in information theory:
- Entropy shows the number of bits on average to encode a class of S.
- Entropy of a message measures the average amount of information contained in that message.
- Entropy of a random variable X measures the unpredictability of X.
Example
- S consists of 14 examples for which 9 belong to class C1 and five belong to class C2.
- So the entropy of S is:
Entropy(S)
= -(9/14).log2(9/14) -(5/14).log2(5/14)
≈ 0.94
Steps in ID3 algorithm
- Calculate entropy for dataset.
- For each attribute/feature.
- Calculate entropy for all its categorical values.
- Calculate information gain for the feature.
- Find the feature with maximum information gain.
- Repeat it until we get the desired tree.
To see a step-by-step application on how ID3 works, click here.
Naïve bayes classification
Naïve Bayes is a powerful machine learning algorithm that is both simple and fast. It is also accurate and reliable.
Naive Bayes uses the Bayes Theorem to predict the probability of a given event and finding a probability when we know certain other probabilities. It is a popular algorithm for a variety of classification tasks, such as text classification and spam filtering.
The formula is as follows,

- Probability of B occurring given evidence A has already occurred
- probability of A occurring
- probability of A occurring given evidence B has already occurred
- probability of B occurring
Clustering
Cluster algorithms fall into the unsupervised category of learning, which involves automatically identifying natural grouping in data. Clustering algorithms are able to only interpret the input data and with this information data points are classified into specific groups.

This is particularly useful when we have a lot of data points and we want to see if there are any patterns or groups in the data. Clustering can also be used to find outlier data points.
There are many different types of clustering algorithms. Some of which include:
- Hierarchical clustering
- K-means clustering
- K-NN (k nearest neighbours)
Hierarchical clustering
Hierarchical clustering is an algorithm that groups similar objects into groups called clusters. The endpoint of hierarchical clustering is a set of clusters, where each cluster is distinct from each other, and the objects within each cluster are broadly similar to each other.
Hierarchical clustering starts by treating each observation as a separate cluster. The algorithm then looks at the two clusters that are closest together and merges them into a single cluster. This process continues until all of the clusters are merged into a single cluster. See the following illustrated below.

The output of the hierarchical clustering is called a dendrogram, which will show the relationship between the clusters.

some areas in which hierarchical clustering is used includes:
- Document analysis
- Marketing
- Identifying fraudulent activities
- Network traffic
- Spam filters
K-means clustering
K-Means performs the distribution of objects into clusters that share similarities and are dissimilar to the objects belonging to another cluster.
The term ‘K’ in K-means clustering is a number. You need to tell the system how many clusters you need to create. For example, K = 5
For a better understanding of k-means, let's take an example from soccer. Imagine you received data on a lot of soccer players from all over the world, which gives information on the goals scored by the strikers and the goals saved by the goalies in the last five matches. Based on this information, we need to group the data into two clusters, namely strikers and goalies.
The following steps will guide you in how to create K clusters.
Assign data points
Here, we have our data set plotted on ‘x’ and ‘y’ coordinates. The information on the y-axis is about the runs scored, and on the x-axis about the wickets taken by the players.
If we plot the data, this is how it would look. Example in this link.
K- Nearest Neighbours Algorithm (KNN)
The KNN algorithm presumes that similar objects exist nearby. In other words, similar objects are close together.
The K Nearest Neighbours Algorithm categorises data points based on a similar measure, such as the distance function. Then, for each new data point, a forecast is formed by scanning the complete data set for the K most similar examples (the neighbours) and summarising the output variable for these K instances.

Assume we have an image of an animal that resembles a cat or a dog and we want to know which one it is, to find this out, we may utilise the KNN method for this identification. Our KNN model will look for similarities between the new data set and the photographs of cats and dogs and place it in either category depending on the most similar attributes. Examples in this link.

Linear regression
Linear regression is perhaps one of the most well-known and well understood algorithms in statistics and machine learning. Despite its simplicity, it can be used to solve a wide range of problems. We will take a look at what linear regression is, how it works, and how it can be used to solve various problems.
Linear regression is a linear model, e.g., a model that assumes a linear relationship between the input variables (x) and the single output variable (y).
The method of linear regression is used to predict the value of a dependent variable based on the value of one or more independent variables. When there is only one independent variable, the method is referred to as simple linear regression. When there are multiple independent variables, the method is referred to as multiple linear regression. Example in this link.
Random forest
The Random Forests Algorithm is an improvement on the Decision Trees Algorithm that addresses the issue of decreased accuracy when the number of decisions in the tree increases. The Random Forests Algorithm works by creating multiple decision trees that represent various statistical probabilities. These trees are then mapped to a single tree, known as the CART model. The final prediction is obtained by polling the results of all the decision trees.
The following diagram illustrates the difference between the single decision tree and the random forest algorithm.

When it comes time to split a node in a normal decision tree, we analyse every candidate feature and choose the one that creates the greatest gap between the observations in the left node and those in the right node.
In contrast, in a random forest, each tree can only choose from a random subset of features. This causes even more variety across the trees in the model, resulting in weaker correlation among trees and greater diversity.
Deep learning
Deep learning is a type of machine learning that uses artificial neural networks to perform sophisticated computations on large amounts of data. It is inspired by the structure and function of the human brain. Deep learning algorithms train machines by learning from examples. Many industries use deep learning, such as health care, eCommerce, entertainment, and advertising.
Artificial Neural Network (ANN) is structured like the human brain and consists of artificial neurons, also known as nodes. These nodes are stacked next to each other in three layers:
- The input layer
- The hidden layer(s)
- The output layer
The input layer is where the data enters the neural network. The hidden layer(s) are where the data is processed. The output layer is where the results are produced.

Y = f(g(b)) where X = g(b)
Data gives information to each node in the form of inputs. The node multiplies the inputs by random weights, computes them, and adds a bias to the results. Finally, to decide which neurone to fire, nonlinear functions, also called as activation functions, are used.
How do deep learning algorithms work?
While deep learning algorithms use self-learning representations, they rely on ANNs to compute information in the same way that the brain does. During the training phase, algorithms extract features, categorise objects, and uncover meaningful data patterns by using unknown elements in the input distribution. This happens at numerous levels, much like training machines for self-learning, with the algorithms used to generate the models.
The following diagram provides an insight into how deep learning is a subset of machine learning and how machine learning is a subset of artificial intelligence.

- Artificial intelligence: mimicking the intelligence or behavioural pattern of humans or any other living entity
- Machine learning: a technique by which a computer can 'learn' from data, without using a complex set of different rules. This approach is mainly based on training a model from datasets.
- Deep learning: a technique to perform machine learning inspired by our brain's own network of neurons.
Deep learning models employ a variety of algorithms. While no network is flawless, there are different algorithms suited to accomplish specific jobs. To select the best ones, it is necessary to have a thorough understanding of all key algorithms.
The following is a list of commonly used deep learning algorithms
- Convolutional Neural Networks (CNNs)
- Recurrent Neural Networks (RNNs)
- Self-Organising Maps (SOMs)
- Long Short-Term Memory Networks (LSTMs)
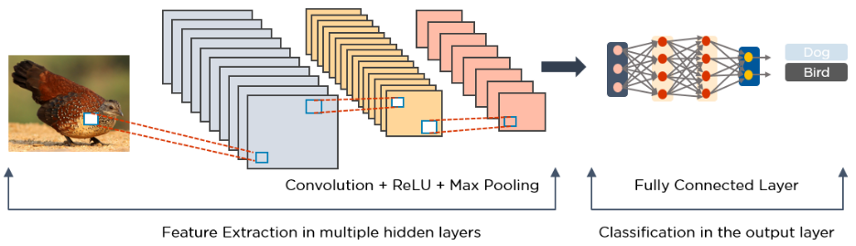
Convolutional Neural Networks (CNNs)
Convolutional Neural Network is a Deep Learning method that can take in an image as input, assign importance (learnable weights and biases) to various aspects/objects in the image, and distinguish one from the other. CNNs extract information from data and are mainly used for:
- Image processing
- Object detection
- Satellite images
- Processing medical images
- Forecast time series and,
- Detect anomalies.
They consist mainly of multiple layers and filters that perform a convolution operation.
The following is a diagram that demonstrates an image that was processed through Convolution Neural Networks.
As demonstrated, you can see a ReLU layer which is used to perform operations on elements and the output becomes a rectified feature map. The rectified feature map will then feed into a pooling layer which is a down sampling operation that reduces the dimensions of the feature map. Once converted it creates two dimensional arrays from the pooled feature map into a flat continuous, long, and single linear vector. Once complete a fully connected layer forms which identifies the images.
Referring to the image below, the extraction of data is used to identify the bird in the image.
Recurrent Neural Networks (RNNs)
A recurrent neural network (RNN) is a form of artificial neural network that works with time series or sequential data. These deep learning algorithms are commonly used for ordinal or temporal problems, such as:
- Language translation
- Natural language processing
- Speech/ handwriting recognition
- Image captioning
- Machine translation
You can find them incorporated into applications such as Siri, voice search, and Google Translate.
The following diagram demonstrates how RNN’s work

As illustrated above you can see that t1 input feeds into t and t feeds input into t+1 and so on. They are characterized by their "memory," which allows them to impact the current input and output by using information from previous inputs. While typical deep neural networks presume that inputs and outputs are independent of one another, the output of recurrent neural networks is dependent on the sequence's prior parts.
Long short-term Memory Networks (LSTMs)
LSTMs are Recurrent Neural Network (RNN) types that can learn and remember long-term dependencies. The default behaviour is to recall past information for extended periods of time. Over time, LSTMs retain information. Because they remember prior inputs, they are valuable in time-series prediction. LSTMs have a chain-like structure with four interacting layers that communicate in a distinct manner. LSTMs are commonly employed for:
- Speech recognition
- music creation
- pharmaceutical research
- time-series predictions.
The following diagram demonstrates how LSTM’s work
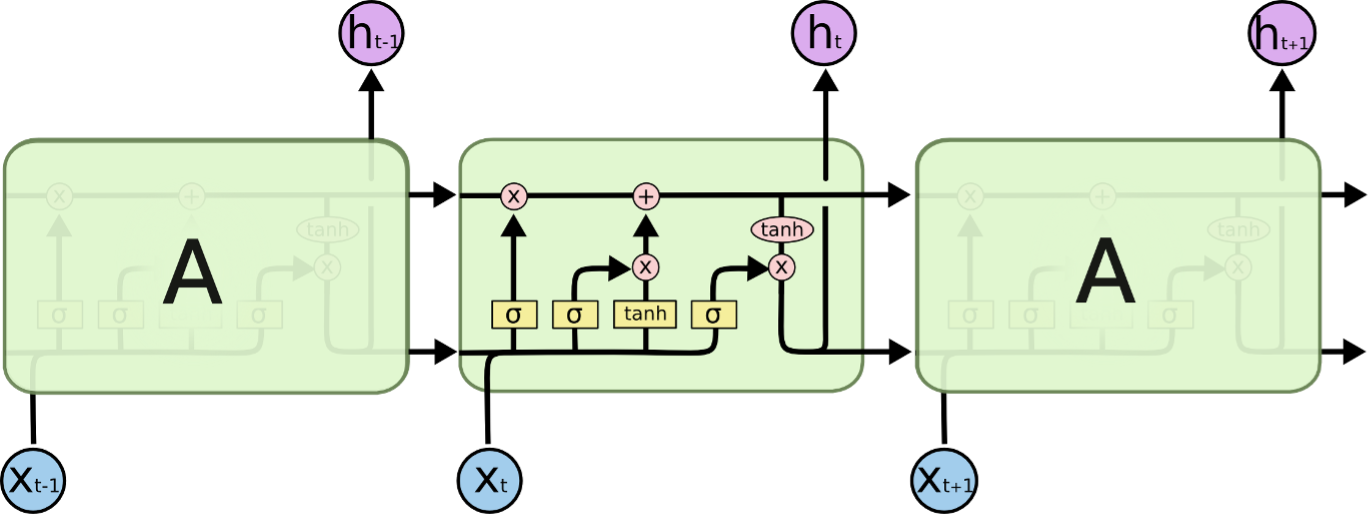
LSTMs feature a chain-like structure, but the repeating module is distinct. Instead of a single neural network layer, there are four that interact in a unique way.
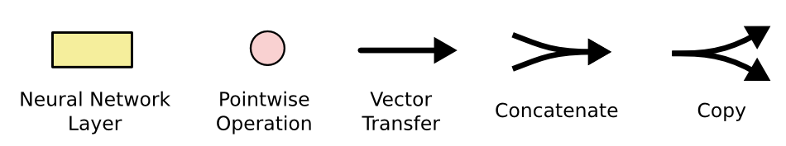
- Each line in the diagram above transports a full vector from one node's output to the inputs of others.
- The Pink circles represent pointwise operations such as vector addition
- The yellow boxes represent trained neural network layers
- Lines that merge suggest concatenation
- Lines that fork denote their content being copied and the copies being sent to distinct destinations.
Self-Organising Maps (SOMs)
SOMs is an unsupervised learning approach that combines clustering and mapping algorithms to transfer multidimensional data onto lower-dimensional data sets, allowing people to simplify difficult situations for easier interpretation.
The following is a diagram that illustrates how self-organising maps work.


| Welcome to Machine Learning for Data Science Projects | |
|---|---|
| Total Tasks: | 4 Modules |
| Description: | Explore advanced skills application in the field of Data Science by role-playing critical roles in a data science team using the latest AI tools for analytics/automation to address real problems. |
| Total Time Budget: | 20 hour |
Time budget: 20 hour
Access Task 1: Machine Learning for Data Science Projects