When it comes to documenting your budgets and projections depending on the software that your company is using will determine what data and documentation needs you may require. Let's look at a few options you could consider.
Creating a Budget in MYOB Business
MYOB business allows you to create a budget by importing figures from another budget in MYOB or by importing actual figures. You can also duplicate a budget to copy another budget's settings and filters, as well as its figures. Once you've imported or duplicated a budget, you can edit it to your requirements.
If you don't have budget data to import, you can create a budget by entering amounts manually. There are a number of handy features that help you do this faster.
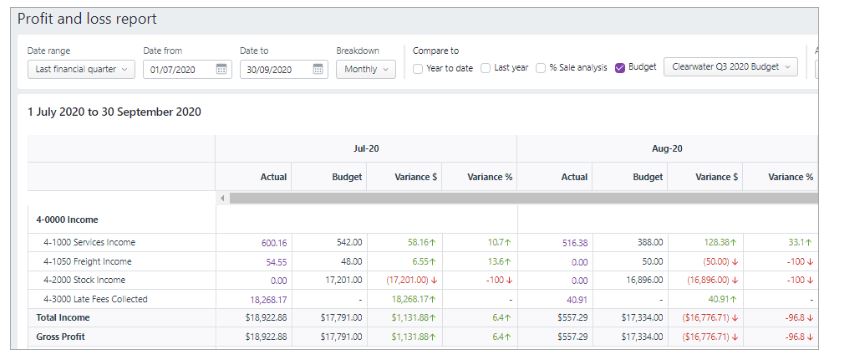
The Profit and loss report enables you to compare your budget and your actual figures side by side in a table or graph format. You can quickly identify the areas that need your attention, with the variance shown as dollar and percentage amounts. You can also review the Profit & loss report as a bar graph or a line graph and export the information.
MYOB also has a great resource on How to Make a Business Budget.
Creating a Budget in Xero
Xero has a budget manager feature that allows you to set up an Overall Budget for your business and use worksheets to create additional budgets.
Similar to MYOB, there are two ways to create a budget in Xero:
- Manually
- Importing data
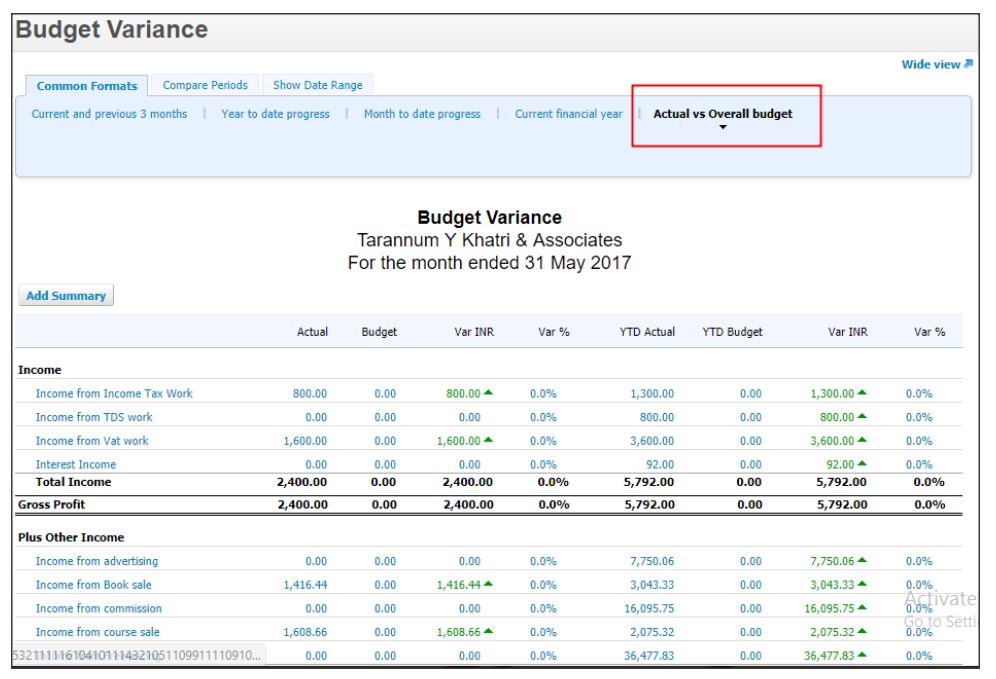
The Budget Variance Report lets you compare your actual revenue and expenses with budgeted amounts.
The standard report includes variance columns, which highlight the difference between one amount and another. The arrow icons show whether the variance is an increase (up arrow) or decrease (down arrow) and whether it’s favourable (green) or unfavourable (red).
You need the adviser, standard + reports or read-only user role to access the report.
To learn more about creating a budget in Xero, access Xero Support.
Creating a Budget in Excel
Many organisations, businesses, and non-profits use Microsoft Excel for their budgeting. Excel offers them flexibility, familiarity, and ease of compiling, sorting, managing, and analysing data for budgeting and forecasting.
In the following 25-minute video, Eric Andrews explains how you can build a monthly budgeting model using Excel.
The following 3-minute video explains different ways to present data:
Data in its raw form can be hard to interpret and read. It can also be hard for managers/stakeholders to make decisions if they do not understand the information they are being presented with. Data for preparing budgets needs to be presented in a format that is easily understood and appropriate for the stakeholders' needs. This is an integral part of communicating financial information, specifically budgeting and forecasting.
The formatting of a budget is the “look and feel” of that budget. Sources of that data may include:
- Cash flow projections
- Fixed costs
- Variable costs
- Sales records and projections
When it comes to presenting financial data, the method and quality of the presentation are just as important as the data itself.
Ways you can present your data include:
Infographics
Infographics are a popular way to present financial data in a visually appealing way. They use graphics, charts, and other visual elements to communicate complex information quickly and clearly. Infographics can be used to show trends, comparisons, and other data points, making them an effective tool for presenting financial information.

Data visualisation
Data visualisation is another powerful method for presenting financial data. It involves using charts, graphs, and other visual aids to help viewers understand complex data. With data visualisation, you can highlight trends and patterns in financial data, making it easier for non-financial stakeholders to grasp important insights.
Storytelling
Storytelling is a powerful method for presenting financial data in a way that engages and resonates with your audience. By telling a story that connects the data to a real-world scenario, you can help your audience understand the significance and relevance of financial information.
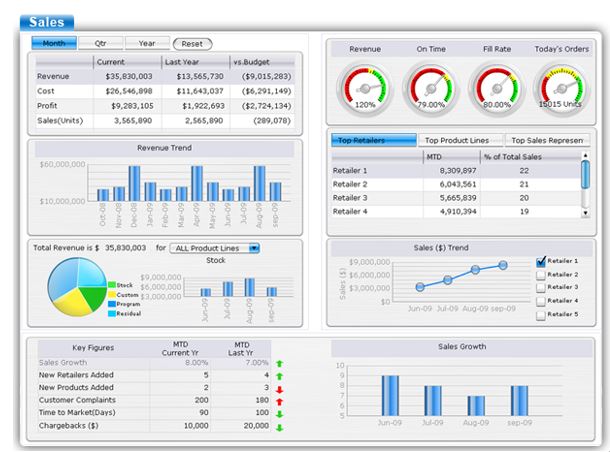
Dashboards
Dashboards are a great way to present financial data in a dynamic and interactive way. They allow users to see data in real-time, drill down into specific details, and explore the information in a way that is personalized to their needs. Dashboards can be customised to show the most relevant data points and metrics, making them an effective tool for presenting financial information.
Presentations
Traditional presentations are still a valuable way to present financial data. When done effectively, presentations can be engaging, informative, and visually appealing. By using clear language, charts, and graphs, you can help your audience understand the key points of your financial data and why they are important.
There are several ways to make financial data more visually appealing:
Use graphs and charts
Graphs and charts are a great way to present data in a visual and easy-to-understand format. Use them to illustrate trends, comparisons, and other important information.
Choose the right colours
The colours you use can have a big impact on how your data is perceived. Choose colours that are easy on the eyes and that help highlight the most important information.
Use infographics
Infographics are a great way to present complex data in an engaging and easy-to-understand way. They can be used to illustrate financial data in a way that is both visually appealing and informative.
Incorporate images
Incorporating images into your financial data can help to make it more engaging and interesting. Use relevant images to help illustrate your points and to break up the text.

Simplify your data
One of the best ways to make financial data more visually appealing is to simplify it. Use simple charts and graphs, and avoid using too much text. Focus on the most important information and present it in a way that is easy to understand.
The following 8-minute video discusses ways of using data visualisation to transform dry reports.

Planning Is The Key to Business Success
There are, of course, many benefits to planning in a business setting. Depending on the nature of the budget-setting process of an organisation, it is usual to establish budgets on an annual basis. This annual budget is then, naturally, segmented into months. The monthly budget periods, however, do not simply divide the annual figures by the number of months in the year, although that is the method used by some businesses to divide their budget allocations and estimates across the year. By reviewing the financial year in detail, trends of busy periods and slow periods become apparent, and through the use of this information, a business can anticipate these occurrences and manage its finances accordingly.
These periods are identified as critical dates by the business. An example might be if a big shopping event is coming up, which may indicate that the business should invest in extra stock in anticipation of a higher volume of sales. Another example might be tax time for accountants and tax agents or whether there are periods in the year that people get married, requiring more resources (time) for celebrants, accountants and tax agents.
Some retail-specific critical dates include:
- Black Friday: An American tradition adopted around the world, this is the Friday after Thanksgiving, and participating stores slash the prices of their items online and in-store, leading to an annual shopping frenzy that often lasts the whole weekend.
- End-of-financial-year sales (EOFYS): The time of year when retail businesses sell off current stock before new stock arrives (around the month of June).
- Boxing Day Sales: Boxing Day sales are hugely popular and are part of the January sales, where customers flock to buy discounted items after Christmas.
- General sale times:
- seasonal clothing changes
- newly
- released items
- store
- specific events.
Other types of critical dates might include:
- Contract critical dates: For example, the commencement of a new supplier contract or the date on which contracts with existing suppliers might need to be negotiated.
- Financial critical dates: This would include the required timeframes for monthly reports, budget preparation, and annual financial reports.
- Operational critical dates: For example, the implementation of a new software with a go-live date.
The most common time for businesses to start to look at next year’s budget is April, although depending on the size of the organisation the actual process may start well before this.
Forecasting
The aim of the forecasting process is to produce an estimate of the quantities and values of all the products or services that a firm is expected to produce and/or sell in a future period.
The process may be based on:
- Market potential - The maximum possible sales under ideal conditions if all avenues are pursued.
- Sales forecast - The number of sales estimated under the specific marketing plan of the firm, given the firm’s production capacity.
The forecasting process may be both costly and time-consuming, and organisations need to balance the cost of generating forecasts against the need to obtain more accurate results.
Methods to develop sales forecasts can be categorised into qualitative and quantitative factors.
Qualitative Methods

Qualitative methods of forecasting are based on subjective judgment, opinion and the experience of staff and managers and include:
- Sales-force composite: A composite of the estimates of individual sales staff that base their estimates on feedback from major clients and/or their own experience and judgment. Regional managers combine district forecasts and forward them to the head office.
- Delphi technique: Alternative method of obtaining a consensus opinion of experts achieved through a series of questionnaires rather than face-to-face meetings. In this method, a panel of experts is interrogated by a sequence of questionnaires in which the responses to one questionnaire are used to produce the next questionnaire. Any set of information available to some experts and not others is thus passed on to others, enabling all the experts to have access to all the information for forecasting. This technique eliminates the bandwagon effect of the majority opinion.
- Market research: The systematic, formal, and conscious procedure for evolving and testing a hypothesis about real markets. Existing and potential customers are surveyed to find out the type of products they intend to buy and in what quantities.
- Time-series approaches: Statistical techniques are applied to historical sales data in order to predict the trend of sales for the coming period using the least squares method.
- Panel consensus: The technique is based on the assumption that several experts can arrive at a better forecast than one person. There is no secrecy, and communication is encouraged. The forecasts are sometimes influenced by social factors and may not reflect a true consensus.
- Visionary forecast: A prophecy that uses personal insights, judgment, and when possible, facts about different scenarios of the future. It is characterised by subjective guesswork and imagination; in general, the methods used are non-scientific.
- Historical analogy: This is a comparative analysis of the introduction and growth of similar new products that bases the forecast on similarity patterns.
An example of a budget prepared for a small regional retail store using qualitative methods is illustrated below. A national forecast can be prepared by having each state manager review the sales for the previous three (3) years and sending through estimates to the national manager of projected sales for the following year:
| Product | Vic | Tas | NSW | ACT | Qld | NT | WA | SA | National |
| $ | $ | $ | $ | $ | $ | $ | $ | $ | |
| Clothing | 300,000 |
250,000 |
650,000 |
300,000 | 450,000 | 250,000 | 400,000 | 350,000 | 2,950,000 |
Quantitative method
Quantitative methods involve the use of mathematical modelling, which can be produced by specialised computer software or spreadsheets. This method is appropriate if market forces are relatively stable and sales patterns and trends are not likely to change in the future.
Quantitative methods include:
- Time-series approaches: Statistical techniques are applied to historical sales data in order to predict the trend of sales for the coming period using the least squares method.
- Casual or relational models: Based on cause and effect with the assumption that if key causal variables are known, sales levels can be forecasted. Casual models use linear regression and correlation.
- Moving average approaches: Each point of a moving average of a time series is the arithmetic or weighted average of a number of consecutive points of the series, where the number of data points is chosen so that the effects of seasonals or irregularities or both are eliminated.
- Exponential smoothing: This technique is similar to the moving average, except that more recent data points are given more weight. Descriptively, the new forecast is equal to the old one plus some proportion of the past forecasting error. Adaptive forecasting is somewhat the same, except that seasonals are also computed.
An example of the quantitative method is predicting sales for a small retail outlet for 2023.
| A | B | |
|---|---|---|
| 1 | 350,000 | 2019 |
| 2 | 384,000 | 2020 |
| 3 | 401,000 | 2021 |
| 4 | 410,000 | 2022 |
| 5 | 2023 |
Using the MS Excel statistical function ‘Trend,’ sales can be predicted for the year 2023. Create the table above in an Excel spreadsheet and insert the data into cells A1 through B5 as above.
In a separate cell, create the following formula and press ‘Enter’:
=TREND(A1:A4,B1:B4,B5:B6,TRUE)
Sales for 2023 are predicted to be $435,500.
The formula can be modified to include further years and figures as required.
Flexible Budgets
Budgets are based on many assumptions and are estimates of what is likely or may happen in order to achieve the organisation’s goals. A static budget will only predict one level of activity. Flexible budgets are created to include more than one level of activity.
Fixed and Variable Costs
In order to prepare flexible budgets, fixed, variable and semi-variable costs must be categorised. Fixed costs will stay constant in total during the budget period even if the level of activity changes. These expenses include building insurance, rent and depreciation. Variable costs will change in accordance with changes in activity levels, e.g. production, sales, commission and raw materials.
Fixed Costs
Fixed costs are those that remain constant during the budget period and are independent of activity changes, particularly in the short term.
Example:
A factory’s annual rent is $100,000, over which time 10,000 units are produced. The cost per unit is $100,000/(10,000 ) = $10. If annual rent remains the same, but 12,500 units are produced, the cost per unit is $100,000/12,500 = $8. However, if sales and production increase, more buildings and storage space may be required, and fixed costs may change over time.
Variable costs
Variable costs are those costs that change in accordance with changes in activity levels, such as sales or production. Variable costs include raw materials, direct labour and commission.
Example:
Raw materials are budgeted at $20,000 to produce 5,000 units. If 10,000 units are produced, these costs will escalate to $40,000. Note, however, that the cost of the unit remains the same, e.g. $20,000/5,000 = $4; $40,000/10,000 = $4.
Minor changes may occur where large volumes of raw materials can be purchased at a discount.
Semi-variable costs
Semi-variable costs are those that include a fixed component and a variable component. An example of a semi-variable cost is telephone costs, e.g. the fixed charge for the phone connection or line rental remains the same, but the total cost for calls will vary.
When all costs are categorised into fixed and variable, a formula can be used to determine the total costs and variable costs per unit, as follows:
Total costs = Fixed costs + (variable costs per activity unit × total activity units)
Variable cost per activity = (Total variable costs of production)/(Number of units of production)
Example:
Fixed costs of production are $80,000; the number of units produced is 10,000; and variable costs are $6.50 per unit:
Total costs: $80,000+($6.50×10,000)=$145,000
The same equation can be used to include manufacturing costs.
Example:
Fixed costs are $80,000; direct materials = $20; direct labour = $15; variable costs are $6.50 per unit; number of units produced is 10,000:
Total costs: $80,000+($41.50×10,000)=$495,000
If 15,000 units were produced:
Total costs: $80,000+($41.50×15,000)=$702,500
This will result in an increase of $207,500. This amount represents the total variable costs for producing the extra 5,000 units, e.g.:
5,000×$41.50 = $207,500.
Contribution Margin
The contribution margin is the difference between sales revenue and the variable costs to produce and sell the product. The contribution margin may also be referred to as the ‘marginal contribution’ as the variable costs are marginal costs, e.g. each additional unit produced and sold incurs additional marginal costs.
The format for an income statement showing the contribution margin for a static budget is set out as follows:
| Sales | $XX |
| Less variable costs | $XX |
| Contribution margin | $XX |
| Less fixed expenses | $XX |
| Net profit | $XX |
The format for an income statement showing the contribution margin for a flexible budget using the following variable costs per unit is illustrated below:
| Variable Costs per Unit | |
|---|---|
| Direct material | $45 |
| Direct labour | $20 |
| Factory overhead | $12 |
| Operating expenses | $18 |
| Total variable cost | $95 |
The variable cost per unit is the same for each level of activity, e.g.: $95 = $475,000/5,000
| 5,000 units $ | 6,000 units $ | 7,000 units $ | ||||
|---|---|---|---|---|---|---|
| Sales revenue | 750,000 | 900,000 | 1,050,000 | |||
| Less variable costs | ||||||
| Direct materials | 225,000 | 270,000 | 315,000 | |||
| Direct labour | 100,000 | 120,000 | 140,000 | |||
| Variable factory overhead | 60,000 | 72,000 | 84,000 | |||
| Variable operating expenses | 90,000 | 108,000 | 126,000 | |||
| Total variable cost | 475,000 | 570,000 | 665,000 | |||
| Contribution margin | 275,000 | 330,000 | 385,000 | |||
| Less fixed costs | ||||||
| Fixed factory overhead | 75,000 | 75,000 | 75,000 | |||
| Fixed operating expenses | 50,000 | 50,000 | 50,000 | |||
| Total fixed costs | 125,000 | 125,000 | 125,000 | |||
| Net profit | 150,000 | 150,000 | 150,000 | |||

There are two (2) main causes for variances between the original budget and the actual results:
- The volume of activity is different.
- Dollar amounts of income and expenses are different.
Variances can either be favourable or unfavourable.

Example
A firm of accountants produces the following performance report information for the quarter ended 31 March.
| Master Budget $ | Actual Results $ | Variance $ | |
|---|---|---|---|
| Fees received | 80,000 | 91,500 | 11,500 F |
| Salaries variable per hour | 38,000 | 40,000 | 2,000 U |
| Motor vehicle expenses – fixed | 600 | 750 | 150 U |
| Motor vehicle expenses – variable | 700 | 720 | 20 U |
| Advertising – fixed | 1,500 | 1,400 | 100 F |
| Advertising – variable | 2,200 | 2,500 | 300 U |
| Office expenses – fixed | 22,000 | 24,000 | 2,000 U |
| Total expenses | 65,000 | 69,370 | 4.370 U |
| Net profit | 15,000 | 22,130 | 7,130 F |
This report shows a favourable variance of $7,130 due to increased fees which have been offset by an increase in expenditure in some cases. The budget needs to be reworked to show what the expenses should have been based on actual results, e.g. the income of $91,500.
The variable expenses are calculated as a proportion of total fees received (based on a flexible budget approach). The budgeted variable costs based on actual total fees received are calculated as follows:
Variable costs ÷ total budgeted fees x total actual fees received
Salaries paid = $38,000 ÷ $80,000 x $91,500 = $43,463
Motor vehicle expenses = $600 ÷ $80,000 x $91,500 = $686
Advertising expenses = $2,200 ÷ $80,000 x $91,500 = $2,156
The reworked performance report for the quarter ended 31 March is as follows:
| Master Budget $ | Activity Volume Variance $ | Flexible Budget | Actual Results $ | Flexible Budget Variance | |
|---|---|---|---|---|---|
| Fees received | 80,000 | 11,500 F | 91,500 | 91,500 | |
| Less variable expenses | |||||
| Salaries | 38,000 | 5,463 U | 43,463 | 40,000 | 3,463 F |
| Motor vehicle expenses | 700 | 14 F | 686 | 720 | 34 U |
| Advertising | 2,200 | 316 U | 2,516 | 2,500 | 16 F |
| Total variable expenses | 40,900 | 5,765 U | 46,665 | 43,220 | 3,445 F |
| Contribution margin | 39,100 | 5,735 F | 44,835 | 48,280 | 3,445 F |
| Less fixed expenses | |||||
| Motor vehicle expenses – fixed | 600 | 600 | 750 | 150 U | |
| Advertising – fixed | 1,500 | 1,500 | 1,400 | 100 F | |
| Office expenses | 22,000 | 22,000 | 24.000 | 2,000 U | |
| Total fixed expenses | 24,100 | 24,100 | 26,150 | 2,050 U | |
| Net profit | 15,000 | 5,735F | 20,735 | 22,130 | 1,395 F |
There are various ways variance is measured:
- Purchase price variance: It is the difference between the actual price paid for an item bought and its estimated price, multiplied by the actual number of items bought.
Purchase Price Variance =(Actual Price-Estimated Price)×Actual Number of Purchase
- Fixed overhead spending variance: It is the difference between the actual fixed overhead expense incurred and the budgeted fixed overhead expense.
Fixed Overhead Spending Variance=Actual Fixed Overhead-Budgeted Fixed Overhead
Fixed overhead refers to costs that are not affected by a change in business activity (e.g. insurance, office expenses, rent).
- Material yield variance: It is the difference between the actual amount of material used and the standard cost expected to be used, multiplied by the standard cost of the materials.
Material Yield Variance =(Actual Amount of Material Used-Standard Cost of Expected Unit Use)×Standard Cost Per Unit
- Labour rate variance: The difference between the actual and expected cost of labour.
- Variable overhead spending: The difference between the actual and budgeted rates of spending on variable overhead.
- Selling price variance: The difference between the actual and expected profit caused by a change in the price of a product or service.
- Labour efficiency variance: The difference between the actual number of hours worked to produce a certain amount of product and the time allowed by the business to produce that certain amount of product.
- Variable overhead variance: The difference between the actual and budgeted hours worked, which are then applied to the standard variable overhead rate per hour.
Cause of Variances
The purpose of calculating variances and presenting performance reports is a control function of the budgeting process and is performed to identify and investigate any deviations. Actual figures should be checked initially to ensure there are no accounting errors.
Variances in the following variables' costs can be linked to the purchasing, production and human resource departments. A materials price variance is the responsibility of the purchasing manager.
Unit costs may vary due to:
- Suppliers updating their price lists
- Changes in the exchange rate, e.g. imported goods
- Seasonal conditions affecting supply, e.g. agricultural products
- The purchase of substitute materials
- Orders having to be filled by an alternative supplier
A materials usage variance is the responsibility of the production manager and may be the result of:
- Changes to production methods, e.g. new technology
- Inexperienced staff members, e.g. lack of training
- The quality of the materials
A direct labour variance may be linked to both the production manager and the human resource manager and may include:
- Changes in production methods
- Increase in award rates of pay
- Breakdowns and stoppages
Fixed costs are usually outside the control of the departments above and are linked to the administration department. Once the causes for the variances have been identified and analysed, the budget may need to be revised or strategies implemented to offset undesirable outcomes.
Now that we have explored what variance is, what would this look like, and how can it affect a business? What would you do when needing to talk to an organisation/ business about that?
The following 10-minute video gives you some useful tips on how to improve communication skills to produce more effective communication in the workplace:
Professional Communication Skills
Some communication techniques
- Open meetings
- Emails
- One-on-ones
- Visual presentations
- Display confidence and seriousness.
Analyse the Budget Variance Report below. Use this template to calculate the amount of any variances and record whether the variance is favourable (F) or unfavourable (U).
Once you have attempted the activity, check your understanding in the answer sheet.
| Budget | Actual | |
|---|---|---|
| Income | ||
| Sales | 140,000 | 135,000 |
| 140,000 | 135,000 | |
| Less Cost of Sales | ||
| Opening Inventory | 20,000 | 20,000 |
| Cash Purchases | 40,000 | 40,000 |
| Credit Purchases | 38,000 | 36,000 |
| 98,000 | 96,000 | |
| Less Closing Inventory | 20,000 | 28,000 |
| 78,000 | 68,000 | |
| Gross Profit | 62,000 | 67,000 |
| Add Other Revenue | ||
| Discount Received | 300 | 300 |
| Commission Revenue | 1,800 | 1,800 |
| 2,100 | 2,100 | |
| 64,100 | 69,100 | |
| Less General & Admin Expenses | ||
| Wages | 19,700 | 19,700 |
| Electricity | 5,000 | 6,500 |
| Depreciation | 11,000 | 11,000 |
| Insurance | 1,400 | 1,400 |
| 37,100 | 38,600 | |
| Selling & Distribution | ||
| Advertising | 2,400 | 2,400 |
| Financial | ||
| Interest Expense | 4,200 | 6,000 |
| Bad Debts | 800 | 800 |
| Discount Allowed | 250 | 250 |
| 5,250 | 7,050 | |
| Net Operating Expenses | 44,750 | 48,050 |
| Net Profit | $19,350 | $21,050 |