Financial Reporting refers to standard practices to give stakeholders an accurate depiction of a business' finances, including its revenues, expenses, profits, capital, and cash flow, as formal records that provide in-depth insights into financial information and is useful in making economic decisions. Stakeholders include – investors, creditors, the public, debt providers, and government agencies.
Financial reporting is usually considered an end product of Accounting.
Typical components of financial reporting in a small business includes; the financial statements such as Balance Sheet, Profit and loss account, Cash flow statement and tax returns, and any periodic reports to stakeholders.

The following points sum up the objectives and purposes of Financial Reporting;
-
Providing information, to management, which is used for the purpose of planning, analysis, benchmarking and decision making.
-
Providing information to investors, promoters, debt provider and creditors which is used to enable them to make rational and prudent decisions regarding investment, credit etc.
-
Providing information to shareholders and public at large in case of listed companies about various aspects of an organisation.
-
Providing information about the economic resources of an organisation, claims to those resources (liabilities & owner’s equity) and how these resources and claims have undergone change over a period of time.
-
Providing information as to how an organisation is obtaining/purchasing and using various resources.
-
Providing information to various stakeholders regarding performance management of an organisation as to how diligently and ethically they are discharging their duties & responsibilities.
-
Providing information to the statutory auditors which in turn facilitates audit.
-
Enhancing social welfare by looking into the interest of employees, trade union and government.
The importance of Financial Reporting;
-
Financial reports form the backbone for financial planning, analysis, benchmarking and decision making. They are used for the above purposes by various stakeholders.
-
Financial reporting helps organisations to raise capital both domestic as well as overseas.
-
To help an organisation to comply with various statues and regulatory requirements. The organisations are required to file financial statements to government agencies and regulatory associations. In case of listed companies, quarterly as well as annual results are required to be filed to stock exchanges and published. Remember, the government (and outside investors) will not care WHY your financial reports are inaccurate. They’ll just penalise you for being wrong.
-
It facilitates statutory audit. The statutory auditors are required to audit the financial statements of an organisation to express their opinion.
-
On the basis of financials, the public in large can analyse the performance of the organisation as well as of its management.
-
For the purpose of bidding, labour contracts, government supplies etc., organisations are required to furnish their financial reports and statements with their applications.
The advantages of Financial Reporting;
-
Improved debt management - As you will surely know, debt can cripple the progress of any company, regardless of sector. While there may be many different types of financial reporting concerning purpose or software, almost all solutions will help you track your current assets divided by the current liabilities on your balance to help gauge your liquidity and manage your debts accordingly.
-
Trend identification - Regardless of what area of financial activity you’re looking to track, all types of this kind of reporting will help you identify trends.
-
Real-time tracking - By gaining access to centralized, real-time insights, you will be able to make accurate, informed decisions swiftly, thereby avoiding any potential roadblocks while maintaining your financial fluidity at all times.
-
Liabilities - Managing your liabilities is a critical part of your company’s ongoing financial health. Business loans, credit lines, credit cards, and credit extended from vendors are all integral liabilities to manage.
-
Progress and compliance - As the information served up by financial reporting software is both accurate and robust, not only does access to this level of analytical reporting offer an opportunity to improve your financial efficiency over time, but it will also ensure you remain 100% compliant – which is essential if you want your business to remain active.
Purpose - the reason for which something is done, or created, or for which something exists.
Importance - the condition of being of great significance or value.
Advantage - a condition giving a greater chance of success.

The Income Statement is one of the main financial statements which most companies prepare at the end of the accounting period. Other names for the Income Statement are the Profit and Loss Statement (P&L), the Statement of Operations, and the Revenue Statement.
The Income Statement allows the company to define the net profit and show all sources of this profit. It is an important source of information for auditors, external and internal investors, creditors, government and other stakeholders of the company. It provides the data for financial analysis of the company’s activity because it measures a company's financial performance over a specific accounting period.
The Income Statement begins with revenues and gains amounts and then considers all expenses, including write-offs, to reach the amount of net profit or loss. If the net amount of revenues and gains is bigger than that of expenses and losses, the company has net income. If the final calculated amount of net income is negative, then there is a net loss.
How your Profit and Loss/Income Statement (P&L) looks, depends on the complexity of your organisation's activity, but it is a common practice to use pro-forma’s for creating P&L Statements. There are usually the following items included in the P&L Statement;
-
Revenue.
-
Cost of sales.
-
Operating expenses.
-
Depreciation.
-
Other Expenses.
-
Interest Expense.
-
Interest Income.
-
Income Tax.
-
Net Income/ Net Loss.
Preparing of the P&L statement may be on an annual basis, monthly, or quarterly. This allows you to control the dynamics of changes of company’s activity.
Terms explained;
Revenue refers to all cash inflow occurred from company’s operational activity during the reporting period. This may be sales from goods produced or services provided. Revenues from non-operational activity may include rent revenues or revenues from reselling goods. All information about cash inflow the accountant manager retrieves from general ledger accounts.
Expenses include costs of goods sold (COGS), administrative expenses, selling expenses, and general expenses which are related to the reporting period.
As a part of expenses, depreciation costs reflect the value of fixed assets which contributed to the production of goods during the reporting period.
Costs of goods sold are those which relate to goods produced and include raw material costs, direct labour costs and other costs directly related to the production process.
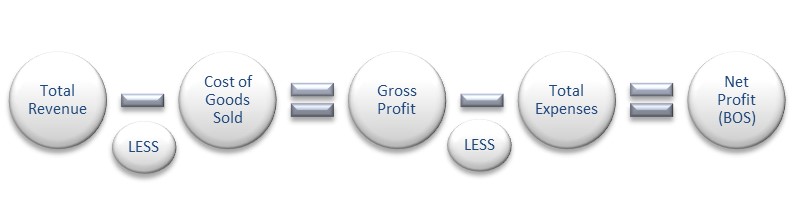
The difference between Revenues and COGS is called gross profit which as usual is also recorded in the Income Statement.
Interest Expenses and Interest Income shows the financial revenues or expenses from borrowing or lending money.
Other expenses may include foreign exchange loss, insurance premiums, outsourcing costs, travel hosting expenses, buildings maintenance and repair work, studies and research costs, external personnel charges, advertising costs, transportation charges, the cost of meetings and receptions, cargo and courier expenses.
After gross profit is calculated, the manager subtracts all of other expenses and depreciation from this number in order to generate company’s operating profit, or earnings before interest and taxes (EBIT). EBIT is an intermediate metric between gross and net profit of the company and is frequently used for calculating different financial ratios.
The next step in preparing the Income Statement is to subtract the interest expenses from operational profit in order to abstract from company’s capital structure (not to consider debt capital) and get earnings before taxes. So, after subtracting tax expenses, the accountant manager will finally get the net profit. Net profit may be divided between common shareholders or may be attributed to company’s development as retained earnings.
An example showing the components of a Profit and Loss Statement;
Total revenue $1,000,000 100%
Less
Cost of Goods Sold $426,200 42.6%
Gross Profit $573,800 57.4%
Less
Expenses
Accounting and legal fees $11,700
Advertising $15,000
Depreciation $38,000
Electricity $2,700
Insurance $15,200
Interest and bank charges $27,300
Postage $1,500
Printing and stationary $8,700
Professional memberships $1,800
Rent for premises $74,300
Repairs and maintenance $21,100
Training $6,900
Vehicle operating costs $20,000
Wages and salaries $223,500
Workers compensation $6,500
All other expenses $14,100
Total Expenses $488,300 48.8%
Equals Net Profit (BOS) $85,500 8.6%
BOS = Before Owners Salary
This simplified equation illustrates how Net Profit can be calculated in a P&L statement;
The example below is a sample Profit and Loss/Income Statement designed by beanninjas.com
|
Profit & Loss |
|||||
|
Demo Company (AU) |
|||||
|
For the month ended 30November 2015 |
|||||
|
Add Summary |
|
|
|
|
|
|
|
Nov-15 |
Oct-15 |
Sep-15 |
||
|
Income |
|
|
|
||
|
Sales |
40,844.00 |
38,280.00 |
35,686.00 |
||
|
Total Income |
40,844.00 |
38,280.00 |
35,686.00 |
||
|
|
|
|
|
||
|
Less Cost of Sales |
|
|
|
||
|
Contractors |
15,672.00 |
13,826.00 |
11,037.00 |
||
|
Materials |
8,563.64 |
6,191.00 |
5,648.00 |
||
|
Total Cost of Sales |
24,235.64 |
20,017.00 |
16,685.00 |
||
|
GROSS PROFIT |
16,608.36 |
18,263.00 |
19,001.00 |
||
|
|
|
|
|
||
|
Less Operating Expenses |
|
|
|
||
|
Advertising |
2,272.73 |
1,818.18 |
12.00 |
||
|
Bank Fees |
10.50 |
10.50 |
0.00 |
||
|
Cleaning |
155.00 |
155.00 |
155.00 |
||
|
Consulting & Accounting |
266.27 |
266.27 |
217.27 |
||
|
Entertainment |
(200.00) |
450.00 |
27.20 |
||
|
General Expenses |
118.18 |
966.87 |
0.00 |
||
|
Light, Power, Heating |
399.73 |
295.00 |
350.00 |
||
|
Motor Vehicle Expenses |
568.04 |
135.00 |
40.91 |
||
|
Office Expenses |
129.93 |
219.45 |
1,076.54 |
||
|
Printing & Stationery |
19.91 |
46.09 |
114.45 |
||
|
Rent |
2,573.86 |
1,500.00 |
1,500.00 |
||
|
Telephone & Internet |
449.21 |
557.85 |
432.50 |
||
|
Travel - National |
0.00 |
0.00 |
462.14 |
||
|
Wages and Salaries |
8,300.00 |
7,650.00 |
7,300.00 |
||
|
Total Operating Expenses |
15,063.36 |
14,070.21 |
11,688.01 |
||
|
OPERATING PROFIT |
1,545.00 |
4,192.79 |
7,312.99 |
||
|
|
|
|
|
|
|
|
Non-operating Income |
|
|
|
||
|
Interest Income |
97.05 |
0.00 |
0.00 |
||
|
Total Non-operating Income |
97.05 |
0.00 |
0.00 |
||
|
NET PROFIT |
1,642.05 |
4,192.79 |
7,312.99 |
||
|
Source: https://beanninjas.com/blog/3-warning-signs-in-your-profit-loss-income-statement/ |
|||||
This video explains the Profit and Loss Statement for students, in depth;
The Balance Sheet is the main financial statement that reveals a company's assets, liabilities and shareholders' equity for a given period of time. The other name for the Balance Sheet is Statement of Financial Position. As well as Income Statement the Balance Sheet is prepared annually, quarterly or monthly.
A company's assets, liabilities and shareholders' equity provide all stakeholders (owners, investors, creditors, managers, etc.) the information of what the company owns and owes, as well as the amount contributed by the shareholders. These three parts of the Balance Sheet should meet the following rule or equation;
Assets = Liabilities + Equity.
After the general ledger accounts are prepared, the accountant prepares a trial balance. A trial balance is considered a working paper for an accountant when preparing the Balance Sheet. A trial balance is a chart of all active (on a debit side) and passive (on a credit side) accounts with their total balances. If the totals of all debit and credit accounts are equal, it means that trial balance is balanced. Balanced means to be in equality. That is, all liabilities and equity are the resources of company’s assets and must be equal to them.
- The first part of the Balance Sheet are Assets which represent things that the company has. They include the following items: cash, investments, accounts receivable, inventories, buildings, land, machinery, equipment, and goodwill.
All these types of assets are grouped in the Balance Sheet and usually appear in order like the following:
-
Current Assets (accounts receivable, inventories, cash and equivalents that will be used in a period less than one year).
-
Investments (long-term investments in bonds and stocks).
-
Property, Plant, and Equipment (buildings, land, machinery, equipment).
-
Intangible Assets (goodwill, copyrights, patents, trademarks, etc.).
-
Other Assets (other long-term assets).
The amounts reported in the asset accounts and on the balance sheet are company's assets at their original historical cost or actual costs recorded at the time of a transaction.
2. The second part of records in the Balance Sheet are Liabilities. Liabilities reflect obligations of the company to its creditors or suppliers. All liabilities accounts have a credit balance and include the following items: accounts payable, salaries and wages payable, interest payable, income tax payable, accrued expenses payable, notes and bonds payable, other short term debts, unearned revenue.
Similar to assets, the liabilities consist of groups which are the current liabilities and long-term liabilities. The short-term or current liabilities are those that are payable within one year (for instance, accounts payable, salaries and wages payable, interest payable, income tax payable, accrued expenses payable), while long-term liabilities are due within more than one year (examples are bonds and notes payable). It is worth to note, that in case of long-term debt the principal for the next year will be considered as current liabilities in preparing the Balance Sheet, while the rest amount will be reported as the long-term liabilities.
3. Equity reported on the Balance Sheet represents funds initially contributed by the owners into a business and retained earnings of the company in the next periods. Along with liabilities, equity may be classified as resources of company’s assets. If a company is public, then in the Balance Sheet will be recorded shareholders’ equity. In contrast, for sole proprietorship in the Balance Sheet will be recorded the owner’s equity. Company’s equity may include preferred stock - redeemable, preferred stock - non redeemable, common stock, additional paid-in capital, retained earnings, and other equity.
The Balance Sheet is an important source of data for calculating many types of ratios, including debt-to-equity ratio, current ratio, working capital ratio, quick ratio, inventory turnover, accounts receivable turnover and others.
An example of the Balance Sheet of Kernel Holding SA is shown below;
|
Period Ending |
2014 30/06 |
2013 30/06 |
2012 30/06 |
2011 30/06 |
|
Total Current Assets |
872.53 |
1090.09 |
1118.4 |
809.72 |
|
Cash and Short Term Investments |
65.4 |
78.82 |
82.53 |
115.9 |
|
Cash |
65.4 |
78.82 |
82.53 |
115.9 |
|
Cash & Equivalents |
- |
- |
- |
- |
|
Short Term Investments |
- |
- |
- |
- |
|
Total Receivables. Net |
256.02 |
364.62 |
382.02 |
332.86 |
|
Accounts Receivables – Trade. Net |
99.8 |
150.76 |
146.36 |
111.59 |
|
Total Inventory |
482.36 |
517.23 |
563.52 |
279.63 |
|
Prepaid Expenses |
56.92 |
110.09 |
90.33 |
81.33 |
|
Other Current Assets. Total |
11.82 |
19.32 |
- |
- |
|
Total Assets |
1919.02 |
2361.63 |
2116.39 |
1572.61 |
|
Property/Plant/Equipment. Total - Net |
643.46 |
763.31 |
728.37 |
502.75 |
|
Property/Plant/Equipment. Total - Gross |
- |
- |
- |
- |
|
Accumulated Depreciation. Total |
- |
- |
- |
- |
|
Goodwill. Net |
138.57 |
161.74 |
137.23 |
85.99 |
|
Intangibles. Net |
94.74 |
159.5 |
91.09 |
65.56 |
|
Long Term Investments |
98.08 |
94.03 |
- |
- |
|
Note Receivable – Long Term |
- |
- |
- |
- |
|
Other Long Term Assets. Total |
71.64 |
92.97 |
41.31 |
108.58 |
|
Other Assets. Total |
- |
- |
- |
- |
|
Total Current Liabilities |
597.36 |
700.08 |
446.16 |
394.99 |
|
Accounts Payable |
33.37 |
47.07 |
25.49 |
27.05 |
|
Payable/Accrued |
- |
- |
- |
- |
|
Accrued Expenses |
10.78 |
12.33 |
22.35 |
22.82 |
|
Notes Payable/Short Term Debt |
405.82 |
398.63 |
167.35 |
234.51 |
|
Current Port of LT Debt/Capital Leases |
83.58 |
59.57 |
104.07 |
36.93 |
|
Other Current Liabilities. Total |
63.81 |
182.49 |
126.9 |
73.67 |
|
Total Liabilities |
889.36 |
1026.15 |
936.71 |
601.03 |
|
Total Long Term Debt |
260.01 |
275.72 |
426.86 |
156.06 |
|
Long Term Debt |
247.53 |
256.63 |
414.24 |
152.68 |
|
Capital Lease Obligations |
12.49 |
19.09 |
12.62 |
3.37 |
|
Total Debt |
749.42 |
733.92 |
698.28 |
427.50 |
|
Deferred Income Tax |
17.24 |
27.72 |
26.36 |
24.12 |
|
Minority Interest |
1.02 |
16.78 |
31.02 |
25.72 |
|
Other Liabilities. Total |
13.73 |
5.84 |
6.32 |
0.15 |
|
Total Equity |
1029.66 |
1335.48 |
1179.68 |
971.57 |
|
Redeemable Preferred Stock. Total |
- |
- |
- |
- |
|
Preferred Stock – Non Redeemable. Net |
- |
- |
- |
- |
|
Common Stock. Total |
2.1 |
2.1 |
2.1 |
1.95 |
|
Additional Paid-In Capital |
503.82 |
503.82 |
503.82 |
361.5 |
|
Retained Earnings (Accumulated Deficit) |
848.79 |
947.1 |
824.58 |
617.88 |
|
Treasury Stock - Common |
- |
- |
- |
- |
|
ESOP Debt Guarantee |
- |
- |
- |
- |
|
Unrealised Gain (Loss) |
39.46 |
40.05 |
15.05 |
15.05 |
|
Other Equity. Total |
-364.51 |
-157.59 |
-165.87 |
-24.8 |
|
Total Liabilities & Shareholders’ Equity |
1919.02 |
2361.63 |
2116.39 |
1572.61 |
|
Total Common Shares Outstanding |
79.68 |
79.68 |
79.14 |
74.68 |
|
Total Preferred Shares Outstanding |
- |
- |
- |
- |
|
*In Millions of USD (except for per share items) |
||||
Source: Statement of Kernel Holding SA as of October 2014
Refer to How to set up a balance sheet. Information provided by business.gov.au
Cash flow is defined as the quantity of money flowing in and out of your business at any given time. In an ideal business cycle, you will always have more cash flowing into your business than flowing out of your business. However, the reality is, that most companies are required to produce or distribute goods/services to customers, pay their staff and all the suppliers before they get paid themselves. This gap in payments in and payments out of the business is a constant and significant challenge for companies. How well this issue is managed is critical to the business' immediate financial health and long-term sustainability.
Cash flow may include;
-
Anticipated payments.
-
Anticipated receipts.
-
Customer credit policy/debt recovery.
-
Taxation provisions.
When you are looking at the responsibility of managing and working your cash flow, the task is increased in difficulty as the number of transactions and amounts of money involved grows. If the cash flow is not managed well, it could result in greater adverse impacts for the business.
A sign of a healthy cash flow is always having money available to pay all wages and bills on time. If a company cannot do this, they can face a "cash crisis". Situations like this can present with trouble accessing supplies, potentially disrupt trade that generates revenue, and disrupt daily operations.
Any receipt of cash is counted as cash inflows for a business. Some examples are;
-
Payment for goods or services from your customers.
-
Receipt of a bank loan.
-
Interest on savings and investments.
-
Shareholder investments.
-
Tax returns.
Any cash outgoings are counted as cash outflows for a business. Some examples are;
-
Purchase of stock, raw materials or equipment.
-
Wages, rents and daily operating expenses.
-
Loan repayments.
-
Income tax, payroll tax and other taxes.
-
Asset purchases.
For information on cash flow statements, refer to How to set up a cash flow statement provided by www.business.gov.au.
Cash Flow Forecasts
Cash flow projecting enables you to forecast peaks and troughs in your cash balance. Estimated or real figures are used, and it can show the expected flow of money in and out of your business. This can also assist in predicting the bank balance at the end of each month.
By introducing and implementing a cash flow management system, you can successfully manage your cash flow and the frequently resulting lag between payments in and payments out. This does not have to be a complicated system but merely a list of stages that you continuously act on to minimise the lag period and to escape any imminent cash crisis.
The simple stages to follow include;
-
Ask your customers for shorter payment terms at the time of sales negotiations.
-
Seek contract down payments and payment in advance for major material purchases.
-
Get bills out quickly and chase debts promptly and firmly.
-
Consider offering a small discount for prompt settlement of bills.
-
Ask for extended credit terms with suppliers.
-
Order less stock but more often.
-
Lease rather than buy equipment.
-
Review the profitability of your selling prices.
To assist you with your long-term cash flow, you could also consider the following steps;
Ensure that your forecasts are up-to-date and accurate, and where possible, use actual figures (not budgeted). If you come across any changes in your outlook, always update forecasts quickly.
This means you need to be conscious of any changes that may affect your business such as changes in demand, increased competition and new technologies, rising interest rates, economic downturns, etc.
While using extra cash to purchase assets for your business can improve productivity and competitiveness, it can be very useful to retain backup funds to cover any unexpected costs that may arise, such as repairs for breakdowns of equipment.
Purchasing supplies in bulk may increase savings, however, having excessive amounts of stock may tie up that can be better used elsewhere.
Keeping accurate and up-to-date financial records is a critical requirement for managing and running a thriving and profitable business. Financial records make required information available to allow you to monitor the running of your business.
Financial Records include;
-
Financial statements – profit and loss accounts, balance sheets, depreciation schedules and taxation returns.
-
General journal and general ledger.
-
Asset register.
-
Cash records – cash payments journal, cash receipts journal, cheque butts, petty cash books and bank deposit books.
-
Work-in-progress records.
-
Bank account statements, bank reconciliations and bank loan documents.
-
Sales/debtor records – for example, sales journal, debtors ledger, a list of debtors, invoices and statements issued, and delivery dockets.
-
Customer or job files.
-
Stock listings.
-
Creditors records – for example, invoices and statements received and paid, creditors ledger and unpaid invoices.
-
All correspondence, annual returns and ASIC forms.
-
Wages and superannuation records.
-
Registers of members (where applicable), options, debenture holders, prescribed interests, charges and unclaimed property.
-
Director and members meeting minutes.
-
Deeds for trusts, contracts and agreements and inter-company transactions, including guarantees.
Taxes are arguably the biggest reason for the importance of financial statements – basically, you have to provide them. The government utilises such reports to ensure that you’re paying your fair share of taxes.
-
The Australian Taxation Office (ATO), by law, requires accurate business records are kept and made available when required. If you don’t comply, penalties may apply.
-
All financial records and documents, for tax purposes, must be kept for a minimum of five years after they are prepared, obtained, or the transactions completed. Your obligation to maintain all the records and documentation for up to five years continues even if you retire, close or sell your business. Financial records must be kept for a minimum of 7 years for legal purposes.
-
The records need to be in plain English and allow for ease of access should the tax office ever wish to see them.
-
Maintaining good financial records will make completing the business activity statements and all required tax documentation as they are due, a lot easier and faster.
-
For reporting requirements to the Australian Taxation Office (ATO), you are required to keep a range of business records including; Income tax and GST Records, Sales records (receipts or sales invoices, cash register tapes, credit card statements, bank deposit books and account statements), purchase/expense records (receipts, cheque butts, tax bills, bank account and credit card statements), year-end income tax records (motor vehicle expenses, a list of debtors and creditors, stocktake sheets and depreciation schedules).
It is a legal requirement that a company keeps all of its financial records that are;
-
Correctly registered and explain its transactions and financial position and performance.
-
Enable genuine and fair financial statements to be prepared and audited ‘Financial records’ include receipts, cheques, invoices, documents and working papers that explain the ways and means by which all the financial reports have been prepared.
-
All financial records are required for seven (7) years.
-
If your financial records are kept electronically, you need to know that they can be changeable in hard copy. Computer backup discs – suggested frequency is at least monthly.
-
If your files are kept on a computer by a third party, such as your accountant’s computer, a hard copy must be provided to a person entitled to inspect the records.