The properties of soil have an enormous impact on the plants growing in it. You can discern some of the properties of the soil just by looking at it and squeezing it in your hand.
Before we talk about soil properties in more detail, read the article, Soil Properties, on the Science Learning Hub website and answer the quiz questions below.
Activity – Know your soil
The webpage referenced above, Soil Properties, provides a good introduction to some of the main characteristics of soil. Answer these ten questions confirming your understanding of the content.
Earlier in this module we talked about the size of sand, silt and clay particles. These are:
| Mineral particle | Particle size |
|---|---|
| Sand | 2.00-0.06mm (or 2.00-0.05mm) |
| Silt | 0.06-0.002mm (or 0.05-0.002mm) |
| Clay | Smaller than 0.002mm |
Loam
We also refer to some soils as loam. Loam is the name given to soil that has a large amount of sand and a smaller amount of clay. This can be further divided into subtypes, such as sandy loam, silt loam, loamy clay, and clay loam, as we’ll discuss shortly.
Mason jar test
In Module 1 we estimated the texture of soil using a field texture test – either the touch test or the ribboning test. These tests are great because they are easy to do in the field and give us a good approximation, but now we want to be more accurate with our results.
We can do this without the need for expensive equipment by following a test commonly called the mason jar test. This video by Growit Buildit provides step-by-step instructions on how to do the test:
When it comes time to calculate your soil texture, use this graph rather than the USDA one mentioned in the video. This is because there are no true loam soils in Aotearoa, so the graph is divided differently:
Please download this NZ Soil Texture Triangle (shown below) and use it instead of the one shown in the video.
 If you’re unsure how to plot your results on a triangle graph, also known as a ternary diagram, watch this video by Paul Scott. Remember to use the NZ soil texture triangle.
Soil structure is a term that describes how well individual particles, like sand, silt, clay, and organic matter clump together to form aggregates, or more correctly, peds.
Soil structure dictates how permeable the soil is. Permeability is the property of the soil to transmit water and air. In other words, how well water moves through the soil, how easily roots can penetrate and, by association, how easily worms and other soil organisms can move around.
In Module 1 we looked at the size of the peds formed after doing a drop test and we determined that good soil structure is made up of medium-sized peds with some that are smaller and some peds that are larger than the rest.
In most cases this is true, but it can be a little more complicated than that. We need to consider what effect the shape of the peds has on porosity, as well as their size.
The following video, by Dan Pennock of the University of Saskatchewan provides a good introduction to soil structure. In the video, Dan talks about the A-horizon and B-horizon. We’ll cover these terms later in this module, but for now, just think of them as layers of different soil types (like we saw in our test pit in Module 1).
Criteria for the classification of soil structure
In the video Dan talks about the classification of soil structure being based on the following three criteria:
- Grade – refers to how well the soil clumps together.
- Kind or shape (or type) – refers to the shape of the peds.
- Class or size – refers to the average size of the peds.
Grade
| Soil structure grade | This describes the degree of aggregation; the grade of the structure should be determined when the soil has a balance of wet and dry, neither being more prominent as these properties vary with the moisture content of the soil. |
The grade spectrum goes from somewhere between a soil with a single-grain structure, like pure sand, to soil that is compressed together into a single massive clump. Interestingly, these are both graded as structureless.
The Food and Agriculture Organisation of the United Nations defines soil structure grades and types in the following two tables:
| Name | Description |
|---|---|
| 0. Structureless: Single-grain structure | Where the individual soil particles show no tendency to cling together, such as pure sand. |
| 1. Weak structure | Is poorly formed from indistinct aggregates that can barely be observed in place. When removed from the profile, the soil material breaks down into a mixture of very few entire aggregates, many broken aggregates and much unaggregated material. |
| 2. Moderate structure | Is well formed from distinct aggregates that are moderately durable and evident but not distinct in undisturbed soil. When removed from the profile, the soil material breaks down into a mixture of many distinct entire aggregates, some broken aggregates and little unaggregated material. |
| 3. Strong structure | Is well formed from distinct aggregates that are durable and quite evident in undisturbed soil. When removed from the profile, the soil material consists very largely of entire aggregates and includes few broken ones and little or no non-aggregated material. |
| 0. Structureless: Massive structure | Where the entire soil horizon appears cemented in one great mass. |
Kind or shape (or type)
Soil structure type describes the form or shape of individual aggregates
| Name | Description | Image |
|---|---|---|
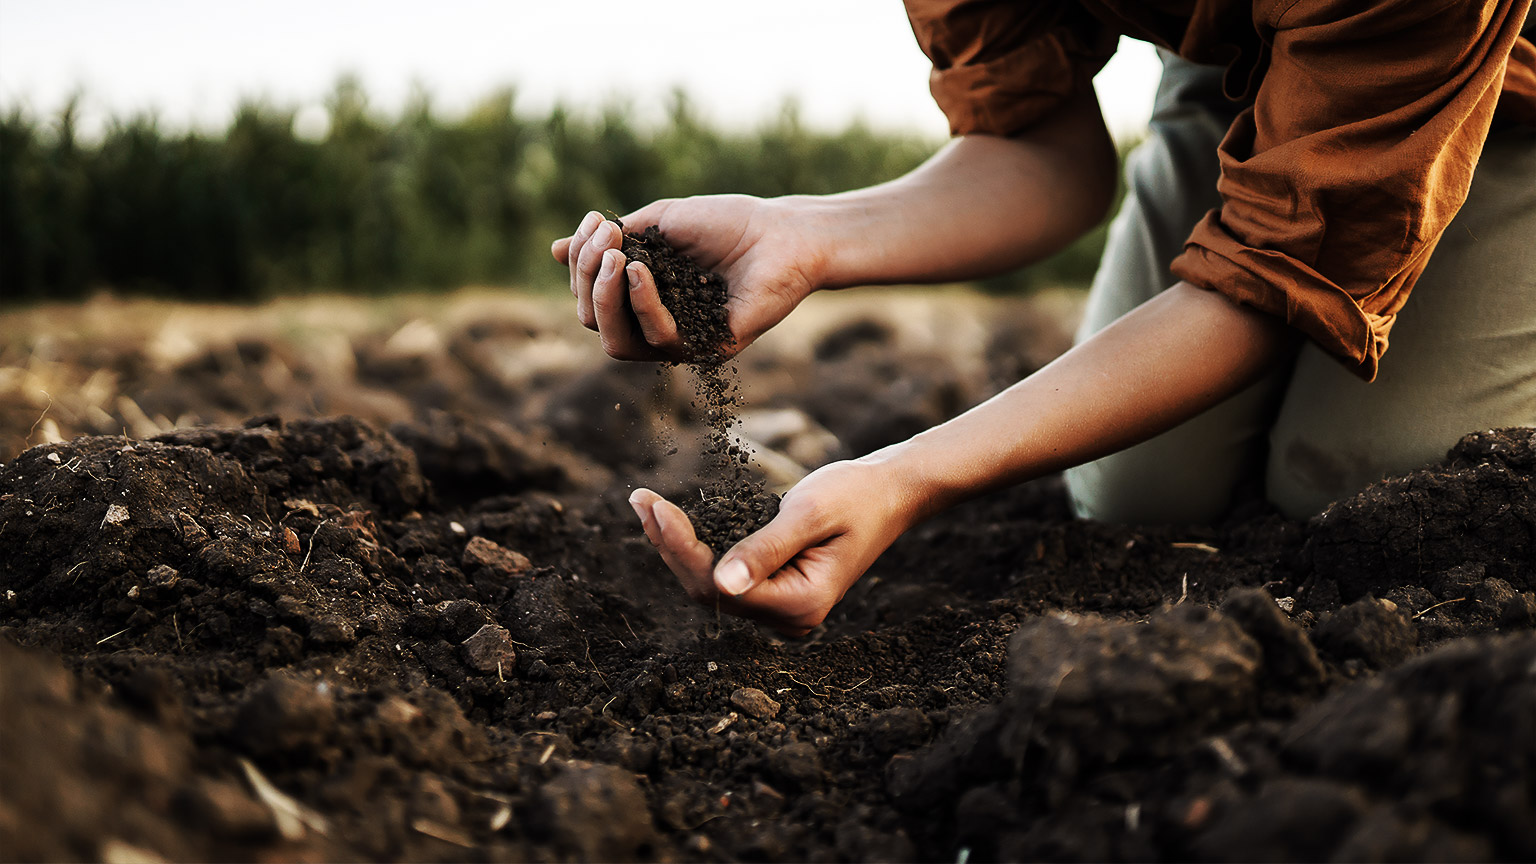
| 1. Granular, or crumb | Individual particles of sand, silt and clay grouped together in small, nearly spherical grains. Water circulates very easily through such soils. They are commonly found in the A-horizon of the soil profile. | 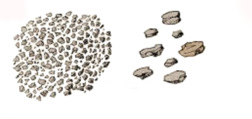 |
| 2. Blocky, or subangular blocky | Particles that cling together in nearly square or angular blocks having more or less sharp edges. Relatively large blocks indicate that the soil resists penetration and movement of water. They are commonly found in the B-horizon where clay has accumulated. | 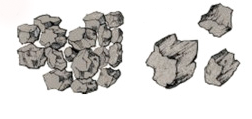 |
| 3. Prismatic or columnar | Particles which have formed into vertical columns or pillars separated by miniature, but definite, vertical cracks. Water circulates with greater difficulty and drainage is poor. They are commonly found in the B-horizon where clay has accumulated. |  |
| 4. Platy | Particles aggregated in thin plates or sheets piled horizontally on one another. Plates often overlap, greatly impairing water circulation. It is commonly found in forest soils, in part of the A- horizon, and in claypan* soils. | 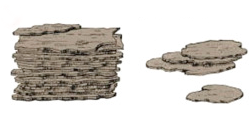 |
* Claypan is a compact and dense layer in the subsoil that is slowly permeable. It is separated by a clearly defined boundary from the overlying material and has a much higher clay content. Root growth and water infiltration are restricted due to the density of the soil. Source: Wikipedia contributors
** Images sourced from Rai, R. K., V. P. Singh, and A. Upadhyay. 2017
Class or size
| Soil structure class | This describes the average size of individual aggregates |
Soil is given a classification, based on the average size of the peds, but this varies depending on its type (shape):
| Class | Platy | Prismatic or columnar | Blocky or subangular blocky | Granular |
|---|---|---|---|---|
| Very fine or very thin | Very thin: <1mm | Very fine: <10mm | Very fine: <5mm | Very fine: <1mm |
| Fine or thin | Thin: 1-2mm | Fine: 10-20mm | Fine: 5-10mm | Fine: 1-2mm |
| Medium | Medium: 2-5mm | Medium: 20-50mm | Medium: 10-20mm | Medium: 2-5mm |
| Coarse or thick | Thick: 5-10mm | Coarse: 50-100mm | Coarse: 20-50mm | Coarse: 5-10mm |
| Very coarse or very thick | Very thick: >10mm | Very coarse: >100mm | Very coarse: >50mm | Very coarse: >10mm |
For example, if you’re looking at soil that forms platy peds with an average thickness of 8mm, this would be classified as Thick. To work this out we read down the Platy column until your find the right size range – 5-10mm – the text in the cell tells you the classification “Thick”.
Soil colour is a helpful indicator of both the chemical processes that helped form them and the properties of the soil.
The Queensland Government says that soil colour is usually due to 3 main pigments.
- Black – from organic matter
- Red – from iron and aluminium oxides
- White – from silicates and salt.
The Queensland Government webpage on soil colour describes the characteristics and typical management implications for soils based on their colour.
Soil scientists measured and described the soils using a book of colour swatches, similar to those you see in a paint store, but specific to the colours that soils come in.
For our purposes, a simple description, such as “reddy brown,” “light brown,” or “washed out with lots of small orange mottles” is detailed enough.
Cation exchange capacity (CEC) is a measure of the soil's ability to hold and exchange positively charged ions, known as cations. Cations such as calcium (Ca2+), magnesium (Mg2+), and potassium (K+) are essential plant nutrients, and they are attracted to negatively charged sites on soil particles, such as clay and organic matter.
Negatively charged nutrients like nitrate (NO3-) and sulfate (SO42-) are not affected by the CEC of the soil, as they are not held by the soil particles but rather move freely in the soil solution.
The CEC is expressed in units of milliequivalents per 100 grams of soil (meq/100g) and reflects the amount of cations that can be absorbed by the soil. The higher the CEC, the greater the soil's ability to retain and supply nutrients to plants. Nutrients will leach out of soil with a low CEC more quickly than soil with a high CEC.
A soil's CEC is influenced by various factors, including the type and amount of clay and organic matter in the soil, soil pH, and the presence of other soil components that can affect cation exchange, such as aluminum and iron oxides. Soils with high clay and organic matter content typically have a higher CEC than sandy soils with low organic matter content.
Where the CEC is lower than desired, it may require more frequent addition of organic nutrients, e.g., manure, or fertilisers to provide enough nutrients for plants to grow well. If you order soils tests through a testing laboratory, the results they provide will almost certainly include the CEC of the soil.
pH refers to the potential (or power) of hydrogen present. This is a measure of how acidic or alkaline (also known as alkali, base, or basic) the substance is.
United States Geological SurveyThe range goes from 0 - 14, with 7 being neutral. pHs of less than 7 indicate acidity, whereas a pH of greater than 7 indicates a base...
Each number represents a 10-fold change in the acidity/basicness of the water. Water with a pH of five is ten times more acidic than water having a pH of six.
Soils can be acidic (a pH number smaller than 7), alkaline (a pH number greater than 7), or neutral (a pH of 7, or close to it).
Keeping pH in the Right Range Is EssentialPlants differ in their preferences for soil pH… In general, most plants grow best in a neutral soil pH, although there are important exceptions.
For example, blueberries, azaleas and rhododendrons do well in an acidic soil between 4.5 and 5.5. Lawns favor a pH of 5.5 to 6. Roses do best in soils with a neutral pH of 6.5 to 7. Similarly, vegetables prefer a slightly acid to neutral pH of 6 to 7.
This information is usually provided on plant information databases.
In addition to matching soil pH to specific plant requirements, soil pH is important for a few key reasons:
- The pH of the soil determines how accessible nutrients in the soil are to the plant, see image below.
- Soil pH can have a significant impact on the CEC of a soil. When soil pH is low (i.e., acidic), the CEC tends to be high because soil particles become more positively charged due to the presence of hydrogen ions. This causes the soil particles to attract and hold onto cations, leading to a higher CEC. When soil pH is high (i.e., alkaline), the CEC tends to be low because soil particles become less positively charged. This means that they are less able to attract and hold onto cations, leading to a lower CEC.
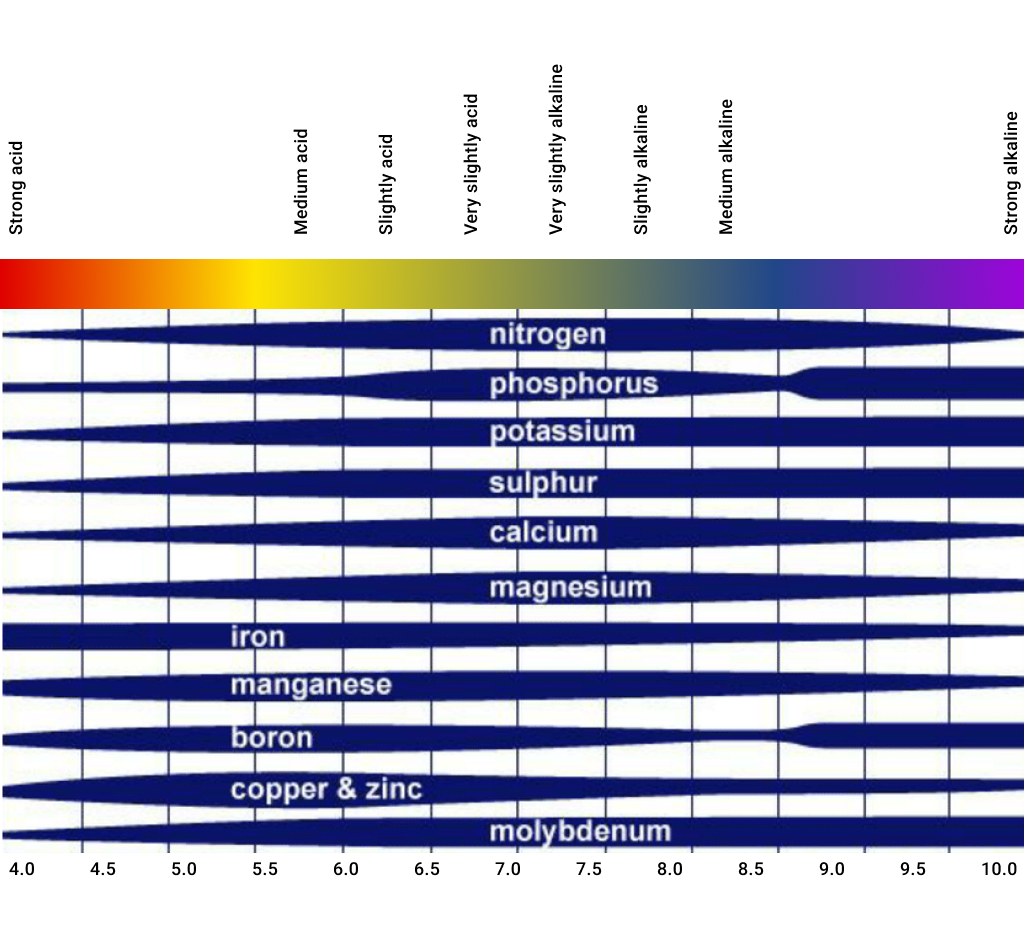
The effect of soil pH on the availability of nutrients to plants. The thicker the band the more accessible the nutrient is. For instance, plants growing in a soil with a pH of 4.5 will be able to access a lot of iron, manganese, copper, and zinc, but not much nitrogen, phosphorus, calcium, and magnesium.
Source: Roques et all
Testing soil pH
There are two ways to test the pH of your soil:
- Send a sample away to a lab for testing.
- Use a soil pH test kit to test in the field.
A lab test result will be more accurate but costs more and takes time to get a result back. A field test is less accurate – it usually gives a reading that is rounded to a whole number, e.g., pH of 6 – but is quick.
Watch the following video by the New South Wales Government, which shows how to test the pH of your soil.
Test sets differ, so make sure you follow the instructions for the test set you use.
You don’t need to test your soil pH regularly. Once every five years should be enough unless you’re actively changing the pH of the soil.
Changing the pH of your soil
If you find that your soil pH is too high (too alkaline) or too low (too acidic), you can change it gradually over time by adding certain amendments.
Increasing the pH of your soil
If your soil test shows that your soil is too acidic, you’ll need to raise the pH (make it more alkaline). You can do this by adding:
- Lime (calcium carbonate) or dolomitic lime (calcium magnesium carbonate) are the most common substance used to raise soil pH.
- Wood ashes contain potassium and calcium, which can help raise soil pH. However, they should be used sparingly as they can also contain high levels of salt, which can damage plants if used in excess.
- Alkali compost, such as compost made with high quantities of limestone, bone meal, or wood ash.
- Alkali manure from animals that have a diet that is high in protein, such as chickens and pigs.
- Organic matter, such as compost or manure, can help raise soil pH over time. They contain minerals that can neutralise acidic soil and improve soil structure.
- Mulch can help maintain a neutral pH level in your soil by reducing water evaporation and preventing leaching of nutrients.
Some fertilisers are acidic and can lower soil pH over time. If you are using fertilisers, opt for pH-neutral or alkaline fertiliser if possible.
Lowering the pH of your soil
If your soil test shows that your soil is too alkaline, you’ll need to lower the pH (make it more acidic). You can do this by adding:
- Sulphur is the most common substance used to lower soil pH. It reacts with water and soil bacteria to form sulfuric acid, which neutralises alkaline soil.
- Acidic compost such as compost made with high quantities of pine needles, oak leaves, and fruit waste.
- Acidic manure from animals that have a diet that is high in fibre, such as horses, cows, and sheep.
- Other acidifying materials such as pine needles, oak leaves, and coffee grounds can help lower soil pH over time. These materials contain acids that can neutralise alkaline soil.
Some fertilisers are acidic and can lower soil pH over time. If you choose to use fertilisers, opt for an acidifying fertiliser.
The most important thing, when changing the pH of your soil is to do it slowly – over months or years – and test the pH regularly until you’ve reached the pH range you’re aiming for.