Reading A: ShapeManager’s Toolkit: The 13 Skills Managers Need to Succeed
Reading B: ShapeBudgeting Basics and Beyond (4th ed.)
Reading C: ShapeSeven Steps to a Successful Business Plan
Reading D: ShapeCoaching For Peak Employee Performance: A Practical Guide to Supporting Employee Development (2nd ed.)
Reading E: Management Accounting Best Practices: A Guide for the Professional Accountant
Reading F: Small Business for Dummies (4th ed.)
Reading G: Shape Australian GST Legislation with Overview (15th ed.)
Reading H: The Performance-Based Management Handbook
Reading I: Business Process Improvement Toolbox (2nd ed.)
Important note to students
The Readings contained in this Book of Readings are a collection of extracts from various books, articles and other publications. The Readings have been replicated exactly from their original source, meaning that any errors in the original document will be transferred into this Book of Readings. In addition, if a Reading originates from an American source, it will maintain its American spelling and terminology. The College is committed to providing you with high quality study materials and trusts that you will find these Readings beneficial and enjoyable.

Manager’s Toolkit: The 13 Skills Managers Need to Succeed
Harvard Business School
Boston, MA, 2004
PGS 219 – 242
What Is Budgeting?
Before you go on a trip, you fill your bag with the clothes, food, and money you’ll need. Budgeting is conceptually similar—planning your trip and ensuring that you’ll have sufficient resources to make it to your destination. An organization plans its journey toward strategic objectives in a similar fashion, and it prepares for the journey with an action plan called a budget. A budget can accomplish various tasks:
- Cover a short time span. For example, a start-up company develops a budget to ensure that it will have enough cash to cover operating expenses for twelve months or so.
- Take a long-term perspective. For example, a pharmaceutical firm builds a multiyear budget for developing a new product.
- Focus on required resources for a specific project. For example, if a manufacturing firm needs to install machinery to achieve production efficiencies, then its budget will anticipate the cost of the installation.
- Account for income as well as expenditures. For example, a retailer creates a profit plan based on an expected increase in sales.
So what is a budget? It is the translation of strategic plans into measurable quantities that express the expected resources required and anticipated returns over a certain period. A budget functions as an action plan. It may also present the estimated future financial statements of the organization. Finally, a budget is an adaptable tool for management to use to achieve its strategic goals.
Budget Functions
Budgets perform four basic functions, each critical to the success of a company in achieving its strategic objectives. These functions are planning, coordinating and communicating, monitoring progress, and evaluating performance.
Planning
Planning is a three-step process to ensure that the organization will have the resources available to achieve its goals:
- Choosing goals. The goals could be as comprehensive as the strategic mission of the organization. For example, as a manager at an Internet service provider (ISP), your goal could be “to be the most efficient provider of Internet services for our valued customers.” Or, as the general manager of a major-league baseball team, your goal could be specific and very focused: to increase revenues by 10 percent during the next quarter.
- Reviewing options and predicting results. Once the goals have been determined, the next step is to look at the options available for attaining the goals and predict what the most likely outcomes would be for each option. For example, if your goal as a manager at an ISP is to become the most efficient provider of Internet services, then you could opt to maintain state-of-the-art equipment at all times, train the most skilled repair teams in the field, or concentrate on providing the most timely customer service. Or, as a baseball team general manager planning to increase revenues by 10 percent, you could consider raising prices or expanding your marketing program. Thus, predicting the costs and benefits of each option is part of planning.
- Deciding on options. After an analysis of the potential costs and benefits of each option, the next step is to decide how to attain the desired goals. Choosing which options to implement establishes the direction the company will take. The budget reflects those decisions. As a manager at an ISP, for example, you may decide that, although the other two options are important, your focus should be on maintaining state-of-the-art equipment to provide the most efficient service for your customers. Or, as manager of the baseball team, you could decide that raising prices would most effectively bring in the specified increase in revenues.
Coordinating and Communicating
Coordination is the act of gathering the pieces together—the individual unit budgets or division budgets—and balancing and combining them to achieve the master budget that expresses the organization’s overall financial objectives and strategic goals. In many companies, this is quite a feat!
A master budget compiles the individual budgets from the functional areas of research and development, design, production, marketing, distribution, and customer service into one unit budget. Then the budgets from individual divisions, product lines, and subsidiaries are coordinated and integrated into a larger, cohesive result. Much like a composer weaving the music from many different instruments together to create a symphony, the master budget brings all the pieces together to achieve the organization’s overall strategic plan and company mission. Details of the master budget will be discussed later in this chapter.
To achieve this end, communication is essential. Upper management needs to communicate the company’s strategic objectives to all levels of the organization, and the individual planners need to communicate their particular needs, assumptions, expectations, and goals to those evaluating the departmental and functional budget pieces.
Additionally, the different groups within the company must always listen to one another. If one division is striving to achieve certain sales goals, then production must have that information to prepare for increased production capacity. If the company is introducing a new product, then the marketing department must be informed early in the planning process. The department will have to include in its budget the marketing efforts for the new product.
Monitoring Progress
Once the plan has been set in motion, the budget becomes a tool that managers can use to periodically monitor progress. They assess progress by comparing the actual results with the budget. This feedback, or monitoring and evaluation of progress, in turn allows for timely corrective action. If, on the one hand, the interim evaluation shows that the organization is right on target, with actual results matching the budget’s expected results, then no adjustment to the action plan is required. However, if you discover that the actual results differ from the expected results, then you must take corrective action. For example, if your baseball team’s goal is to increase revenues 10 percent by raising prices, but you find after one month that the fans are resistant to higher prices, then you might take corrective action by offering fans bonus packages to offset the negative impact of the higher prices.
The difference between the actual results and the results expected by the budget is called a variance. A variance can be favorable, when the actual results are better than expected, or unfavorable, when the actual results are worse than expected. For example, after the first month of the new baseball season, you evaluate how the ticket sales are proceeding (table 13-1).
Overall, unit tickets sales are lower than expected, but you observe that there is a favorable variance for the higher-priced infield box seats (ticket buyers don’t seem to mind the price hike for these seats).The biggest concern you have is the higher, unfavorable variance for the outfield grandstand seats. This is where you would concentrate your corrective action, because these fans seem to be responding to the higher prices by staying away. Thus, variance analysis can help you identify a problem early in the budget cycle and take the appropriate action.
TABLE 13-1: Ticket Sales Performance Report for April
| Average Tickets Sold per Game | |||
| Actual Results | Budgeted Amounts | Variance | |
| Infield Box | 2,500 | 2,000 | + 500; favorable |
| Grandstand | 6,850 | 7,000 | -150; unfavorable |
| Outfield Grandstand | 7,700 | 9,000 | - 1,300; unfavorable |
| Bleachers | 11,850 | 12,000 | - 150: unfavorable |
| Total | 28,900 | 30,000 | - 1,100; unfavorable |
Source: HMM Budgeting
Tip
Note here that we were strictly interested in units, not revenues. Managers could also conduct the budgeting exercise using revenues.
Evaluating Performance
Effective performance-evaluation systems contribute to the achievement of strategic goals, and budgets provide essential tools for measuring management performance. After all, a manager who makes basic planning and implementation decisions should be held accountable for the results. By comparing the actual results to the budget for a given period, an evaluator can determine the manager’s overall success in achieving his or her strategic goals. Performance evaluations serve a number of purposes:
- They motivate employees through reward systems based on performance.
- They provide the basis for compensation decisions, future assignments, and career advancement.
- They create a basis for future resource allocations.
Types of Budgets
The notion of the traditional budget has been under growing attack from those who believe that it no longer serves the needs of modern organizations. Critics complain that budgets are timed incorrectly (too long or too short), rely on inappropriate measures, and are either too simplistic (or too complex), too rigid in a changing business environment, or too unchallenging (for instance, the bar is deliberately set so that managers can hit their targets and collect their bonuses). Many budgets we’ll explore in this chapter were developed to address some of these difficult planning issues.
Short-Term Versus Long-Term Budgets
Budgets are typically developed to cover a one-year time span. But the period covered by a budget may vary according to the purpose of the budget, particularly as your company defines value creation. If an organization is concerned with the profitability of a product over its expected five-year life, then a five-year budget may be appropriate. If, on the other hand, a company is living hand-to-mouth, which is often the case with start-up companies, then a month-by-month budget that focuses on immediate cash flow might be more useful.
Fixed Versus Rolling Budgets
A fixed budget covers a specific time frame—usually one fiscal year. At the end of the year, a new budget is prepared for the following year. A fixed budget may be reviewed at regular intervals—perhaps quarterly—so that adjustments and corrections can be made if needed, but the basic budget remains the same throughout the period.
In an effort to address the problems of timeliness and rigidity in a fixed budget, some firms, particularly those in rapidly changing industries, have adopted a rolling budget. A rolling budget is a plan that is continually updated so that the time frame remains stable while the actual period covered by the budget changes. For example, as each month passes, the one-year rolling budget is extended by one month, so that there is always a one-year budget in place. The advantage of a rolling budget is that managers have to rethink the process and make changes each month or each period. The result is usually a more accurate, up-to-date budget incorporating the most current information.
The disadvantage of a rolling budget is that the planning process can become too time-consuming. Moreover, if a company reviews its budget on a regular basis (say, every quarter for a one-year budget), analyzes significant variances, and takes whatever corrective action is necessary, then the fixed budget truly isn’t as rigid as it seems.
Incremental Versus Zero-Based Budgeting
Incremental budgeting extrapolates from historical figures. Managers look at the previous period’s budget and actual results as well as expectations for the future in determining the budget for the next period.
For example, a marketing department’s budget would be based on the actual costs from the previous period but with increases for planned salary raises. The advantage of incremental budgeting is that history, experience, and future expectations are included in the development of the budget.
A disadvantage often cited by critics of the traditional budget is that managers may simply use the past period’s figures as a base and increase them by a set percentage for the following budget cycle rather than taking the time to evaluate the realities of the current and future marketplace. Managers can also develop a use-it-or-lose-it point of view, with which managers feel they must use all the budgeted expenditures by the end of the period so that the following period’s budget will not be reduced by the amount that would have been saved.
Zero-based budgeting describes a method that begins each new budgeting cycle from a zero base, or from the ground up, as though the budget were being prepared for the first time. Each budget cycle starts with a critical review of every assumption and proposed expenditure. The advantage of zero-based budgeting is that it requires managers to perform a much more in-depth analysis of each line item—considering objectives, exploring alternatives, and justifying their requests. The disadvantage of zero-based budgeting is that although it is more analytic and thorough, developing the budget can be extremely time-consuming, so much so that it may even interfere with actuating that budget. Planning needs to precede, but never overwhelm, action.
Kaizen Budgeting
Kaizen is a Japanese term that stands for continuous improvement, and Kaizen budgeting attempts to incorporate continuous improvement into the budgeting process. Cost reduction is built into the budget on an incremental basis so that continual efforts are made to reduce costs over time. If the budgeted cost reductions are not achieved, then extra attention is given to that operating area. For example, a manufacturing plant may budget a continuous reduction in the cost of components, as shown below, putting pressure on suppliers to find further cost reductions.
| January–February | $100.00 |
| February–March | $99.50 |
| March–April | $99.00 |
This type of incremental budgeting is difficult to maintain because the rate of budgeted cost reduction declines over time, making it more difficult to achieve improvements after the “easy” changes have been achieved.
The Master Budget
The master budget is the heart and soul of the budgeting process. It brings all the pieces together, incorporating the operating budget and the financial budget of an organization into one comprehensive picture. In other words, the master budget summarizes all the individual financial projections within an organization for a given period.
For a typical for-profit organization, the operating budget consists of the budgets from each function—such as research and development, design, production, marketing, distribution, and customer service—and provides the budgeted income statement. The financial budget includes the capital budget, the cash budget, the budgeted balance sheet, and the budgeted cash flows. The master budget must integrate both the operating budget and the financial budget through an iterative process during which information flows back and forth from each element of the master budget (see figure 13-1).
Master budgeting goes hand-in-hand with strategic planning at the highest level. Using the organization’s strategic goals as its foundation, the budget-building process is both chronological and iterative, moving back and forth, testing assumptions and options.
Before preparing a master budget, senior managers must ask these three important questions:
- Do the tactical plans being considered support the larger and longer-term strategic goals of the organization?
- Does the organization have, or have access to, the required resources—that is, the cash it needs to fund the activities throughout the immediate budget period?
- Will the organization create enough value to attract adequate future resources—profit, loans, investors, etc.—to achieve its longer-term goals?
Setting Assumptions
The first step in developing a budget is establishing a set of assumptions about the future. The assumptions that managers make will be directly affected by the answers to questions such as these:
- What are sales and marketing’s expectations for unit sales and revenues from new and existing products?
- Are supplier prices anticipated to rise or fall?
- What will be the cost of the company’s health-care plan for the coming year?
- If the unemployment rate is expected to decline, will the company need to raise salaries to ensure an adequate work force in a tight labor market?
- What will competitors do to gain market share?
Assumptions should be sought from the sources that have the best information. For example, top management has a clear view of the strategic goals, and the finance group has records of past financial performance and future economic trends. Look to the human resource group for information on shifts in the labor market, and the sales representatives for the best information about sales prospects. Likewise, the purchasing department has the latest information about suppliers and price trends. Developing assumptions is a companywide endeavor in which communication and coordination play a key role.

Tips for setting assumptions
- Use historical data as a starting point. Even when times are changing quickly, information about past performance can establish a base from which to begin.
- Trust your own experience. Make educated guesses where necessary about what is likely to happen in the future.
- Listen to your intuition. Even though you can’t verify those gut feelings, you can take them into account.
- Conduct due diligence. Seek out the information you need. This may involve doing research, reading trade journals, collecting industry statistics, and so on. And don’t forget that the Internet is a growing information resource.
- Talk with and listen to knowledgeable people. Discuss your ideas with team members, colleagues, mentors. Seek out industry participants, suppliers, concerned community leaders, and experts in the field. Engage in discussions with competitors.
- Learn when to be a risk taker and when to be conservative. In a volatile market, conservative assumptions may be the safest.
- Test your assumptions. If possible, try out your assumptions in small experiments before you accept them.
Preparing the Operating Budget
An operating budget is nothing more than an agreed-upon pact between top management and other members of the management team. It is a target, not a forecast. It specifies revenues and costs for the coming period.
These are expressed in a statement that resembles the income (or profit and loss) statement that every company generates. The essential difference is that we are building the statement from expected versus actual quantities. In a nutshell, the operating budget is structured as follows:
Revenues – (Cost of Goods Sold + Sales, General, and Administrative Costs) = Operating Income
We have divided the operating budget process into five simple steps.
Step 1: Calculate Your Expected Revenues
For the first step in preparing an operating budget, managers must apply some assumptions to forecast revenue growth (or decline). For our hypothetical for-profit company, Amalgamated Hat Rack, the managers of the Moose Head division translate their assumptions about revenue growth based on past performance and future expectations of sales for their products during the fiscal year (table 13-2).
If they take an incremental-budgeting approach, the managers will use the prior year’s actual sales of $1,228,100 as the base for developing their projections for the next year. If, on the other hand, they follow the zero-based budgeting method, they will make their sales projections for each model from the ground up, using forecasted economic data, predicted consumer behavior, and other information. These will take recent experience with customer behavior, economic forecasts, and other information into account.
Establishing projected revenue figures can create internal tensions. If managers are evaluated and rewarded on their achieving budgeted revenue targets, then they may be tempted to develop conservative revenue targets that will be easy to reach. This budgetary slack, or padding, provides a hedge for managers, making it more likely that actual revenues will be higher than budgeted revenues. With such results, the managers appear very effective.
TABLE 13-2: Moose Head Division, Amalgamated Hat Rack, Year 1 Budget
| Prior Year's Year 1 Actual | Budgeted Amounts | Rate of Change | |
| Sales by Model | |||
| Moose Antler Deluxe | $201,000 | $205,000 | 2.0% |
| Moose Antler Standard | $358,000 | $381,000 | 6.4% |
| Standard upright | $515,500 | $556,000 | 7.9% |
| Electro-revolving | $72,400 | $60,250 | -16.8% |
| Hall/wall model | $81,200 | $80,000 | -1.5% |
| Total sales | $1,228,100 | $1,282,250 | 4.4% |
| Cost of Goods Sold | |||
| Direct labor | $92,325 | $96,500 | 4.5% |
| Factory overhead | $6,755 | $7,200 | 7.0% |
| Direct materials | $211,000 | $220,284 | 4.4% |
| Total cost of goods sold | $310,080 | $323,984 | 4.5% |
| Marketing and Administrative Costs | |||
| Sales salaries | $320,000 | $331,200 | 3.5% |
| Advertising expenses | $145,000 | $151,000 | 4.1% |
| Miscellaneous selling expenses | $4,200 | $3,900 | -7.1% |
| Administrative expenses | $92,000 | $94,500 | 2.7% |
| Total SG&A | $561,200 | $580,000 | 3.46% |
| Operating Income | $355,820 | $377,666 | 6.14% |
Source: HMM Budgeting
Production constraints (the availability of qualified people for service firms and production capacity for manufacturers) may affect the revenue budget. If, for example, sales demand is expected to exceed the company’s ability to manufacture and distribute, then the revenue budget must be adjusted to match the production constraints rather than the actual demands of the market. Otherwise, the budget must add funds for building the capacity needed to meet demand.
Step 2: Calculate the Expected Cost of Goods Sold
Once the revenue budget has been established, managers can then develop the budget for the cost of goods sold. The total number of units to be produced will form the basis for determining the direct costs, including labor and materials. In the same way, the Moose Head division calculates the indirect factory costs or overhead as part of the cost of goods sold budget. Remember here that sales are budgeted to rise 4.4 percent to $1,282,250.
STEP 3: CALCULATE THE EXPECTED OTHER COSTS
Other nonproduction costs include costs generated by research and development, product design, marketing, distribution, customer service, and administration. For the Moose Head division, only various sales-related and administrative expenses make up the other-costs budget.
STEP 4: CALCULATE THE EXPECTED OPERATING INCOME
Finally, you can calculate the budgeted income statement. The difference between expected sales and expected costs results in the expected operating income. The managers of the Moose Head division provide their expected income statement to the top management of Amalgamated Hat Rack so that top management, in turn, can determine how the Moose Head division’s budget fits with the company’s master budget and overall strategic goals.
STEP 5: DEVELOP ALTERNATIVE SCENARIOS
Testing different scenarios is the “what if ” iterative process of budgeting. How will a change in one area affect the expected outcome? What if we increase advertising? How much would that increase sales? What if the Moose Head employees decide to go on strike? How can we incorporate that risk into the budget?
For example, Amalgamated’s management may decide to shift its strategic emphasis from increasing profits to developing a new product line in the Moose Head division. Moose Head managers would then develop another set of budget figures indicating research and development costs that would reduce the current budgeted operating income. Alternatively, Moose Head managers could decide to accept bids from a new group of suppliers that would in turn reduce materials expenditures and increase the budgeted operating income.
Creating Financial Budgets
Once managers of operations have developed their operating budgets, or expected income statements, financial managers then plan for the capital required to support those operating budgets. You can’t anticipate a 10 percent increase in sales, for example, without creating a parallel plan for the extra working capital and other inputs that will be required if the anticipated increase is realized. Three other budgets are developed:
- A cash budget that includes estimated cash from operations as well as other sources of cash (accounts payable, borrowing, or equity).The cash budget predicts and plans for the level and timing of cash inflow and outflow.
- An operating asset investment plan that ensures that adequate capital will be available for assets such as inventory and accounts receivable.
- A capital investment plan that budgets for proposed investments in long-term productive assets such as property, plant, and equipment expenditures and extended R&D programs.
These financial plans support the strategic objectives of the organization, planning for both the near-term (cash budget) and the long-term (capital investment plan) financial needs. They are expressed in forecasted (or pro forma) balance sheet and cash flow statements to form a complete picture of the organization’s expected financial position during the budget period.
The cash budget is particularly important for the firm’s financial managers since it indicates shortages or surpluses of cash in each period (usually months). No business can afford a shortfall of cash, as the company would be unable to pay bills as they come due. The cash budget shown in table 13-3 is one company’s simplified cash budget for a five-month period (January through May). Notice that it identifies all cash inflows and outflows for each month. The ending cash balance of a given month becomes the beginning balance for the next month. Thus, December’s $220 ending balance becomes January’s beginning cash balance. By adding the monthly surplus (or deficit) and the beginning cash balance, the budget finds the ending balance for the month. A glance across the bottom line indicates when the enterprise will encounter a cash shortfall, as happens here in April and becomes larger in May. Companies whose businesses are heavily seasonal—agricultural producers, garment makers, ski manufacturers, and so forth—routinely experience wide swings in ending cash balances.
TABLE 13-3: Simplified Cash Budget (in Thousands of Dollars)
| December | January | February | March | April | May | |
| Cash Inflows | ||||||
| Sales revenues | 1,100 | 875 | 600 | 500 | 600 | |
| Other revenues | 250 | 225 | 200 | 200 | 0 | |
| Interest income | 30 | 34 | 34 | |||
| Total inflows | 1,350 | 1,134 | 834 | 734 | 600 | |
| Cash Outflows | ||||||
| Purchases | 400 | 380 | 320 | 300 | 350 | |
| Salaries | 200 | 200 | 200 | 200 | 200 | |
| Hourly wages | 170 | 165 | 150 | 195 | 220 | |
| Health-care payments | 20 | 20 | 20 | 20 | 20 | |
| Retirement contributions | 25 | 23 | 25 | 23 | 25 | |
| Interest payments | 15 | 15 | 15 | 15 | 15 | |
| Taxes | 305 | 295 | 270 | 260 | 240 | |
| Utilities | 20 | 18 | 15 | 20 | 25 | |
| Total outflows | 1,155 | 1,116 | 1,015 | 1,033 | 1,095 | |
| Cash Surplus or Deficit | 195 | 18 | (181) | (299) | (495) | |
| Beginning Balance | 220 | 415 | 433 | 252 | (47) | |
| Ending Balance | 220 | 415 | 433 | 252 | (47) | (542) |
During months of surplus, financial managers store cash in interest-bearing money market instruments such as short-term bank certificates of deposit (CDs), commercial paper, and U.S. Treasury bills.
As surpluses disappear, they convert those instruments back into cash and draw on lines of credit and short-term bank loans to eliminate any cash deficits. As you can see in table 13-3, managers must begin drawing on past surpluses in March. The surpluses have evaporated by April, forcing them to seek outside sources of cash. Seasonal and cyclical businesses use periods of heavy cash inflows to pay off their lines of credit and to build money market positions in anticipation of the next cash-consuming cycle.
Here are the steps to follow in building your own cash budget:
- Add receipts.–Determine the expected receipts—collections from customers and other sources—that will flow into the cash account each period. Cash collections may vary during the budget period. For example, many retail stores expect to receive most of their receipts during holiday seasons.
- Deduct disbursements.–Based on expected activity, calculate how much cash will be required to cover disbursements—cash payouts—during the period. Disbursements could include payment for materials, payroll, taxes due, and so on. Some of these expenditures may be evenly distributed throughout the budget period, but some, such as payroll and materials costs, may fluctuate as part of the production process.
- Calculate the cash surplus or deficiency.–To calculate the cash surplus or deficiency for a period, subtract the disbursements from the sum of the beginning cash balance and the receipts expected during that period.
- Add the beginning cash balance.–The beginning cash balance is the ending balance from the previous period. By adding them together, you have a new ending balance.
- Determine financing needed.–The ending balance will be positive or negative. A positive balance indicates that you have more than enough cash to cover operations during that period. A negative balance indicates that the company must develop a plan for financing the shortfall from other sources, such as a bank loan. Repayment of any such loan must be reflected among the cash outflows of subsequent budget periods.
The Human Side of Budgeting

To some degree, preparing a budget is a matter of crunching numbers, a process being left more and more to financial modeling software, computers, and technology. But behind those numbers are real people like you—people who make assumptions, people who think about future situations, people who understand the idiosyncrasies of customers and competitors. Ideally, everyone involved in the budget process has the same goal in mind—achieving the organization’s strategic objectives.
What some may see as a straightforward, even mechanical, process, however, is in reality complicated by genuine disagreements over assumptions about future trends and events, by conflicting needs, and by individual agendas that overshadow the larger corporate good. For this reason, the budget process can be defined as a series of negotiations between disparate interests. Top management wants the highest possible economic value in terms of profit. Middle management may have contrary needs, such as new equipment or new personnel. The human element is what can make the budget process so engaging and, at times, so frustrating.
Top-Down Versus Participatory Budgeting
Top-down budgeting describes the process whereby upper management sets budget goals—revenue, profit, and so on—and imposes these goals on the rest of the organization. Thus, for example, the CEO of Amalgamated Hat Rack gives Moose Head manager Claude Cervidés the goal of attaining an operating profit—or earnings before interest and taxes—of $400,000 for the upcoming fiscal year. It’s then up to Claude to shape his operating budget with $400,000 as the operating profit target.
Top-down budgeting has many advantages. Since senior management has a clearer concept of the organization’s strategic objectives, topdown budgeting ensures the following benefits for senior management:
- Budget goals that reflect management’s larger strategic objectives
- Better coordination of the budget requirements for all the elements of the organization
- The discouragement of “padding” managers’ unit budgets
- High goals that challenge managers to stretch
Top-down budgeting has two main disadvantages. First, upper management may be out of touch with the realities of the individual divisions’ production processes or markets. As a result, the goals they set may be inappropriate or unattainable. Second, middle managers may feel left out of the decision-making process and, consciously or unconsciously, may not fully participate in achieving the budgeted goals.
With participatory budgeting, the people responsible for achieving the budget goals are included in goal setting. Cervidés, for instance, would develop the budget for his own division, with the active participation of the heads of purchasing, human resources, production, marketing, and administration. Once his team had completed the budget, Cervidés would send it to Amalgamated Hat Rack’s senior management. After review and possible feedback to Cervidés, they would incorporate Moose Head’s budget, along with all the other budgets, into the master budget.
One advantage of participatory budgeting is that the people closest to the line activities—people who presumably have the best information—make the budget decisions. Also, participants in this type of budget process are more likely to make the extra effort to achieve the budgeted goals. The disadvantages of participatory budgeting are also twofold. First, the people closest to the line activities may not see the larger strategic picture. Second, if performance evaluations are tied to budget achievement, then the managers will have an incentive to pad their budgets either by underestimating revenues or by overestimating costs.
Tips for negotiating your team’s budget
Effective budgeting requires a certain organizational savvy. Here are some tips for dealing with organizational issues that surround the budgeting process:
- Understand your organization’s budgeting process. What guidelines must you follow? What is the timing of the budget process? How is the budget used in the organization?
- Communicate often with the controller or finance person in your department. Ask questions about points you don’t understand. Get that person’s advice about the assumptions your team is making.
- Know what real concerns are driving the people making the decisions about your budget. Be sure to address those concerns.
- Get buy-in from the decision makers. Spend time educating the finance person or decision maker about your area of the business. This will lay the groundwork for implementing changes later.
- Understand each line item in the budget you’re working on. If you don’t know what something means or where a number comes from, find out yourself. Walk the floor. Talk to people on the line.
- Have an ongoing discussion with your team throughout the budget period. The more you plan, the more you will be able to respond to unplanned contingencies.
- Avoid unpleasant surprises. As the numbers become available, compare actual figures to the budgeted amounts. If there is a significant or an unexpected variance, find out why. And be sure to notify the finance person who needs to know.
Iterative budgeting is an attempt to combine the best of both top-down and participatory budgeting. In the initial step, senior management provides the unit heads with a clear understanding of the organization’s strategic goals. The unit heads then work with their teams to develop operating budgets that incorporate both their own tactical goals and the organization’s larger strategic goals. After the unit heads send their budget proposals to upper management, upper management reviews the individual budgets and may ask for adjustments. And the negotiating process continues back and forth until a final master budget is achieved. The key to success in this and other budgeting processes is communication. Senior management has to communicate strategic goals in a way that makes sense. In turn, the unit heads communicate their resource needs and concerns when presenting budget proposals to management. All participants in the budget process have an obligation to listen to the various and sometimes conflicting positions.
Slack
Budgetary slack, or padding, occurs when managers believe they are going to be evaluated on their performance relative to the budget. To ensure that they will achieve their budgeted figures and be rewarded, they budget revenues conservatively or exaggerate anticipated costs, or do both. Both actions make the budget “game” easier to win. Budgetary slack also provides these managers with a hedge against unexpected problems, reducing the risk that they will fail to “make their numbers.” It’s an old game that managers at all levels learn to play. The big losers, of course, are the owners of the business.
What-If Scenarios and Sensitivity Analysis
Budgets are only as good as the future assumptions on which they are based. But assumptions are often wrong. We assume that customer A will purchase ten thousand units from us next year—and we have the sales agreement to back it up. But if customer A experiences a major business collapse, then that sales agreement isn’t worth much. We assume that our energy bills will increase at roughly the current rate of inflation. But guess what? A cold winter and huge demand for energy could push prices through the roof.
Sensitivity analysis is an approach to dealing with assumptions and alternative options. As a budgetary tool, this analysis can greatly enhance the value of budgets as instruments for planning, feedback, and course correction. A sensitivity analysis applies a what-if situation to the budget model to see the effect of the potential change on the original data. For example, what if the cost of materials rises 5 percent, or what if sales rise 10 percent? Software packages for financial planning are available and commonly used to perform these calculations, giving managers a powerful tool to estimate the costs and benefits of various options and possibilities.
For example, if the Moose Head division wanted to test its assumptions with what-if scenarios, it could determine the effect of some likely alternative scenarios (table 13-4).Given the results of these analyses, Claude Cervidés may decide to direct his efforts toward lowering materials costs to achieve the best bottom-line result.
Tips for Effective Budgeting
If you want to use budgeting as a planning and team-building tool, you need to develop a game plan. Even if you recently finished this year’s budget, it’s not too early to start thinking about next year. Here are a few points to keep in mind:
- If you’re a new manager, become familiar with your company’s budgeting process.
- Spend time learning and understanding company priorities, as well as helping your team understand them.
- Make sure that any request for funds is in sync with the objectives set by senior management.
- Determine your unit’s cost per output, however defined.
- Ask for volunteers to research line items. This will make your job easier and give subordinates opportunities to learn about the budgeting process.
- If you need to reduce costs, identify the activities that add value for the customer and those that don’t. Analyze the cost of each, and begin by cutting non-value-added activities.
- Show how your budget request will generate income for the company. In other words, your budget should not be so much a request for funds as a proposal showing how you will help the company realize its goals.
TABLE 13-4: Moose Head Division, Amalgamated Hat Rack, Sensitivity Analysis of Several Options
| What-If Scenarios | Units Sold | Direct Materials Cost | Operating Income |
|---|---|---|---|
| Budget model | 21,400 | $214,000 | $383,950 |
| Scenario 1: increase unit sales 10% | 23,540 | $235,000 | $422,730 |
| Scenario 2: decrease unit sales 5% | 20,330 | $203,300 | $360,900 |
| Scenario 3: decrease materials cost 5% | 21,400 | $203,300 | $398,700 |
Source: HMM Budgeting
Summing Up
- The four basic functions of budgets are planning, coordinating and communicating, monitoring progress, and evaluating performance.
- Budgets help an organization move forward and keep on track. And they make the time and trouble associated with budgeting worthwhile.
- The master budget brings together operating and cash budgets and various financial projections into a comprehensive picture.
- What-if scenarios and sensitivity analysis can help budget makers predict the effects of specific changes in any important assumptions built in to the budget.

Budgeting Basics and Beyond (4th ed.)
Jae K Shim, Joel G Siegel and Allison Shim
John Wiley and Sons
Hoboken, NJ, 2011
PGS 95 – 118
Master Budget—Genesis of Financial Forecasting and Profit Planning
Overview
A comprehensive—master—budget is a formal statement of management's expectations regarding sales, expenses, volume, and other financial transactions for the coming period. It consists basically of a pro forma income statement, pro forma balance sheet, and cash budget.
At the beginning of the period, the budget is a plan or standard. At the end, it serves as a control device to help management measure its performance against the plan so that future performance may be improved.
With the aid of computer technology, budgeting can be used as an effective device for evaluation of what-if scenarios. Management can find the best course of action among various alternatives through simulation. If management does not like what it sees on the budgeted financial statements in terms of financial ratios such as liquidity, activity (turnover), leverage, profit margin, and market value ratios, it can always alter its contemplated decision and planning set.
The budget is classified broadly into two categories:
- Operating budget
- Financial budget
The operating budget consists of:
- Sales budget
- Production budget
- Direct materials budget
- Direct labor budget
- Factory overhead budget
- Selling and administrative expense budget
- Pro forma income statement
The financial budget consists of:
- Cash budget
- Pro forma balance sheet
The five major steps in preparing the budget are:
- Prepare a sales forecast.
- Determine expected production volume.
- Estimate manufacturing costs and operating expenses.
- Determine cash flow and other financial effects.
- Formulate projected financial statements.
Exhibit 6.1 presents a master budget.
COMPREHENSIVE SALES PLANNING
Chapter 5 gave an overview of a comprehensive profit plan. The initiating management decisions in developing the plan were the statements of broad objectives, specific goals, basic strategies, and planning premises. The sales planning process is a necessary part of profit planning and control because (1) it provides for the basic management decisions about marketing and (2), based on those decisions, it is an organized approach for developing a comprehensive sales plan. If the sales plan is not realistic, most if not all of the other parts of the overall profit plan also are not realistic. Therefore, if management believes that a realistic sales plan cannot be developed, there is little justification for profit planning and control. Despite the views of a particular management, such a conclusion may be an implicit admission of incompetence. Simply put, if it were really impossible to assess the future revenue potential of a business, there would be little incentive for investment in the business initially or for its continuation, except for purely speculative ventures that most managers and investors prefer to avoid.
The primary purposes of a sales plan are (1) to reduce uncertainty about the future revenues, (2) to incorporate management judgments and decisions into the planning process (e.g., in the marketing plans), (3) to provide necessary information for developing other elements of a comprehensive profit plan, and (4) to facilitate management's control of sales activities.

Sales Planning Compared with Forecasting
Sales planning and forecasting often are confused. Although related, they have distinctly different purposes. A forecast is not a plan; rather it is a statement and/or a quantified assessment of future conditions about a particular subject (e.g., sales revenue) based on one or more explicit assumptions. A forecast should always state the assumptions on which it is based. A forecast should be viewed as only one input into the development of a sales plan. The management of a company may accept, modify, or reject the forecast. In contrast, a sales plan incorporates management decisions that are based on the forecast, other inputs, and management judgments about such related items as sales volume, prices, sales effects, production, and financing.
Testing the Top Line
Most companies do not really manage top-line growth. They allocate resources to businesses they think will be most productive and hope the economy cooperates. But a growing number of companies are taking a less passive approach and studying revenue growth more carefully. They argue that quantifying the sources of revenue can yield a wealth of information, which results in more targeted and more effective decision making. With the right discipline and analysis, they say, growing revenues can be as straightforward as cutting costs. Some companies go so far as to link the two efforts. The idea is to bring the same systematic analysis to growing revenue that we have brought to cost cutting.
A sources-of-revenue statement (SRS) is useful in this effort. The information on revenue captured by traditional financial statements is woefully inadequate. Sorting revenues by geographic market, business unit, or product line tells the source of sales. But it does not explain the underlying reason for those sales.
The SRS model breaks revenue into five categories:
- Continuing sales to established customers (known as base retention)
- Sales won from the competition (share gain)
- New sales from expanding markets
- Moves into adjacent markets where core capabilities can be leveraged
- Entirely new lines of business unrelated to the core
To produce an SRS statement, five steps are required in addition to establishing total revenues for comparable periods, as is commonly done for purposes of completing an income statement:
- Determine revenue from the core business by establishing the revenue gain or loss from entry to or exit from adjacent markets and the revenue gain from new lines of business, and subtracting this from total revenue.
- Determine growth attributable to market positioning by estimating the market growth rate for the current period and multiplying this by the prior period's core revenue.
- Determine the revenue not attributable to market growth by subtracting the amount determined in Step 2 from that determined in Step 1.
- To calculate base retention revenue, estimate the customer churn rate, multiply it by the prior period's core revenue, and deduct this from the prior period's core revenue.
- To determine revenue from market-share gain, subtract retention revenue, growth attributable to market positioning, and growth from new lines of business and from adjacent markets from core revenue
Example 1
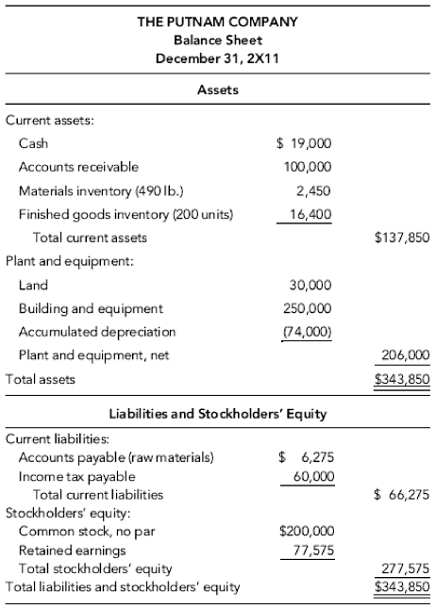
To illustrate how all these budgets are put together, we will focus on a manufacturing company called the Putnam Company, which produces and markets a single product. The budget process to be used in this chapter is often called functional budgeting because the focus is on preparing budgets by function, such as manufacturing, selling, and general and administrative support.
We will make these assumptions:
- The company uses a single material and one type of labor in the manufacture of the product.
- It prepares a master budget on a quarterly basis.
- Work-in-process inventories at the beginning and end of the year are negligible and are ignored.
- The company uses a single cost driver—direct labor hours (DLH)—as the allocation base for assigning all factory overhead costs to the product.
SALES BUDGET
The sales budget is the starting point in preparing the master budget, since estimated sales volume influences nearly all other items appearing throughout the master budget. The sales budget should show total sales in quantity and value. The expected total sales can be break-even or target income sales or projected sales. It may be analyzed further by product, by territory, by customer, and, of course, by seasonal pattern of expected sales.
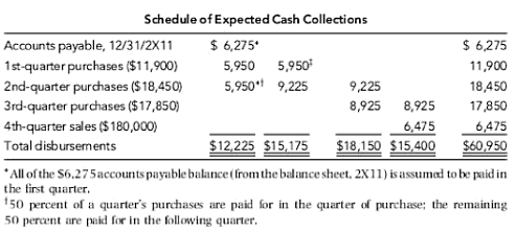
Generally, the sales budget includes a computation of expected cash collections from credit sales, which will be used later for cash budgeting.
Schedule 1
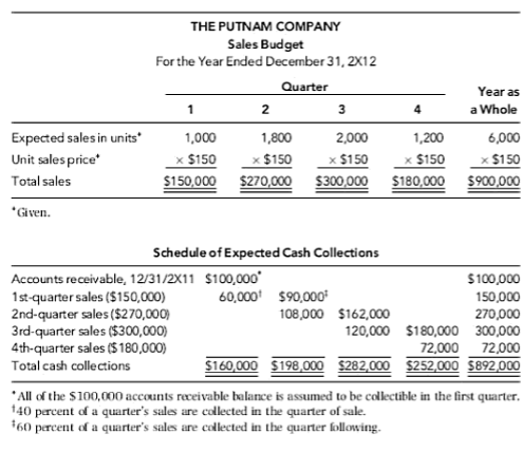
MONTHLY CASH COLLECTIONS FROM CUSTOMERS
Frequently, there are time lags between monthly sales made on account and their related monthly cash collections. For example, in any month, credit sales are collected in this manner: 15 percent in month of sale, 60 percent in the following month, 24 percent in the month after, and the remaining 1 percent are uncollectible.
| April-Actual | May-Actual | June-Budgeted | July-Budgeted | |
| Credit sales | $320 | $200 | $300 | $280 |
The budgeted cash receipts for June and July are computed:
| For June: | ||
| From April sales | $320 × 0.24 | $76.80 |
| From May sales | $200 × 0.6 | $120.00 |
| From June sales | $300 × 0.15 | $45.00 |
| Total budgeted collections in June | $241.80 | |
| For July: | ||
| From May sales | $200 × 0.24 | $48.00 |
| From June sales | $300 × 0.6 | $180.00 |
| From July sales | $280 × 0.15 | $42.00 |
| Total budgeted collections in July | $270.00 | |
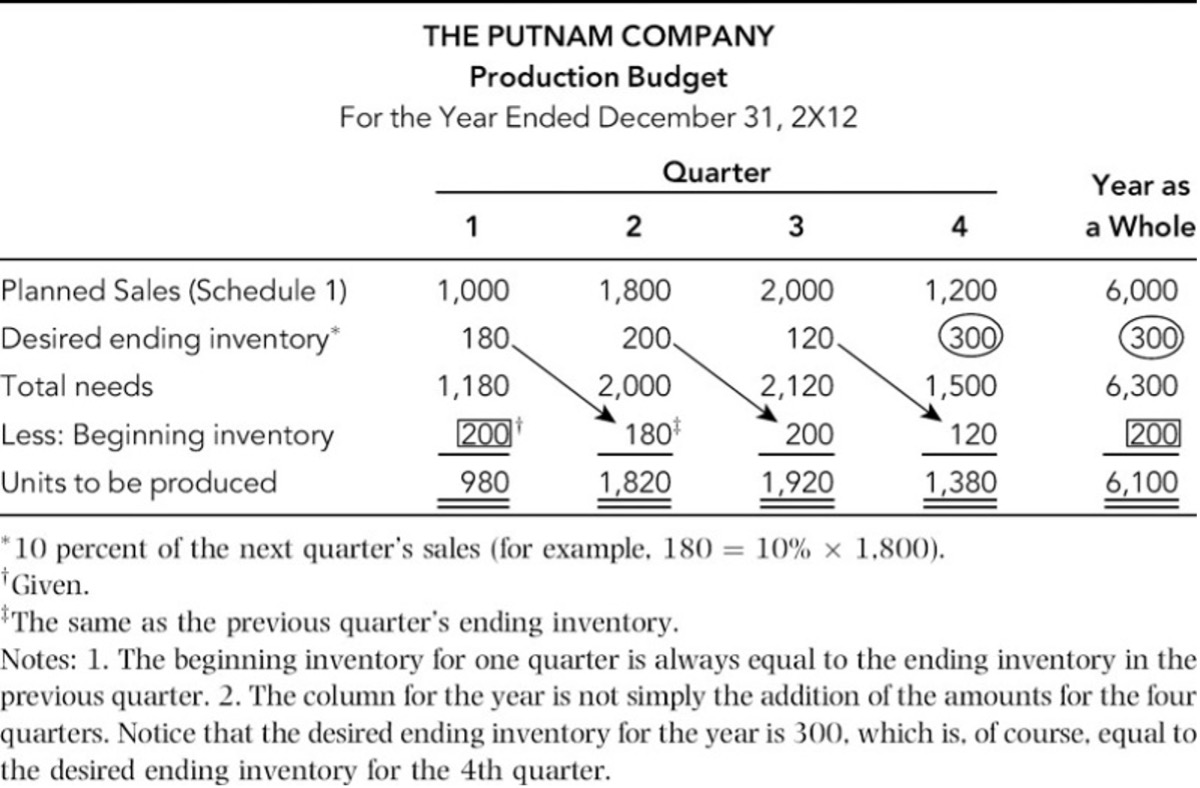
PRODUCTION BUDGET
After sales are budgeted, the production budget can be determined. The production budget is a statement of the output by product and is generally expressed in units. It should take into account the sales budget, plant capacity, whether stocks are to be increased or decreased, and outside purchases.
The number of units expected to be manufactured to meet budgeted sales and inventory requirements is set forth in the production budget. In the just-in-time (JIT) firm, there are no inventory requirements, since a customer triggers production. Note that the production budget is expressed in terms of units. At this juncture, we do not know how much they will cost.
Expected production volume = Planning sales + Desired ending inventory – Beginning inventory
The production budget is illustrated in Schedule 2.
Schedule 2
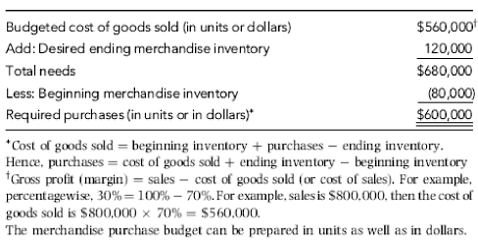
INVENTORY PURCHASES, MERCHANDISING FIRM
Putnam Company is a manufacturing firm, so it prepares a production budget, as shown in Schedule 2. If the company were a merchandising (retailing or wholesaling) firm, then instead of a production budget, it would develop a merchandise purchase budget showing the amount of goods to be purchased from its suppliers during the period. The merchandise purchases budget is in the same basic format as the production budget, except that it shows goods to be purchased rather than goods to be produced:
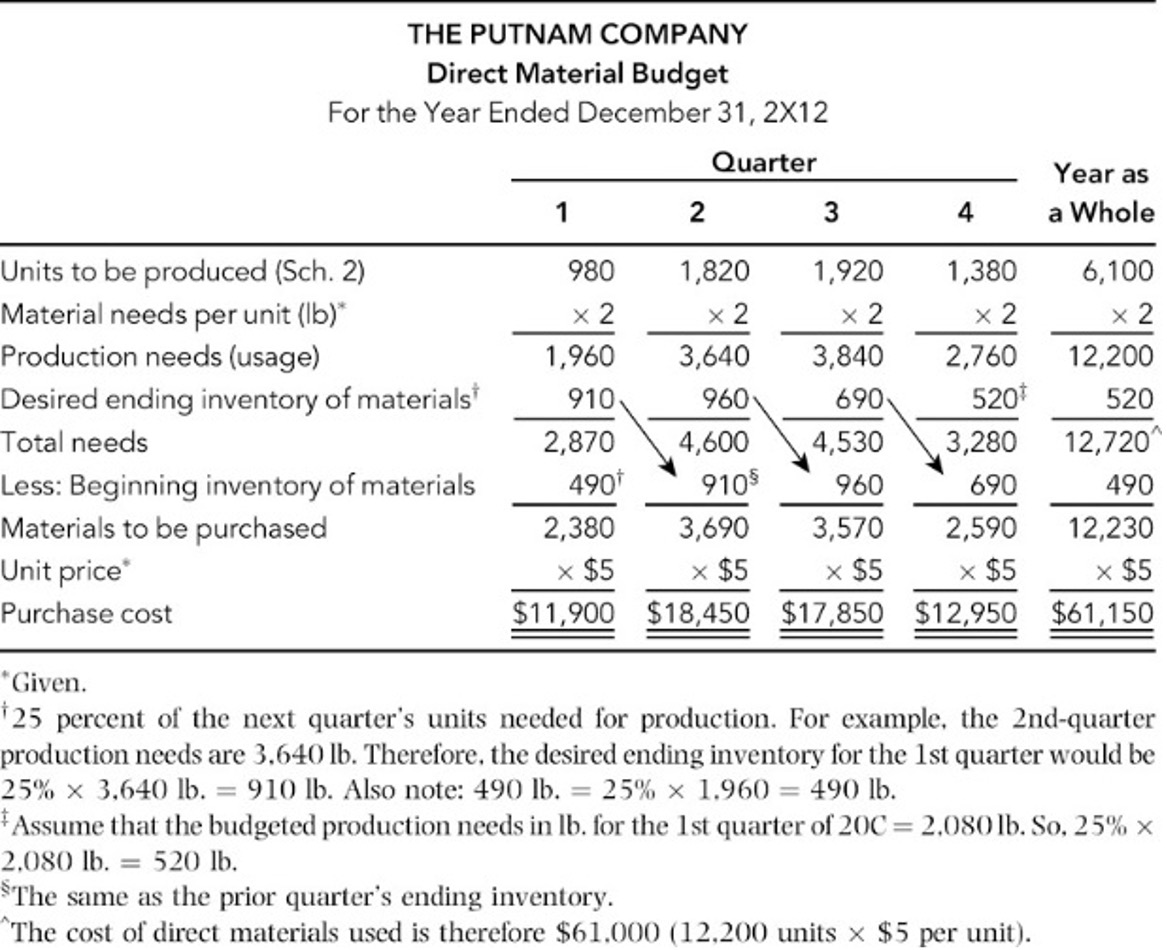
DIRECT MATERIAL BUDGET
When the level of production has been computed, a direct material budget should be constructed to show how much material will be required for production and how much material must be purchased to meet this production requirement. It also tells the cost of direct materials to be purchased, which is needed later for a cash budgeting purpose.
The purchase will depend on both expected use of materials in production and the materials inventory needs of the firm. The formula for computation of the purchase is:
Purchase in units = Direct materials needed for production + Desired material inventory units – Beginning inventory units
The desired ending inventory is determined by the firm's inventory policy. The direct material budget is usually accompanied by a computation of expected cash payments for materials.
Schedule 3
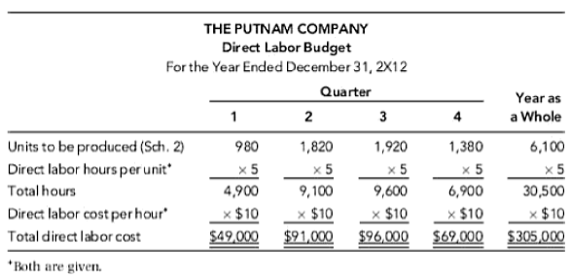
DIRECT LABOR BUDGET
Schedule 4
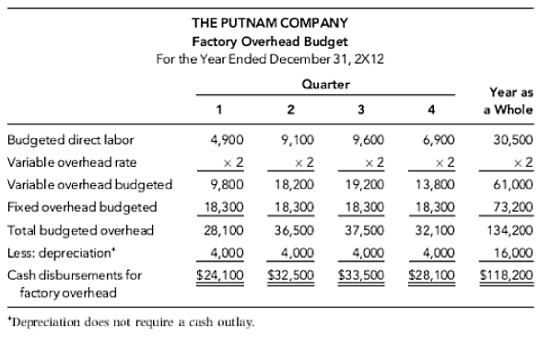
FACTORY OVERHEAD BUDGET
The factory overhead budget should provide a schedule of all manufacturing costs other than direct materials and direct labor, namely, indirect manufacturing costs.
Unlike direct materials and direct labor, there is no readily identifiable input-output relationship for overhead items. Recall, however, factory overhead consists of two types of costs: variable and fixed. Past experience can be used as a guide. To illustrate the factory overhead budget, we will assume that:
- Total factory overhead budgeted = $18,300 fixed (per quarter), plus $2 per hour of direct labor. This is one example of a cost-volume (or flexible budget) formula (Y = a + bX), developed via the least-squares method with a high R2.
- Depreciation expenses are $4,000 each quarter. Note that depreciation does not entail a cash outlay and therefore must be deducted from the total factory overhead in computing cash disbursement for factory overhead.
- Overhead costs involving cash outlays are paid for in the quarter incurred.
Schedule 5
To illustrate the factory overhead budget, we will assume that:
- Total factory overhead budgeted = $18,300 fixed (per quarter), plus $2 per hour of direct labor. This is one example of a cost-volume (or flexible budget) formula (Y = a + bX), developed via the least-squares method with a high R2.
- Depreciation expenses are $4,000 each quarter.
- Overhead costs involving cash outlays are paid for in the quarter incurred.
Schedule 5
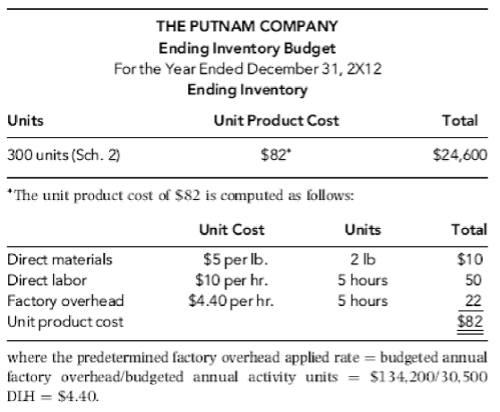
ENDING FINISHED GOODS INVENTORY BUDGET
The ending finished goods inventory budget provides us with the information required for the construction of budgeted financial statements. After completing Schedules 1 through 5, sufficient data will have been generated to compute the per-unit manufacturing cost of finished product. This computation is required for two reasons: (1) to help compute the cost of goods sold on the budgeted income statement and (2) to give the dollar value of the ending finished goods inventory to appear on the budgeted balance sheet. The unit manufacturing cost and the dollar value of the desired ending inventory are shown in Schedule 6.
Schedule 6
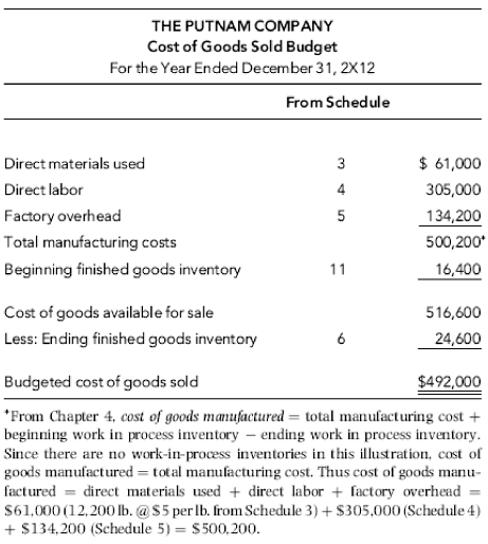
THE COST OF GOODS SOLD BUDGET
Assuming that the beginning finished goods inventory is valued at $26,400 (Schedule 11), the budgeted cost of goods sold schedule can be prepared using Schedules 3, 4, 5, and 6. The cost of goods sold schedule (Schedule 7) will be used as an input for the budgeted income statement.
Schedule 7
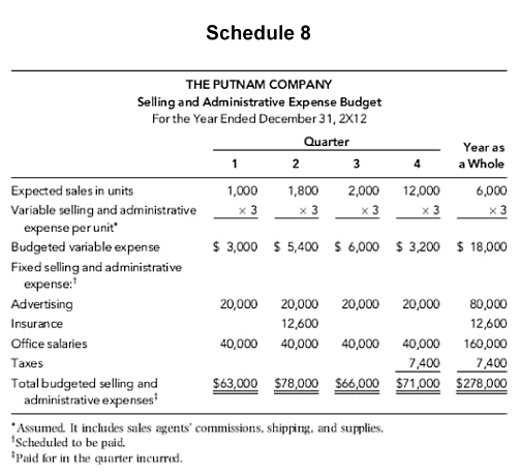
SELLING AND ADMINISTRATIVE EXPENSE BUDGET
The selling and administrative expense budget lists the operating expenses involved in selling the products and in managing the business. Just as in the case of the factory overhead budget, selling and administrative expenses can be broken down into variable and fixed components. Such items as sales commissions, freight, and supplies vary with sales activity. Just as in the case of the factory overhead budget, this budget can be developed using the cost-volume (flexible budget) formula in the form of Y = a + bX. If the number of expense items is very large, separate budgets may be needed for the selling and administrative functions. The selling and administrative expense budget is illustrated in Schedule 8.
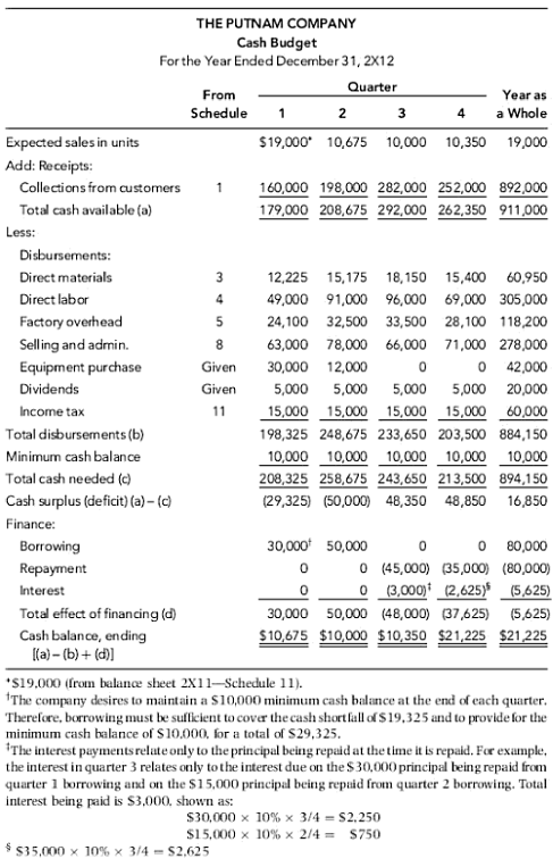
CASH BUDGET
The cash budget is prepared for the purpose of cash planning and control. It presents the expected cash inflow and outflow for a designated time period. The cash budget helps management keep cash balances in reasonable relationship to its needs. It aids in avoiding unnecessary idle cash and possible cash shortages. The cash budget consists typically of five major sections:
- The cash receipts section, which is cash collections from customers and other cash receipts, such as royalty income and investment income.
- The cash disbursements section, which comprises all cash payments made by purpose.
- The cash surplus or deficit section, which simply shows the difference between the total cash available and the total cash needed, including a minimum cash balance if required. If there is surplus cash, loans may be repaid or temporary investments made.
- The financing section, which provides a detailed account of the borrowings, repayments, and interest payments expected during the budgeting period.
- The investments section, which encompasses investment of excess cash and liquidation of investment of surplus cash.
Schedule 9
To illustrate the cash budget, we make these assumptions:
- Putnam Company has an open line of credit with its bank, which can be used as needed to bolster the cash position.
- The company desires to maintain a $10,000 minimum cash balance at the end of each quarter. Therefore, borrowing must be sufficient to cover the cash shortfall and to provide for the minimum cash balance of $10,000.
- All borrowings and repayments must be in multiples of $1,000 amounts, and interest is 10 percent per annum.
- Interest is computed and paid on the principal as the principal is repaid.
- All borrowings take place at the beginning of a quarter, and all repayments are made at the end of a quarter.
- No investment option is allowed in this example. The loan is self-liquidating in the sense that the borrowed money is used to obtain resources that are combined for sale, and the proceeds from sales are used to pay back the loan.
Note
To be useful for cash planning and control, the cash budget must be prepared on a monthly basis.
Also note,

Schedule 9
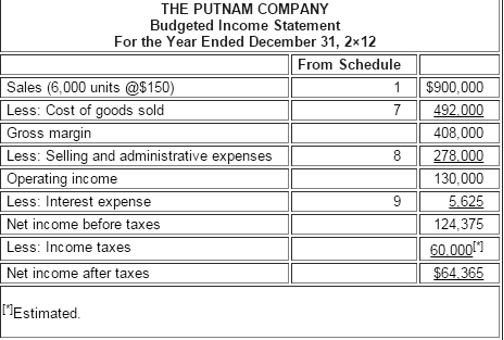
BUDGETED INCOME STATEMENT
The budgeted income statement summarizes the various component projections of revenue and expenses for the budgeting period. However, for control purposes, the budget can be divided into quarters or even months, depending on the need. The budgeted income statement is illustrated in Schedule 10
Schedule 10
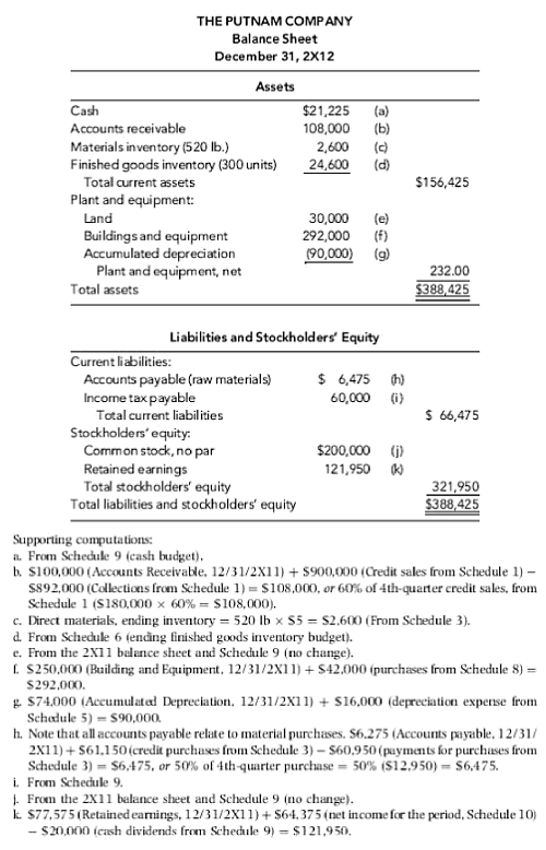
BUDGETED BALANCE SHEET
The budgeted balance sheet is developed by beginning with the balance sheet for the year just ended and adjusting it, using all the activities that are expected to take place during the budgeting period. Some of the reasons the budgeted balance sheet must be prepared are:
- It could disclose some unfavorable financial conditions that management might want to avoid.
- It serves as a final check on the mathematical accuracy of all the other schedules.
- It helps management perform a variety of ratio calculations.
- It highlights future resources and obligations.
We can construct the budgeted balance sheet by using:
- The December 2×11 balance sheet (Schedule 11)
- The cash budget (Schedule 9)
- The budgeted income statement (Schedule 10)
Putnam's budgeted balance sheet for December 31, 2×12, is presented next. Supporting calculations of the individual statement accounts are also provided.
Schedule 11
To illustrate, we will use this balance sheet for the year 2×11.
Schedule 11
SOME FINANCIAL CALCULATIONS
To see what kind of financial condition the Putnam Company is expected to be in for the budgeting year, a sample of financial ratio calculations is in order. (Assume 2×11 after-tax net income was $45,000.)
| Current Ratio | 2X11 | 2X12 |
|---|---|---|
| (Current Assets / Current Liabilities) | $137,850/$66,275 = 2.08 | $156,425/$66,475 = 2.35 |
| Return on Total Assets | ||
| (Net Income after Taxes / Total Assets) | $45,000/$343,850 = 13.08% | $64,375/$388,425 = 16.57% |
Sample calculations indicate that the Putnam Company is expected to have better liquidity as measured by the current ratio. Overall performance will be improved as measured by return on total assets. This could be an indication that the contemplated plan may work out well.
USING AN ELECTRONIC SPREADSHEET TO DEVELOP A BUDGET PLAN
Schedules 1 to 11 showed a detailed procedure for formulating a master budget. In practice, a common shortcut uses computer technology. With a spreadsheet program, managers will be able to develop a master budget and evaluate various what-if scenarios.
FINANCIAL FORECASTING: THE PERCENT-OF-SALES METHOD
Financial forecasting, an essential element of planning, is the basis for budgeting activities. It is also needed when estimating future financing requirements. The company may look either internally or externally for financing. Internal financing refers to cash flow generated by the company's normal operating activities. External financing refers to capital provided by parties external to the company. You need to analyze how to estimate external financing requirements. Basically, forecasts of future sales and related expenses provide the firm with the information to project future external financing needs.
The four basic steps in projecting financing needs are:
- Project the firm's sales. The sales forecast is the initial most important step. Most other forecasts (budgets) follow the sales forecast.
- Project additional variables such as expenses.
- Estimate the level of investment in current and fixed assets required to support the projected sales.
- Calculate the firm's financing needs.
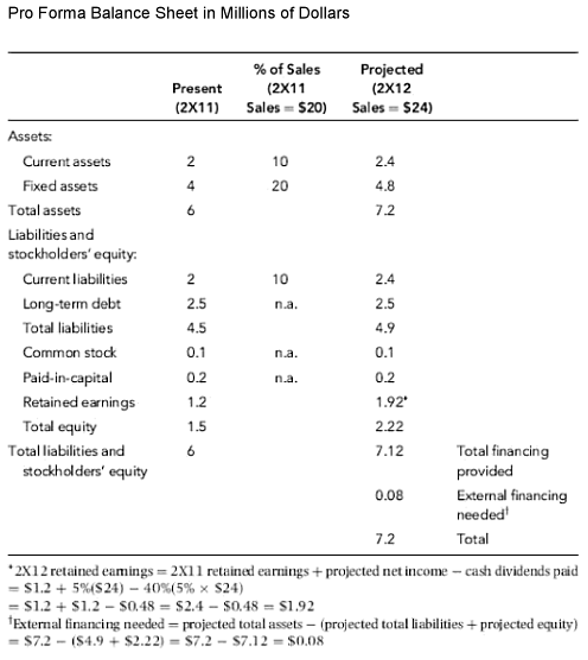
The most widely used method for projecting the company's financing needs is the percent-of-sales method. This method involves estimating the various expenses, assets, and liabilities for a future period as a percent of the sales forecast and then using these percentages, together with the projected sales, to construct forecasted balance sheets. The following example illustrates how to develop a pro forma balance sheet and determine the amount of external financing needed.
Example 2
Assume that sales for 2×11 = $20, projected sales for 2×12 = $24, net income = 5 percent of sales, and the dividend payout ratio = 40 percent. Schedule 11 illustrates the method, step by step. All dollar amounts are in millions.
The steps for the computations are outlined as follows:
Step 1. Express those balance sheet items that vary directly with sales as a percentage of sales. Any item such as long-term debt that does not vary directly with sales is designated n.a. (not applicable).
Step 2. Multiply these percentages by the 2×12 projected sales = $24 to obtain the projected amounts as shown in the last column.
Step 3. Simply insert figures for long-term debt, common stock, and paid-in-capital from the 2×11 balance sheet.
Step 4. Compute 2×12 retained earnings as shown in (b).
Step 5. Sum the asset accounts, obtaining total projected assets of $7.20, and also add the projected liabilities and equity to obtain $7.12, the total financing provided. Since liabilities and equity must total $7.20, but only $7.12 is projected, we have a shortfall of $0.08 "external financing needed."
The major advantage of the percent-of-sales method of financial forecasting is that it is simple and inexpensive to use. One important assumption behind the use of the method is that the firm is operating at full capacity. This means that the company does not have sufficient productive capacity to absorb a projected increase in sales and thus requires additional investment in assets. Therefore, the method must be used with extreme caution if excess capacity exists in certain asset accounts.
To obtain a more precise projection of the firm's future financing needs, however, the preparation of a cash budget (to be discussed in detail in Chapter 17) is required.
Schedule 12
SUMMARY
Forecasting is an essential element of planning and budgeting. Forecasts of future sales and their related expenses provide managers with information needed to plan other activities of the business.
This chapter has emphasized budgets. The process involves developing a sales forecast and, based on its magnitude, generating those budgets needed by a specific firm. Once developed, the budgeting system provides nonfinancial management with a means of controlling their activities and of monitoring actual performance and comparing it with budget goals.
Budgeting can be done easily with the aid of electronic spreadsheet software. Many specialized application programs are available.

Seven Steps to a Successful Business Plan
Al Coke
AMACOM
New York, NY, 2002
PGS 297 – 304
Contingency Planning: How to Prepare for the Unexpected
Contingency planning is the fifth of the five types of business plans (see Figure 11-1). While it is very important, it is also one of the most neglected elements of a business plan. Because so much energy is put into the basic strategic and operational plans, planning teams seldom give attention to a portion of the total plan that could put a company out of business. This chapter presents two types of contingency planning. The first is long-term, true contingency planning that is designed to counter deviations from your business plans when your assumptions fail. The second is more common and comes quickly to mind. This is disaster planning or crisis management planning, both of which are in vogue with cur-rent business and social trends.
For those planners who would tend to stop reading at this point, let me emphasize again the need to be prepared for the future. No one can predict the future but we can be prepared for it. General Norman Schwarzkopf had this to say about prediction: "The future is not always easy to predict and our record regarding where we will fight future wars is not the best. If someone had asked me on the day I graduated from West Point, in June 1956, where I would fight for my country during my years of service, I'm not sure what I would have said. But I'm damn sure I would not have not said Vietnam, Grenada, and Iraq."' Like all thinking executives, the general didn't sit around unprepared. Over a long and successful career he perfected his skills as a leader, a manager, and a warrior. When the day came for his country to call upon his services he was prepared. His execution of Desert Storm places him in the history books with five-star col-leagues such as "Black Jack" Pershing, Dwight D. Eisenhower, and Douglas MacArthur.

Contingency Planning: Preparing for an Unpredictable Future
Contingency planning is being prepared. It is actually that simple. Philip Crosby said it with a little more eloquence: "The centurions will have to learn how to manage so that they can deal with what-ever happens, and at the same time, anticipate what is coming. They will have to be in a permanent situation of awareness in order to tell the difference between fads and reality." One of the earlier strategic planning gurus, George Steiner, also uses a simple but elegant explanation. He defines contingency planning as ". . . preparations to take specific actions when an event or condition not planned for in the formal planning process actually does not take place."' If we listen to Steiner, anything that falls outside the conditions or goals of your strategic and operational plans should be considered a condition for contingency planning.
This business planning model goes one step further. Contingency planning is not outside your planning process. It is a critical component found inside the planning process to position your plan in case of deviation. "The fundamental purpose of contingency planning is to place managers in a better position to deal with unexpected developments than if they had not made such preparations."' Without this preparation managers are always in a reactive mode.
The Five Key Terms Used in Contingency Planning
Early in this chapter we need to sort definitions to ensure we are not talking at cross-purposes with definitions. There are a number of terms to be used when writing about activities that cause deviation from the plan. Some of them and their definitions are: [see table below]
The Two Common Ways That Plans Run Amiss
This business planning cycle and model uses contingency planning as the overall umbrella term to describe what has to be done. The range of contingency situations you'll face can be broken down into two categories, each of which seems to be connected to the time period involved. Trend deviation is connected to the strategic portion of your business plan whereas the crisis element seems to be connected to the tactical or operational plan because of its short-term orientation. A full range of the model is shown in Figure 11-2.
| Term | Definition |
|---|---|
| Contingency Planning | The overall activity that looks at the complete situation and plans accordingly. |
| Contingency Plan | The documentation of contingency planning, it is the hard copy of your thinking and intentions. |
| Crisis Management | Actions you take to manage the total environment when facing a disruptive situation. |
| Crisis Intervention | Actions taken to correct a developing situation. As the name implies, there must be an entry into the process of the situation. |
| Disaster Plan | A step-by-step plan of action available for immediate implementation in times of crisis or disaster. |
Trend Deviation: When You Miss the Mark
One type of deviation is experienced when the results of your planning are not developing as you expected. Bluntly speaking, you are missing the mark. You may not be hitting your sale goals because of internal company behavior; maybe management is not performing. Another reason could be due to outside influences. Still a third rea-son is that the market is moving in a different direction from what you assumed, expected, or planned for. In any case your plan is in trouble.
Crises: Circumstances beyond Your Control
A second major type of deviation is the abrupt or sudden disruption of your plan because of circumstances or events usually beyond your control. These crises are usually related to natural disasters and catastrophic events. These situations are usually the ones that come to mind when we think of disruptions and dangers to order and stability.
The Nine Critical Components of a Successful Contingency Plan
Certain considerations are important when facing a deviation from plan over a longer period of time; others become especially important when in a crisis mode. These nine components must be reviewed in a contingency situation no matter what triggered the requirement. In developing your contingency reactions, ask the following questions:
- Facilities. Will you have enough physical support? Are your warehouses and offices located in the right places?
- People. Will you have enough people with the right core competencies to carry on the work? What will be the burnout time for people who must work around the clock?

- Information. Do you have enough facts to make decisions? How risky is it to initiate actions on what information is available? Are you able to get the information you need?
- Time. How fast must you react to the situation before it gets even worse?
- Image. What must you do to protect the public perception of your company during the situation?
- Technology. Can you leverage technology as a replacement for time or people?
- Tools and Equipment. What special tools are needed to carry out your mission? Is any special equipment needed? Where and when will the tools and equipment be needed?
- Leadership and Managership. What leadership and managership behaviors are needed to instil the confidence of the public in your company?
- Assumptions. What assumptions have failed, requiring you to take action? What is the antidote for these best guesses you have made about your business?
The Two Tough Questions for Targeting Potential Problems
When preparing a contingency plan the management team must consider all possibilities and potential target areas, then cut the list down to what is reasonable, realistic, and practical. To start the review, the team asks itself two very hard questions:
- What is the one thing that could put us out of business? Every organization has a weak spot or area of potential danger. Look for the one thing considered the most dangerous to your operation. Account for this happening in your contingency plan. If you work in the software business, a new code or program could put you out of business.
- What is the one thing that could seriously damage our business? There are other events that will not bankrupt you but can nonetheless do enormous damage to your ability to conduct business. Each of these must be accounted for in your contingency planning. Write specific situations and actions for these variations. An example might be when funding for a project is not approved by the board of directors.
A good technique is to conduct a think tank or "blue sky" session to get the management team to examine the problem. A week-end retreat in a nice creative environment would be a way to get the creative juices flowing and out-of-the-box thinking to occur. Think how powerful a two-question agenda could be for the participants.

Coaching For Peak Employee Performance:
A Practical Guide to Supporting Employee Development (2nd ed.)
Bill Foster and Karen R. Seeker
Richard Chang and Associates
San Francisco, CA, 2004
PGS 37 – 43
Overview
Monitoring your team members' performance is usually the first step in your job as coach. And, it's definitely an important step. You need to observe behaviors before you can diagnose your employees' performance improvement requirements. Think of it in medical terms. Every doctor needs to know a patient's symptoms before she can diagnose an illness.
If you've done your documentation work, you will have documented several specific behaviors for your team members. Those specific behaviors should indicate performance toward their individual objectives. The next questions to ask yourself are:
- Do the behaviors I've listed suggest that this team member can accomplish the performance objective?
- Or, do the behaviors listed suggest that this person needs direction or support from me, the coach?
How you answer determines what you will do next.
Recognizing Behaviors as Deficiencies
If you wish to be an effective coach, you must develop the ability to determine if your employees are demonstrating the capability of achieving their objectives and carrying out their responsibilities. You have to be both observant and insightful. If your team members are struggling, you must be able to provide the appropriate level and type of support they need. Remember, this is the primary function of the coach—to help your team win. You're only as strong as your weakest link.
Before you can offer the appropriate direction or support, you must first understand and diagnose the type of problem each employee is facing. If a team member is not performing as well as needed, any number of reasons may be responsible. For instance, the team member may not:
- Understand how to find the information he needs
- Have the competence to complete the task
- Have access to a complete set of directions
- Want to do the assignment in the way it was designed
- Believe the task is valued in the organization
- Have the ability to complete the assignment
In each of these situations, the reason for the employee not performing differs. Reasons for (or causes of) poor performance are sometimes referred to as "deficiencies." Deficiencies usually tend to fall into one or more of four categories:
- Lack of knowledge
- Lack of skill
- Lack of motivation
- Lack of confidence
In addition, your employees may be restricted by other types of deficiencies which contribute to poor performance, but which cannot be resolved through coaching. Examples include:
- Lack of technology
- Lack of policies/procedures
- Lack of vision/strategic intent of the organization
- Lack of tools
In these instances, you can request additional resources or recommend that upper management provide more guidance. However, in the categories of knowledge, skills, motivation, and confidence, it's up to you to provide specific coaching expertise that will help your team members reach peak performance. It is your job as coach to determine which category best applies and to what extent the employee is demonstrating deficient (or outstanding) behaviors related to the category.
A correct diagnosis is critical. For example, say that you have scheduled one team member to mentor another because you believe that person doesn't understand how to use the computer software. In reality, however, the team member is not producing the document needed because she is being asked by your boss to produce viewgraphs for his speech instead. In this case, your diagnosis is incorrect, and the mentoring time you've scheduled could very well be a waste of time.
Take a look at the following Performance Progress Sheet that was introduced in the previous chapter [see figure on following page]. If you have completed the monitoring step, you should have documented one or several behaviors by now.
Your next activity is to determine what the behavior you have documented suggests. Specifically, ask yourself the following questions:
- Does the behavior indicate a weakness or a strength?
- Does the behavior tend to suggest a weakness or strength in one or more of the following four categories?
- Knowledge
- Skill
- Motivation
- Confidence
- Where does the behavior fall within the selected category?
- Exceeds expectations
- Meets expectations
- Does not meet expectations
Each type of deficiency has reasons (or causes) as to why it exists. You must first understand what causes the deficiency so you can then provide the "correct" direction and/or support.
Once you have determined that your employee is demonstrating a deficiency, you will need to determine the appropriate category in which it falls.
A supervisor, Nick, thinks one of his team members, Cayla, an order-entry clerk, has an attitude problem.
"No matter how many times I tell Cayla to get me a completed form within twenty minutes of when an order has been placed," Nick explained to a colleague, "she never does. I think she doesn't think it's important. Her attitude needs to change."
In reality, it's not that Cayla views completing the form as a low-priority task (which reflects a motivation deficiency). Cayla doesn't know the products well enough.
Every time an order is placed, she has to go into the warehouse to get information off the product to complete the forms, which adds to the time it takes to complete them. She has a knowledge deficiency, not a motivation deficiency....
Determining the Appropriate Category
Have you documented behavior that indicates a deficiency in knowledge, skill, motivation, or confidence? Perhaps it's a combination of one or more of these, or it could be due to a lack of appropriate tools, technology, vision, or policy. How do you know what is responsible for the deficiency?
First of all, don't assume that the answer will be obvious. In many cases, it is best to sit down with the employee and discuss the behavior, and determine together which is the most appropriate category.
At this point, consider a one-on-one meeting with the team member. Use the Performance Progress Sheet as a tool to drive the discussion. Describe in clear, objective terms the behaviors you have noted (during monitoring), and state in which category you believe the behavior falls. Then ask the team member:
- Why do you think you are having trouble?
- What are some of the factors contributing to the behavior?
- Are there other things that might be getting in your way?
- How do you feel about falling short of this objective?
Understanding the different categories will help guide the discussion in the appropriate direction. Read through the following descriptions of the different categories. You need to know them before you can attempt to diagnose performance requirements.
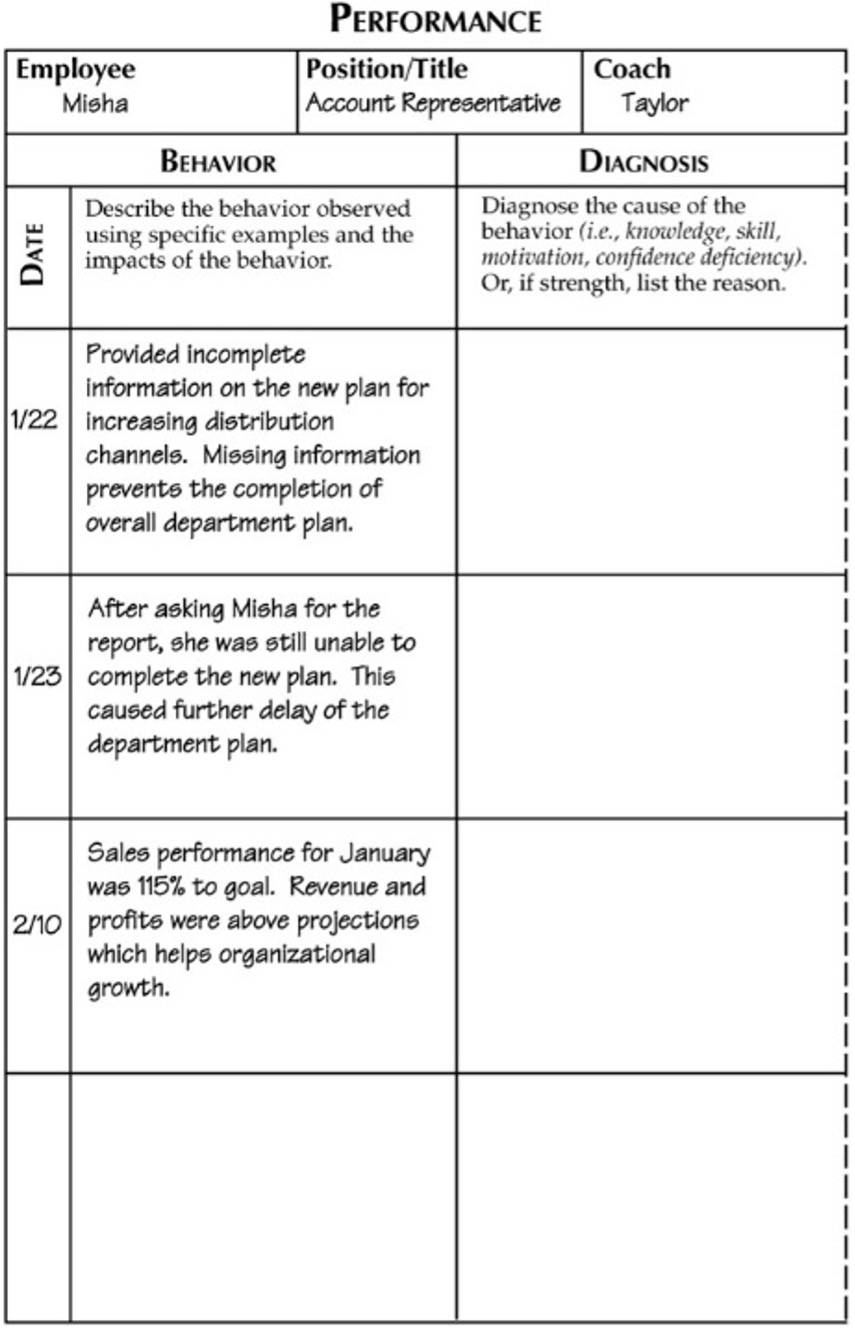
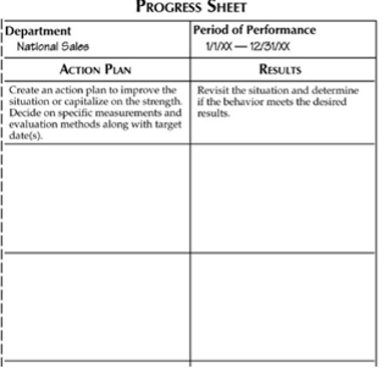
Lack of Knowledge
Knowledge refers to concepts, principles, procedures, policies, or any other information that your team member might need. It also includes the ability to comprehend and apply that information to implement the job responsibilities.
A lack of knowledge means that the employee doesn't know the needed information to do the job, or doesn't know how to carry out the responsibilities. Neither threats nor rewards will make a difference. If your team member's deficiency is due to a lack of knowledge, he simply doesn't know how to fulfill the job requirements, and therefore, cannot.
Clues which indicate a knowledge deficiency include:
- An abundance of questions
- Puzzled looks or expressions
- Spending excessive time researching
- Requesting to partner with another team member who is viewed as an expert in this area
Lack of Skill
The skill category usually refers to the physical ability needed to accomplish or carry out a task or assignment. Even though a person may intellectually understand how to do a job, she might not possess the skills to do it. One of your team members, for example, might understand the inside and outside of a computer (e.g., amount of RAM, size of hard drive, interfacing capability, program commands, etc.), but can't operate it.
The skill category can also refer to technique. For example, the ability to facilitate a group discussion to consensus requires not only the knowledge of good facilitation practices, but also the techniques of managing and directing a group. Techniques such as these must be physically practiced to achieve excellence and, therefore, usually fall into this category.
Clues which indicate a skill deficiency include:
- Visible misuse of tools or equipment
- Inability to use a specific technique
- Not using a new tool immediately
- Not taking advantage of certain features of tools
- Avoiding assignments which require usage of tools and/or techniques
Lack of Motivation
Attitudes and values are many times lumped together in a category called "motivation." It is true that incentives and consequences tend to motivate, and that motivational factors will contribute to employee attitude. Motivation is defined as a person's interest in, and enthusiasm for, the job.
But attitude isn't the only contributor to a lack of motivation. And what is motivational to one person may not be motivational to another. Motivational issues can surface in numerous ways for numerous reasons.
Examples of why an employee may not want to complete a task include:
- The team member doesn't believe she will be viewed as a valuable asset within the organization
- The employee's religion does not allow him to work during certain hours
- The team member feels like he has been manipulated by upper management in taking the assignment
- The employee disagrees with the approach she is being asked to use
- The team member won't personally treat any human being in that manner, even if his manager is insisting
- The employee is being forced to work with another team member with whom she just doesn't get along
- The team member just doesn't find the work interesting.
The types of behavior that fall into this category are those that result because the employee fundamentally disagrees with the assignment in some way. Such behaviors can be difficult to diagnose because they typically require asking a team member to honestly and authentically state why he disagrees with a management request or assignment. This type of self-disclosure is not always comfortable.
On the other hand, some managers tend to jump to the conclusion that an employee has an "attitude problem" whenever an assignment is not completed. Often, that is not the case at all.
With organizations becoming more and more diverse, behaviors which fall into this category become more and more important to recognize. Good coaches flex their styles to accommodate differences, and take the time to adjust assignments accordingly.
Clues which indicate a motivation deficiency include:
- Constantly challenging the assignment
- Demonstrated emotions (tears)
- Disagreements and refusal to do the work
- Comparing the assignment to others' work in the organization
- Continually complaining to other team members
- General lack of enthusiasm or interest for the task
Lack of Confidence
Behaviors in this category are those associated with a fear of failure. Your team member's self-confidence, notion of self-worth, and secure feelings are overtaken by the fear of failure. An individual may have all the knowledge, skills, and even a really positive attitude, but simply cannot make the plunge to take on a particular assignment.
A lack of confidence appears often when a task requires an individual to give presentations. In fact, the fear of presenting is ranked at the top in several well-known lists of greatest fears.
But confidence is needed to carry out any type of job, whether it is a receptionist feeling confident enough to handle all incoming calls, or an astronaut who needs confidence that the landing gear will engage on the space shuttle.
A lack of confidence is a deficiency which can also be directly related to the work environment. Even if your team member enters a job with confidence and self-esteem, that confidence can be eroded or altered in an environment where:
- Fellow workers are not open, honest, or authentic with each other, especially management with staff
- The team member has suffered several repeated small failures
- There exists the constant need to prove oneself before the organization respects one's abilities
- Team interactions demonstrate a lack of trust or a lack of empowerment
Clues which indicate a confidence deficiency include:
- Showing resistance to change or completing the task
- Lack of interaction with others
- Lack of volunteering for new assignments
- Praising others, but discounting oneself
- Preferring roles which are supportive rather than leading
- Completing numerous inconsequential assignments to "look busy" while avoiding the more important and riskier tasks
Directing the Employee
Providing direction is an essential skill of leadership. Good coaches know what type of direction and how much direction each team member requires in order to be a peak performer. The amount of direction you provide is contingent upon the needs of the employee and the needs of the organization at the time. In other words, direction is dependent upon the situation. In some cases, you will need to provide a high amount of direction with specific explanation of how to complete the task or assignment, while at other times you can simply delegate the task with minimal levels of direction.
When directing, good coaches focus on:
- Providing structure in terms of goals and roles
- Organizing the workload according to priorities
- Training team members how to complete the task
- Supervising performance and progress toward task accomplishment
Sometimes, problems may arise as a result of your employees not understanding what you have asked them to do. Perhaps the specific instructions which you gave were not clear, or this particular team member requires more guidance from you than other members of your team.
If, after diagnosing the performance improvement requirement, you determine that the solution is simply the need to clarify your expectations, then restate them clearly and check for understanding. When directing, you must be able to communicate with your employees so that they understand.
To do so, you'll need to develop appropriate skills yourself for providing work direction.
Essential steps for providing work direction include:
- Describe the priority
- Define the resource limitations
- Request the employee's input
- Check for understanding
Take a look at the following descriptions of each step.
- Describe the priority
- Define the assigned project and its "linkages"
- Share your expectations and desired results
- Discuss measurements and methods
- Define the resource limitations
- Consider effects on existing priorities
- Provide guidelines and offer suggestions
- Identify required resources
- Determine authority level
- Agree to time and resource constraints
- Discuss contingency plans
- Request the employee's input
- Solicit ideas and alternatives
- Identify and overcome objections
- Mutually agree on a revised plan
- Check for understanding
- Ask for a restatement of the priority
- Establish follow-up dates to monitor progress
- Determine feedback process
- Be accessible for questions/advice
- Explain why
- Demonstrate trust in employee's abilities
- Gain commitment; reinforce accountability
- Provide feedback and recognition for successes
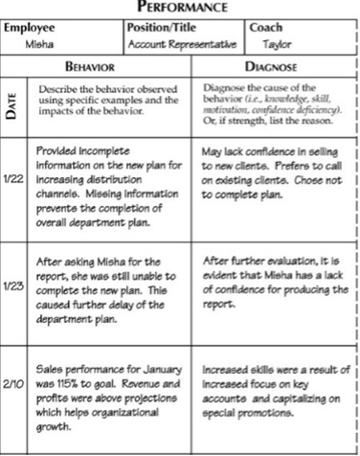
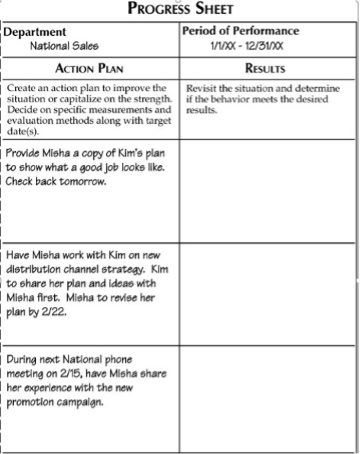
You may find that there are times when no solution or clarification of expectations will work. Sometimes the employee and his job are mismatched. If you discover that your team member doesn't fit his job, then a drastic change is inevitable.
However, the change doesn't necessarily have to be negative. In other words, you don't have to fire every employee who isn't a good match with his or her job. You have many choices for your team member, choices which include:
- A new assignment and/or lateral transfer
- A special assignment opportunity
- A demotion
- A promotion
- Early retirement
- A revised position description
In most organizations a change of this type requires heavy lobbying and paperwork since the change usually will affect another team somewhere in the organization, require a structural change, or require a system change. However, if you desire for your team members to become assets to your organization, you'll find the best place for them.
Janet, the corporate controller for a large manufacturing company, was having difficulty with one of her financial analysts, Donna. "It's not that she's not talented," Janet expressed to Derek, her boss. "She's just unable to deal with our world-wide contacts. Her interpersonal relations with them leaves much to be desired."
Janet tried to improve Donna's interpersonal skills, but Donna's temperament kept getting in the way. Janet discussed the situation with Donna, and together the two of them decided that it would be best if Donna served the company as a regional financial analyst.
"Your contact with people, especially those of other nationalities, will be more limited," Janet explained to her. Donna made the transfer and found herself much better suited to the new position.
Many team members will find these changes to be positive. Promotions can be implemented when employees have simply outgrown their current job responsibilities, and special assignments can be viewed as an "honorary leave of absence" from the daily routine. Even a demotion can be positive, if your team member finds the new position to be less stressful. An effective coach looks to make every situation one in which everyone wins.

Management Accounting Best Practices: A Guide for the Professional Accountant
Steven M Bragg
John Wiley & sons
Hoboken, NJ, 2007
PGS 92 – 109
WHY DO I NEED CONTROLS?
Any company operates under a complex set of policies and procedures that in total comprise a set of processes that ultimately generate revenues and profits. These processes are subject to breakdown at a variety of failure points, either inadvertently or intentionally, through fraud.
We install controls to identify or forestall process failures. A control can itself break down through inattention, lack of formal training or procedures, or intentionally, through fraud. To mitigate these issues, some processes involving especially high levels of asset loss are more likely to require two controls to attain a single control objective, thereby reducing the risk that the control objective will not be attained.
However, double controls are not recommended in most situations, especially if the controls are not automated, since they can increase the cost and duration of the processes they are designed to safeguard. All areas of a company contain some control weaknesses, while some harbor key risk areas, especially the diversion of company assets or misrepresentation of financial results. Of primary concern are those areas where these two issues coincide.
A major risk area is revenue recognition, for there are a variety of ways to manipulate it to improperly accelerate revenues, thereby reporting excessively profitable financial results. Other areas of significant risk are the capitalization of assets and the valuation of such reserves as bad debts, warranty claims, or product returns. Several other high-risk areas are also unrelated to basic process flows: the valuation of acquired assets, related-party transactions, contingent liabilities, and special-purpose entities. Thus, even with in-depth and comprehensive controls over such key processes as purchasing, billings, and cash receipts, there are still significant areas lying outside the traditional control systems that can be easily circumvented.
How Do I Control Order Entry?
Order entry is the initial point at which a customer order enters a company. It is not only the creation of a sales order for distribution throughout the company, but also a number of additional steps: verifying the existence of the customer, ensuring that there is sufficient inventory on-hand to fill the order, and verifying pricing and related order terms.
One significant control for order entry is verifying that the person placing the order is an approved buyer. This control is not frequently used for small orders, since the chances of a control problem are relatively slight in most cases. However, it may be useful when the size of the order being placed is extremely large. Also, review the on-hand status of any inventory being ordered, in case the company would otherwise be committing to an order it cannot ship. If the order entry computer system is linked to the current inventory balance, then the system should warn the order entry staff if there is not a sufficient quantity in stock to fulfill an order, and will predict the standard lead time required to obtain additional inventory. A more advanced level of automation results in the computer system presenting the order entry staff with similar products that are currently in stock, which the staff can present to customers as alternative purchases.
One of the best control improvements that a computer system brings to the order entry process is the ability to automatically set up product prices based on the standard corporate price book. If the information in the price book varies from the price listed on the purchase order, then the order entry staff must either obtain a supervisory override to use the alternative price, or discuss the situation with the customer. If the order entry staff still fills out a sales order based on the customer order, rather than entering this information into the computer for automatic distribution throughout the company, then an additional control is to compare the information on the sales order and originating customer purchase order, to ensure that the order information was transcribed correctly. Finally, when products are returned by customers, it is possible that an error in the order entry or shipment processes caused the return. To investigate this potential problem, compare the return documents with the customer purchase order and sales order.
How Do I Control Credit Management?
The credit management function involves an examination of the finances of customers, to ensure that they are financially capable of paying for any orders that the company ships to them. There is a considerable risk that orders may be shipped in circumvention of the credit management process, so the controls noted below should be considered essential. A mandatory control is to require that all sales orders be sent to the credit department for approval before any shipment is made. It is customary to bypass the credit approval process for small orders, repair and maintenance orders, and when customers have established credit lines with the company. If the order entry system has a workflow management capability, then any orders entered by the order entry staff will be routed to the credit department as soon as the orders are entered.
This control not only speeds up the credit review process, but also ensures that every order entered will be routed to the credit department. This control is typically modified, so that orders falling below a minimum threshold are automatically approved. It is possible for sales orders to be fraudulently routed around the credit department, so create an approval stamp to be used on each sales order. This approval stamp should include space for the signature of the credit manager, and for the date when the approval was granted. The shipping manager should not ship from any sales order that does not contain this signed approval stamp. Also, the credit approval stamp should be locked up when not in use. If an enterprise wide computer system is in use, then the credit department can issue an online approval of a customer order, which the computer system then routes to the shipping department for fulfillment. The beauty of this control is that the shipping staff never sees the customer order until it has been approved, so there is minimal risk of an unapproved order inadvertently being shipped. A serious control problem arises when there is no formal definition of how to calculate a credit limit. This results in widely varying credit levels being granted. To resolve this problem, create and consistently apply a standardized credit policy to all customers.
Finally, the financial condition of customers will inevitably change over time, thereby rendering the original credit review obsolete. A useful control is to build several flags into the computer system that highlight those customers whose ordering or payment habits indicate a change in their financial condition. These flags should trigger a credit review. Examples of possible flags are customer checks being returned due to insufficient funds in their bank accounts, recurring evidence of payments being skipped, and early payment discounts no longer being taken. In addition, a regularly scheduled credit review of the largest customers may spot incipient credit problems.
How Do I Control Purchasing?
The purchasing process can result in considerable losses if a few key controls are not implemented. These losses can be considerable, since the bulk of all corporate expenditures flow through the purchasing department. Further, if a company uses automated check signing, rather than a review by a manager before any checks are manually signed, then the purchasing process is the only point at which improper payments can be spotted. The first need-wary control is a policy that a purchase order must be issued for every purchase made by the company.
This means that the purchasing staff must also forward a copy of each purchase order to the receiving dock, where it is used to verify the purchasing authorization for each item received. As a continuation of the last control, the receiving staff must reject any incoming deliveries for which there is no authorizing purchase order. This control can be quite time-consuming for the receiving department, which must research purchase order information for every delivery. To ease their workload, suppliers should be asked to prominently tag their deliveries with the authorizing purchase order number. Also, if the purchasing department uses paper-based purchase orders, then it must restrict access to the purchase orders by locking them in a storage cabinet when not in use. Otherwise, blank forms could be used by unauthorized parties to order goods.
In addition, the purchasing manager can more easily determine if blank forms have been removed by renumbering all purchase orders, keeping track of the numbers used, and investigating any missing numbers. If the purchasing department creates all of its purchase orders through a computer database, then it must restrict access to that database to guard against the unauthorized creation of purchase orders. Typical controls include pass-word protection, regular password changes, and access being limited to a small number of purchasing staff, and a human resources check-off list for departing employees that calls for the immediate cancellation of their database access privileges.
Finally, a detective control is to compare payments with authorizing purchase orders, in order to spot payments made without a supporting purchase order. This constitutes evidence of a breach of the corporate policy to require a purchase order for all expenditures.
How Do I Control Procurement Cards?
Procurement cards are essentially credit cards that am used by designated employees to purchase small-dollar items without any prior authorization. Their use greatly reduces the labor of the purchasing department, which can instead focus its purchasing efforts on large-dollar items. However, because the use of procurement cards falls completely outside the normal set of controls used for the procurement cycle, an entirely different set of controls are needed. The first key control for procurement cards is for users to enter their receipt information into a procurement card transaction log. When employees use procurement cards, there is a danger that they will purchase a multitude of items, and not remember all of them when it comes time to approve the monthly purchases statement. By maintaining a log of purchases, the card user can tell which statement line items should be rejected.
A sample transaction log is shown in Exhibit 4.1. Another key control is to reconcile the transaction log with the monthly card statement. Each card holder must review his or her monthly purchases, as itemized by the card issuer on the monthly card statement.
A sample of the statement of account used for this reconciliation is shown in Exhibit 4.2, where it is assumed that the company obtains an electronic feed of all procurement card transactions from the card provider, and dumps this information into individualized reports for each card user.
This approach provides each user with a convenient checklist of reconciliation activities within the statement of account, but the same result can be obtained by stapling a reconciliation activity checklist to a copy of the bank statement. Each card user must also fill out a missing receipt form. This form itemizes each line item on the statement of account for which there is no receipt. The department manager must review and approve this document, thereby ensuring that all purchases made are appropriate.
A sample missing receipt form is shown in Exhibit 4.3. In addition, there must be an organized mechanism for card holders to reject line items on the statement of account. A good approach is to use a procurement card line item rejection form, as shown in Exhibit 4.4, which users can send directly to the card issuer.
Procurement Card Transaction Log
| Trans. No. | Date | Supplier Name | Purchased Item Description | Total Price | Comments |
|---|---|---|---|---|---|
| 1 | 5/1/07 | Acme Electric Supply | 200w floodlights | $829.00 | |
| 2 | 5/2/07 | Wiley Wire Supply | Breaker panels | $741.32 | |
| 3 | 5/5/07 | Coyote Electrical | 12-gauge cable | $58.81 | Returned for credit |
| 4 | 5/7/07 | Roadrunner Electric | Foot light trim | $940.14 |
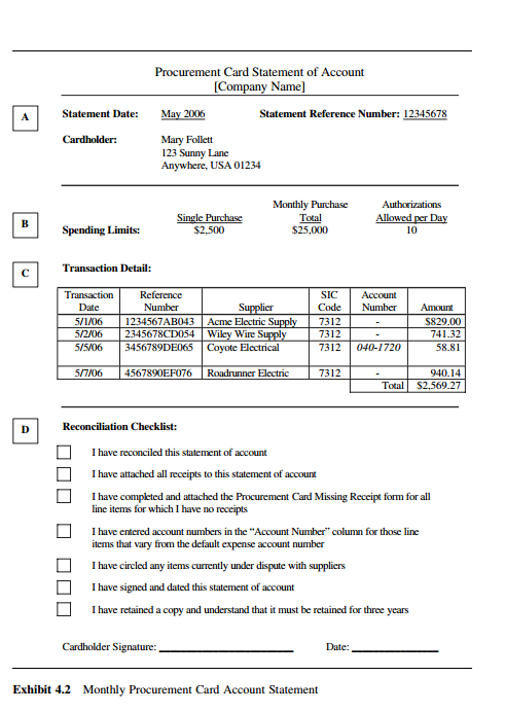
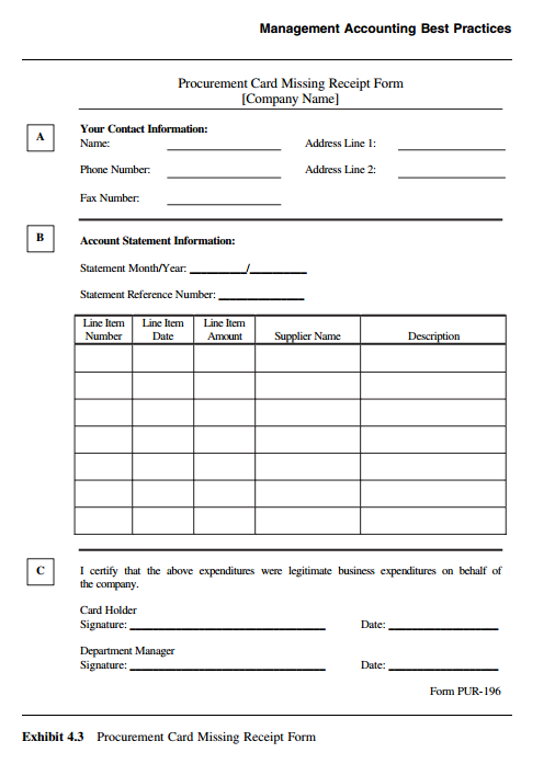
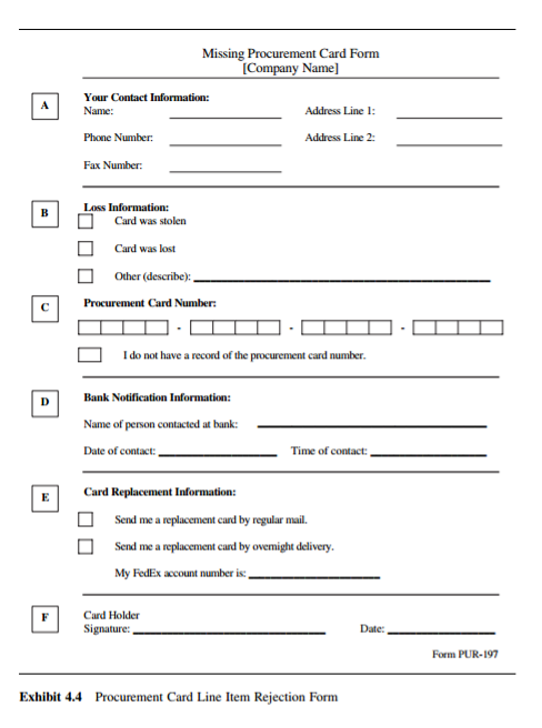
Finally, there must be a third-party review of all purchases made with procurement cards. An effective control is to hand this task to the person having budgetary responsibility for the department in which the card holder works. By doing so, the reviewer is more likely to conduct a detailed review of purchases that will be charged against his or her budget.
How Do I Control Payables?
The accounts payable process is among the most complex and difficult to control of all company processes, because it is the recipient of a blizzard of paperwork from all over the company—supplier invoices, receiving documents, purchase orders, and expense reports. The key to controlling payables is to install iron-clad controls in just a few control points, where incoming information can be properly sorted, identified, and scheduled for payment. The first control is locating authorization of payment for every supplier invoice. The complex variation on this control is the three-way match, whereby the supplier invoice is matched against both the authorizing purchase order and receiving documentation. This is a tedious, error-prone, and inefficient control, and so should be used only for the most expensive purchases. Also, if supplier invoices are being stored in an accounting database, have the software automatically conduct a duplicate invoice number review. This results in the automatic rejection of duplicate invoices.
Having multiple supplier records for the same supplier presents a problem when attempting to locate duplicate supplier invoices, since the same invoice may have been charged multiple times to different supplier records. One of the best ways to address this problem is to adopt a standard naming convention for all new supplier names, so that it will be readily apparent if a supplier name already exists. For example, the file name might be the first seven letters of the supplier name, followed by a sequential number. Under this sample convention, the file name for Smith Brothers would be recorded as SMITHBRO01. A lesser control is that payments may be made to suppliers too early or too late, either depriving the company of interest income (in the first place) or causing it to incur supplier or late charges (in the latter case). If the payables system is paper-based, the proper control for this is to store payables by their due dates, and then pay based on this filing system. If the system is computer-based, the best control is to not only set up payment terms in the vendor master file, but also to periodically compare supplier invoices against this file, to see whether any payment terms have changed. An employee with access to the vendor master file could alter a supplier's remit-to address, process checks having a revised address that routes the checks to the employee, and then alter the vendor master record again, back to the supplier's remit-to address. If this person can also intercept the cashed check copy when it is returned by the bank, there is essentially no way to detect this type of fraud.
The solution is to run a report listing all changes to the vendor master record, which includes the name of the person making changes. The payment part of the payables process calls for several additional controls. First, always keep unused check stock in a locked storage cabinet. In addition, the range of check numbers used should be stored in a separate location, and cross-checked against the check numbers on the stored checks, to verify that no checks have been removed from the locked location.
Also, the check signer must compare the backup information attached to each check against the check itself, verifying the payee name, amount to be paid, and the due date. This review is intended to spot unauthorized purchases, payments to the wrong parties, or payments being made either too early or too late. This is a major control point for companies not using purchase orders, since the check signer represents the only supervisory-level review of purchases. In addition, if there are many check signers, it is possible that unsigned checks will be routed to the person least likely to conduct a thorough review of the accompanying voucher package, thereby rendering this control point invalid. Consequently, it is best to have only two check signers: one designated as the primary signer to whom all checks are routed, and a backup who is used only when the primary check signer is not available for a lengthy period of time. Finally, always perforate the voucher package with the word "Paid," or some other word that clearly indicates the status of the voucher package. Otherwise, the voucher package could be reused as the basis for an additional payment.
How Do I Control Inventory?
A company's investment in inventory may be considerable, so maintaining proper controls over both the quantity and the valuations assigned to it may be paramount. Controls in this area cover both the storage of inventory and its movement within the company's premises. Inventory is nearly impossible to store if employees are allowed into the storage area, since they may move it within the warehouse or remove it entirely. Accordingly, a necessary control is to fence in the storage area, and allow only authorized warehouse staff into the storage area. Also, all storage locations within the warehouse must be tagged in an orderly and logical manner, so that inventory can be more easily located by its storage identification numbers.
Additionally, qualified employees who are highly knowledgeable in inventory identification should label each inventory item with the correct part number and unit of measure, so that inventory is not lost through misidentification. Furthermore, all received inventory should be put away at once and its identification and storage information entered into an inventory database immediately. Otherwise, there will be no record of received inventory, so it can be neither used nor counted. Mother control that may be of considerable use to companies handling customer inventory is to physically segregate such inventory, so that it is not commingled with company-owned inventory. Commingled assets will likely result in an incorrect overstatement of on-hand inventory. When inventory is moved from the warehouse to the production or shipping areas, there is a chance that the picking information will be inaccurate, especially if it has been copied from a source document. To avoid the possibility of transcription errors, always use a copy of the source document, such as the sales order or the customer's original purchase order, to ensure that the correct items are picked. Also, always record inventory movements on move tickets that can then be used to enter the changes into the inventory database (or better yet, scan the information on-site with a bar-code scanner).
Otherwise, the warehouse staff will quickly lose track of its move transactions, resulting in the complete corruption of the inventory database. These move tickets should also be pre numbered, so that all missing move tickets can be periodically investigated. Inventory valuation will be more accurate if it is supported by several controls. First, if the company's computer system has a bill of materials, periodically review the file change log to determine what changes have been made, and by whom. This log contains evidence of alterations that could significantly change the inventory valuation.
Another way to achieve the same result is to compare the unextended product cost on a per-unit basis with the same cost in previous periods, to spot any changes. The inventory valuation may also be affected by journal entries made to the inventory or cost-of-goods-sold account. Accordingly, part of the standard month-end closing procedure should include the investigation of all journal entries made to these accounts. Inventory valuation may also be affected by the application of the lower-of-cost-or-market (LCM) rule, whereby inventory can be valued no higher than its market price as of the measurement date. To ensure that the company is not surprised by such changes, always schedule an LCM review as part of the closing process. Another issue impacting inventory valuation is obsolete inventory, which must be written off once it has been identified. One control used to mitigate this expense is a policy requiring that impacted inventory be used up before an engineering change order that affects them is implemented. Also, items identified as obsolete should be segregated in a central area, where they can be more easily dispositioned.
Finally, the inventory valuation will be greatly assisted by the implementation of a cycle counting system, which is arguably the best inventory control of all. Under cycle counting, a small percentage of the inventory is counted by experienced warehouse personnel every day, with all variances being thoroughly investigated and resolved. The problem-resolution phase of cycle counting will likely locate a number of process-related problems that, if corrected, will lead to a much more accurate database and inventory valuation.
How Do I Control Billings?
The act of creating and delivering an invoice is central to a company's ability to collect cash from its customers, so several key controls are required to ensure that this process proceeds smoothly. The first and most important control is to compare the shipping log to the invoice register to ensure that all shipments have been billed. If a company is in the service industry, then a similar comparison would be between the log of billed hours and the invoice register. The intent is to ensure that all products or services provided to customers are properly billed. A form of control is to modify the physical layout of the invoice in order to make it as simple as possible for the recipient to understand and process for payment. This should include the clear presentation of the amount due, invoice number, and due date. Of equal importance, all information not relevant to the customer (such as the name of the salesperson, the job number, and the document number) should be removed from the invoice. Also, if there are continuing problems with the accuracy of issued invoices, then a good control is to include an accounting manager's phone number on the standard invoice form, and encourage customers to call if they have problems. Do not have customers call the person who created the invoice, since this person would be more likely to ignore or cover up the complaint. Some invoices are so complex, involving the entry of purchase order numbers, many line items, price discounts and other credits, that it is difficult to create an error-free invoice. If so, customers reject the invoices, thereby delaying the payment process. To correct this problem, assign a second person to be the invoice proofreader. This person has not created the invoice, and so has an independent view of the situation and can provide a more objective view of invoice accuracy. However, due to the delay caused by proofreading, it may be unnecessary for small-dollar or simplified invoices.
Finally, the billing and collection functions should always be segregated. By doing so, it becomes much more difficult for a collections person to fraudulently access incoming customer payments and alter invoices and credit memos to hide the missing funds.
How Do I Control Cash Receipts?
Cash has historically been the most obvious asset to steal from a company. Accordingly, the handling of checks and cash has been burdened with the largest number of controls of all processes, even though the total amount of cash on hand at any time is usually much less than for other types of company assets. Accordingly, use only the minimum number of controls noted in this section to ensure a reasonable level of control over cash receipts; any additional controls will only increase the workload on an already inefficient process. The best control over cash receipts is to not receive the cash at all—have customers send it to a lockbox instead. This approach eliminates many controls, since the cash is immediately deposited by the receiving bank.
The next best control is to have the mailroom staff immediately reroute all incoming payments to the lockbox, thereby also avoiding the same controls. If cash or checks must be received in-house, then the first control is to have the mailroom staff prepare a check prelist, which itemizes the amounts of all checks and cash received. Preferably, two people in the mailroom should open the mail together, to ensure that no cash is stolen at this point. This list can then be compared with the results of downstream processing operations to see if any payment information was subsequently modified. The mailroom staff also endorses all checks "for deposit only" and clearly specifies the account number into which they should be deposited, so that they cannot be cashed into some other account. The cashier then enters the receipts into the cash receipts journal, prepares a daily bank deposit slip, and sends the checks and cash to the bank. A different person should then compare the check prelist against the deposit slip (even better, use the validated deposit slip that is returned by the bank) and cash receipts journal to see if the numbers match.
Finally, another clerk should reconcile the month-end bank statement to the general ledger, to ensure that the company's cash receipt records match those of the bank.
If a company is primarily handling cash, rather than checks, then the control situation is somewhat different. When receiving cash from a customer, always give that person a receipt and retain a copy; this gives the customer a chance to spot an error on the receipt. Also, a different clerk from the one who initially entered the cash receipts should reconcile the on-hand cash to the receipt copies. Then, the cash should be transported to the bank in a locked container. Finally, the bank's deposit receipt should be reconciled to the company's receipt records.
A few additional cash-handling controls can enhance the cash control environment. First, give only one person access to a cash register during a work shift. This makes it easier to assign responsibility for any inaccuracies in the recording of cash receipts.
A more obtrusive control is video surveillance of the cash registers. Second, require supervisory approval of cash refunds. This is because an employee can steal cash by taking money from the cash register and recording a refund on the cash register tape. By requiring a supervisory password or key entry for every refund issued, the cash register operator has no opportunity to steal cash by this method. The use of petty cash is not recommended, since it is too easy for anyone to pilfer the petty cash box, or to steal the entire box. Thus, the best control over petty cash is to eliminate it entirely. If this cannot be achieved, then always require a valid receipt as proof of expenditure whenever issuing petty cash, and also require a receipt signature on all payments. The signature requirement is especially important, since otherwise the petty cash custodian could manufacture receipts and directly pocket funds from the petty cash box. In addition, conduct unannounced audits of petty cash, looking for incomplete or suspicious receipts, missing receipt vouchers, or missing cash. Finally, install a petty cash contact alarm that will be triggered if the petty cash box is removed.
How Do I Control Payroll?
In many companies, payroll comprises the largest expense, especially in the service industry. Accordingly, payroll controls must be especially stringent in order to avoid excessive expenditures.
An essential control is to verify that all timecards have been received, because it is entirely possible for an employee's timesheet to disappear during the accumulation of timesheet data, or to never be submitted. In either case, once payday comes and there is no check, impacted employees will want an immediate payment, which represents not only additional work for the payroll staff, but a sudden and unexpected additional cash outflow. Supervisors should also review the time submitted by employees, and specifically approve all overtime hours worked. This is needed, because employees may pad their timesheets with extra hours, hoping to be paid for these amounts. Alternatively, they may have fellow employees clock them in and out on days when they are not working.
Despite this control, such actions can be difficult to spot, especially when there are many employees fora supervisor to track, or if employees work in outlying locations. Avery important control is to obtain written approval of all pay rate changes, since these changes can cumulatively result in extremely large increases in expenditures. This approval should be from a person knowledgeable in the proposed rate of change in pay, and of what pay rate has been budgeted. It is also useful to have someone besides the payroll clerk compare the payroll register to the authorizing pay documents, to ensure that the correct pay rates are being used. If the company uses an employee self-service portal, it is possible that employees will make erroneous changes to their employee records. To spot these problems, have the payroll system automatically send a confirming e-mail message detailing the change.
This gives employees the opportunity to spot errors in their entries, while also notifying them if someone else has gained access to the payroll system using their access codes and has altered their pay-roll information. When calculated manually, payroll is the single most error-prone function in the accounting area. To reduce the number of errors, have someone other than the payroll clerk review the wage and tax calculations for errors. This does not have to be a detailed duplication of all calculations made; a simple scan for reasonableness is likely to spot obvious errors. The person who physically hands out paychecks to employees is sometimes called the paymaster. This person does not prepare the paychecks or sign them, and his sole responsibility in the payroll area is to hand out paychecks. If an employee is not available to accept a paycheck, then the paymaster retains that person's check in a secure location until the employee is personally available to receive it. This approach avoids the risk of giving the paycheck to a friend of the employee who might cash it, and also keeps the payroll staff from preparing a check and cashing it themselves. It is quite useful to periodically give supervisors a list of paychecks issued to everyone in their departments, because they may be able to spot payments being made to employees who are no longer working there. This is a particular problem in larger companies, where any delay in processing termination paperwork can result in continuing payments to ex-employees. It is also a good control over any payroll clerk who may be trying to defraud the company by delaying termination paperwork and then pocketing the paychecks produced in the interim.
When the bank sends back copies of cashed checks as part of its monthly bank statement, consider reviewing the checks for double endorsements. If a payroll clerk has continued to issue checks to a terminated employee and is pocketing the check, then the cashed check should contain a forged signature for the departed employee, as well as a second signature for the account name into which the check is deposited.
How Do I Control Fixed Assets?
Fixed assets can involve very large sums of cash, so controls are needed over their initial acquisition, as well as their subsequent tracking and ultimate disposition. The first control over fixed asset acquisitions is to obtain funding approval through the annual budgeting process. This is an intensive review of overall company operations, as well as of how capital expenditures will be integrated into the company's strategic direction. Expenditure requests included in the approved budget should still be subjected to some additional approval at the point of actual expenditure, to ensure that they are still needed. However, expenditure requests not included in the approved budget should be subjected to a considerably higher level of analysis and approval, to ensure that there is a justifiable need for them. Given the significant amount of funds usually needed to acquire a fixed asset, always require and review a completed capital investment approval form before issuing a purchase order. An example is shown in Exhibit 4.5.
Depending on the size of the acquisition, a number of approval signatures may be required, extending up to the company president or even the chairperson of the board of directors. A good detective control to ensure that all acquisitions have been properly authorized is to periodically reconcile all fixed asset additions to the file of approved capital expenditure authorizations.
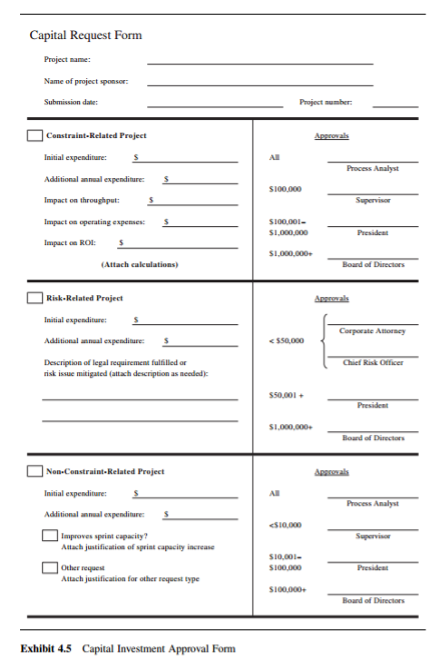
Any acquisitions for which there is no authorization paperwork are then flagged for additional review, typically including reporting of the control breach to management. Compare fixed asset serial numbers with the existing serial number database. There is a possibility that employees are acquiring assets, selling them to the company, then stealing the assets and selling them to the company again. To spot this behavior, always enter the serial number of each acquired asset in the fixed asset master file, and then run a report comparing serial numbers for all assets to see if there are duplicate serial numbers on record.
There are a number of downstream errors that can arise when fixed asset information is incorrectly entered in the fixed asset master file. For example, an incorrect asset description can result in an incorrect asset classification, which in turn may result in an incorrect depreciation calculation. Similarly, an incorrect asset location code can result in the subsequent inability to locate the physical asset, which in turn may result in an improper asset disposal transaction. Further, an incorrect acquisition price may result in an incorrect depreciation calculation. To mitigate the risk of all these errors, have a second person review all new entries to the fixed asset master file for accuracy. If a company acquires assets that are not easily differentiated, then it is useful to affix an identification plate to each one to assist in later audits. The identification plate can be a metal tag if durability is an issue, or can be a laminated bar-code tag for easy scanning, or even a radio frequency identification tag.
The person responsible for tagging should record the tag number and asset location in the fixed asset master file. There is a significant risk that assets will not be carefully tracked through the company once they are acquired. To avoid this, formally assign responsibility for each asset to the department manager whose staff uses the asset, and send all managers a quarterly notification of what assets are under their control. Even better, persuade the human resources manager to include "asset control" as a line item in the formal performance review for all managers. Fixed assets decline in value over time, so it is essential to conduct a regular review to determine whether any assets should be disposed of before they lose their resale value. This review should be conducted at least annually, and should include representatives from the accounting, purchasing, and user departments. An alternative approach is to create capacity utilization metrics (which are most easily obtained for production equipment), and report on utilization levels as part of the standard monthly management reporting package; this tends to result in more immediate decisions to eliminate unused equipment. There is a risk that employees could sell off assets at below-market rates or disposition assets for which an alternative in-house use had been planned. Also, if assets are informally disposed of, the accounting staff will probably not be notified, and so will continue to depreciate an asset no longer owned by the company, rather than writing it off. To avoid these problems, require the completion of a signed capital asset disposition form such as the one shown in Exhibit 4.6.
If the company owns fixed assets that can be easily moved and have a significant resale value, then there is a risk that they will be stolen. If so, consider restricting access to the building during non-work hours, and hire a security staff to patrol the perimeter or at least the exits. An alternative is to affix a radio frequency identification (RFID) tag to each asset, and then install a transceiver near every building exit that will trigger an alarm if the RFID tag passes by the transceiver.
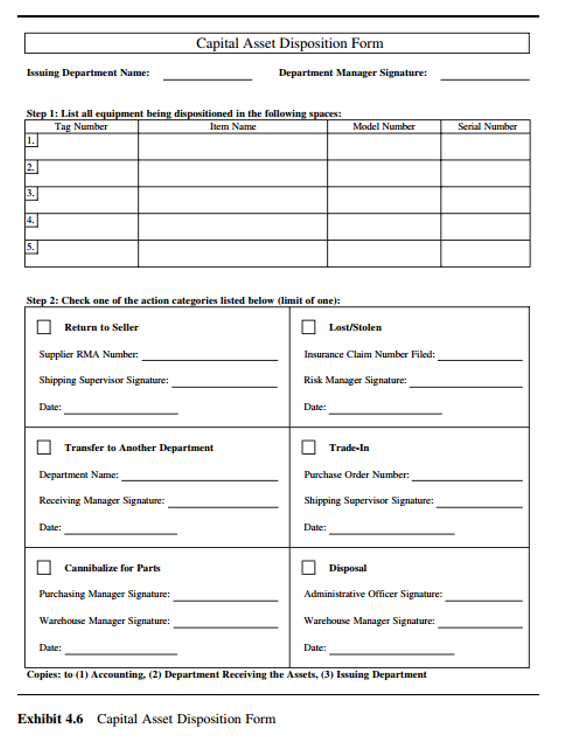

Small Business for Dummies (4th ed.)
Veechi Curtis
Wiley
Milton, QLD, 2012
Pages 281-285
Taming the Tax Tyrant
How do I write a chirpy introduction about one of the most tedious and cheerless subjects in the world? I could tell you that doing your tax is not only a fascinating process, but also a great way of meeting a new lover and a constant source of new insights and inspiration. I could even tell you that this chapter is much more exciting than watching sport on TV and can improve your hair-loss problem.
Sad fact is, I don't think you'd believe me. So, in the interests of honesty, I'm going to skip the chirpy introduction bit and progress to the meat of the matter....
Getting a Grip on GST
If you're starting a new business, you can register for GST at the same time as you apply for an ABN (in Australia), or when you register as a business (in New Zealand). (For more about ABNs or registering your business, refer to Chapter 5.) On the other hand, if you're already up and running in business and now want to alter your details to register for GST, contact the Tax Office in Australia on 13 28 66 or phone New Zealand's Inland Revenue on 0800 377 776. They willingly take your details and sign you up.
I recommend that you don't plunge into the whole CST shenanigans without thinking through your options carefully. Do you have to register? And, if not, would you be better off not registering? What accounting basis is best for your business? How often should you lodge reports? I answer all these questions, and a bit more besides, in the next few pages.
Deciding whether to register or not
If your turnover is less than $75,000 a year (Australia) or less than $60,000 a year (New Zealand), you can choose whether or not you want to register for GST. (Note: The only exception is if you're an Australian and you're a taxi driver, in which case you have to register, no matter how much you earn.) If you register for CST, this means you have unless you're in a business that's exempt from GST). However, you can also claim GST on your purchases. Every reporting period, you calculate the difference between GST collected (that is, the GST you charged to customers) and GST paid (that is, the GST you paid to suppliers). If GST collected is more than GST paid, you pay this difference to the government. If GST paid is more than GST collected, you claim a refund.
If you don't register for GST, you don't charge GST on your customer sales. However, don't think that you can escape paying GST on purchases: Even if you're not registered, a tax-registered business still has to add GST on its charges to you. You can't claim this GST back, although you can claim the full amount of the purchase as a tax deduction.
Registering for GST when you don't have to doesn't make sense for many small businesses. My neighbour chose not to. He runs a small lawn mowing business that turns over about $600 a week, an income that falls short of the threshold over which he'd have to register. He chose not to register because that way he doesn't have to charge customers GST, and his prices are more competitive.
Note: Simply ignore that silly urban myth that suggests if you don't register for GST, customers don't want to trade with you. As long as you have an ABN (Australia) or registration number (New Zealand) and your prices are competitive, most customers don't mind either way.
Choosing your cashflow destiny
When you register for GST (refer to Chapter 5 for more details about how this is done), you see an innocent-looking question asking whether you want to account for GST on a cash, accrual or hybrid basis (the hybrid option only applies to New Zealand businesses). Here's what this means:
- Cash or payments basis: Cash basis reporting (also known as payments basis reporting in New Zealand) means you only pay GST when you receive payments from customers and you only claim back GST when you make payments to suppliers. Note that you're only allowed to report for GST on a cash or payments basis if your business has a turnover of less than $2 million per year (this threshold is the same in both Australia and New Zealand).
If you tend to owe less to suppliers than what customers owe you, cash basis reporting works best. - Accrual or invoice basis: Accrual basis reporting (also known as invoice basis reporting in New Zealand) means you pay GST in the period that you bill the customer or receive a bill from the supplier, regardless of whether any money has been exchanged. This approach means that if you bill customers in March and they don't pay until July, you have to pay the GST in April regardless. Similarly, if you receive a bill from suppliers in March and you don't pay them until much later, you still claim back the GST in April.
If you tend to owe more to suppliers than what customers owe you, accrual basis reporting works best. - Hybrid basis (available in New Zealand only): The hybrid basis is a combination of cash and accrual accounting. You pay GST on sales in the period that you invoice customers, regardless of whether they've paid you or not. However, you can only claim GST on supplier bills after you've paid them. I don't recommend this method — Inland Revenue is the only mob that wins.
You can choose to report for GST on a different basis to income tax. For example, you can choose to report for GST on a cash (payments) basis and report for tax on an accrual (invoice) basis or vice versa. Most small businesses opt to report on a cash (payments) basis for both GST and for Income tax purposes.
You may be feeling bamboozled by all this tax chat. No sweat — the important thing for you to realise is that any selection you make regarding your GST reporting basis, or your accounting basis, may have a big impact on the cash flow of your business. If you're in doubt as to what's best for you, speak to your accountant first.
Reporting for duty how often
In Australia, if your annual business turnover is $20 million or less, you can choose to report for GST on either a monthly or a quarterly basis. In New Zealand, if your annual business turnover is $500,000 or less, you can choose to file your GST returns either every two months or every six months.
I find that reporting every two or three months is a happy medium between the hassle of monthly reporting, and the psychological hurdle of only doing your books every six months. Possibly the only advantage to reporting monthly (which is an option in Australia, but not New Zealand) is that you're paying GST as soon as it falls due, rather than being faced with a whopping bill every three months. However, I suggest a way around this cash flow problem later in this chapter, in the section 'Avoiding the Black Hole'.
In New Zealand, when you register for GST you have the option to align your GST reporting period-end with the financial year-end (otherwise known as your balance date). Be smart and agree to this option, because aligning reporting periods makes life heaps easier for your accountant and, therefore, lighter on the hip pocket for you.
Coughing up
Here are five tips for making the Business Activity Statements (Australia) or GST returns (New Zealand) as inconsequential in your life as your second cousin's birthday. Here goes:
- Get accounting software: If you have more than 20 transactions or so a month, get some accounting software that can do your books and print your Business
- Activity Statement or GST return automatically. Don't tie yourself in knots: These cursed government forms aren't something you have to get 100 per cent right. Work through the questions as best you can and, if something doesn't balance by a couple of dollars, don't put yourself through too much heartache.
- Learn how to double-check your figures: Insure yourself against these seemingly lackadaisical attitudes by making sure someone (if not you) compares the figures on your Business Activity Statement or GST return against your Profit & Loss report and Balance Sheet (refer to Chapter 13 for more on these reports). Ask your accountant to teach you how, if need be
- Know your limitations: If all else fails, get someone else to do all your GST stuff (your bookkeeper or accountant are likely victims). Trouble is, you have to pay this person for their efforts — this kind of form-filling isn't something people do for fun.
- Make a copy of the darned form, and file this copy with any other reports you printed as part of your workings: The only document you have to send is the Business Activity Statement or GST return itself.
Staying out of trouble
Everyone dreads an audit and no-one wants to unexpectedly receive a tax bill. Here are some common mistakes auditors look for, if you're unlucky enough to get hauled over the coals:
- You can't claim GST on bank fees, private drawings, interest, wages, tax payments or loan payments.
- In Australia, you can't claim GST on government charges, such as motor vehicle registration, licence renewals or stamp duty (although you can in New Zealand).
- You can't claim the full amount of GST on expenses that are partly personal (motor vehicle and home office expenses are the obvious culprits). However, in Australia, you can claim the full whack of GST during the year, and then make an adjustment for private use in your final Business Activity Statement.
- You can't claim GST on invoices from unregistered suppliers. If a supplier isn't registered for GST, treat them as a GST-free purchase (in Australia) or a no-tax purchase (in New Zealand).
- You can't claim GST on any amount over $82.50 (in Australia) or $50.00 (in New Zealand) unless you have a Tax Invoice.
- If your account for GST on a cash basis, you can't claim in advance for GST on cheques you write out at the end of the month but that you don't post until several days later.
- If you account for GST on an accrual basis, be careful not to claim input tax credits on supplier invoices twice (the first time when you receive the invoice and a second time when you pay the invoice).
- Claim credit card purchases in the period they appear on your statement (regardless of whether you report on a cash or an accruals basis), not when you pay the credit card company.

Australian GST Legislation with Overview (15th ed.)
CHH Australia
CCH Australia Limited
Sydney, NSW, 2012
PGS 3 – 8
Introduction
What Is GST?
A 10% goods and services tax (GST) started full operation in Australia on 1 July 2000. GST replaced sales tax (more formally known as the wholesale sales tax or WST). The introduction of GST was accompanied by a series of other tax measures, including personal tax cuts, collectively forming part of the so-called New Tax System. Annual GST collections are about S46b, representing about 17% of total ATO revenue.
GST is an indirect, broad-based consumption tax.
- Indirect means that it is levied on the supply of goods, services or activities, rather than directly on income. Other indirect taxes include stamp duty.
- A broad-based tax applies generally to all transactions by all types of taxpayers, with only limited exceptions. It can be contrasted with taxes such as sales tax, which was generally limited to transactions involving sales, and transactions involving certain types of goods.
- Consumption sax means that instead of being applied to income (as measured by the amounts that are received), GST is applied to consumption (as measured by the amounts that are spent). The tax is ultimately borne by consumers, not by producers or suppliers.
GST is similar to taxes known in other countries as value-added taxes. "Value-added" means that the net tax payable at any one stage is based on the increase in the price.
Despite its name, GST is not limited to "goods and services" in the normally understood sense. For example, it also applies to real estate and the creation of rights. GST is therefore a convenient, but not an entirely accurate, shorthand term.
GST has significant effects on business procedures and requires many businesses to re-evaluate their business practices. In particular, the impact of GST on pricing and cash flow flows through to many areas of business organisation.
GST is governed principally by the A New Tax System (Goods and Services Tax) Act 1999 (GST Act). All section or Division references in this Overview are to this Act unless otherwise stated.
A 10-point guide to GST
Here is a 10-point simplified snapshot of how GST works. Each of these steps is explained later in this Overview.
- GST liability. Liability for GST arises where a registered business makes supplies to its customers. The GST is imposed at the rate of 10%. Typically, it is included in the price paid by the recipient of the goods and services. The supplier must account for the amount of GST to the ATO (1-100).
- Getting credits for GST. If the recipient of goods or services is a registered business entity, it will normally be able to claim a credit for the amount of GST in the price of its acquisition, provided it holds a tax invoice. This credit —called an input tax credit — is offset against any GST on goods or services that the recipient supplies to its own customers (1-100, 1-140)
- Burden on end-consumer. The net effect is that registered business entities receive an amount representing GST but do not keep it, and pay an amount representing GST but get a credit for it. This means that they act essentially as collecting agents for the tax. The ultimate burden of the tax falls on the private consumer of the goods and services, as this person gets no credit for the GST component of the price they pay (1-100).
- Registration. Most business entities have to register for GST, although there are some exceptions. If an entity is not registered, GST normally cannot apply to the supply, and the supplier cannot claim credits for the GST component of its related acquisition (1-110).
- Returns and tax periods. Businesses account to the ATO for their GST liabilities and credit entitlements by making a GST return in their Business Activity Statement, or "BAS" (1-150). A separate GST return is made for each tax period, which may, according to the circumstances, be monthly, quarterly or, for some smaller businesses, annual. Monthly returns are compulsory in some situations, such as where turnover is $20m or more (1-120)
- Accounting basis. GST and input tax credits are allocated to particular tax periods either on a cash basis (based on when amounts are received or paid out) or on an accruals basis (based on when invoices are sent or received). There are restrictions on who can use the cash basis (1-130).
- Tax or refund? If the GST allocated to a tax period is more than the credits for that period, the business is liable for the balance to the ATO. If the credits exceed the GST, the business is entitled to a credit or refund (1-150). Adjustments may need to be made later if there is a change of circumstances (1-140).
- GST exemptions. Some transactions are outside the scope of GST altogether because, for example, they are gills, are made by unregistrable people, or have no connection with Australia (1-160). Others are "GST-free" which means that there is no liability for GST on the supply, but the supplier can claim credits for the GST on its own related acquisitions. The main GST-free items are specified exports, health, food, education, international travel and certain charitable activities (1-165).
- Input taxed supplies. A small range of supplies are "input taxed". This means that there is no liability for GST on supplies made, and that the supplier cannot claim credits for the GST on its own acquisitions. The main input taxed items are financial services and the supply of residential rental premises (1-170).
- Special rules apply to a wide range of items including charities and non-profit bodies (1-200), GST groups and joint ventures (1-210), financial supplies (1-220), superannuation funds (1-230), insurance (1-240), vehicles (1-250), small businesses (1-255), real property (1-260), buying and selling a business (1-270), importations (1-280) and second-hand goods (1-290). Other special rules are noted at 1-300.
How GST operates
GST liability and input tax credits
GST applies where an entity supplies goods or services — including real property and rights — in the course of carrying on an enterprise such as a business (Div 7). These are called taxable supplies. For there to be a taxable supply, the entity — called the "supplier" — must be registered or required to be registered (1-110), the supply must be made for consideration and it must be connected with Australia (Div 9).
A typical example of a "supply" is a sale, but anything else that could be described as a supply in the normal sense of the word is also covered (s 9-10). A supply includes creating or surrendering a right.
The rate of GST is 10%. The entity must account for this amount to the ATO. Normally it will be included in the price charged to the customer.
If an entity acquires goods or services in carrying on its enterprise, it can claim a credit for the GST component of the price. This is called an input tax credit because it is a credit on business inputs. For this to apply, the entity — called the "recipient" — must be registered, or required to be registered (1-110). The acquisition must be made for consideration and it must be connected with Australia (Div 11; GST Riding GSTR 2008/1). A four-year limit applies to making claims for input tax credits (Div 93; Div 133).
The combined effect of these rules is that the ultimate burden of the GST will normally fall on the end-user, or private consumer. The businesses that form part of the chain of supply act as progressive collectors of the tax, but do not ultimately bear the burden of it.
The following example gives an idea of how GST is accounted for at the various stages of production. 10.
Example
A customer buys a leather briefcase from a retailer. The retailer had acquired the briefcase from a leather goods manufacturer that had acquired the leather to make the briefcase from a tannery. The tannery had bought cow hide from an abattoir to make the leather. Assume that all panics are registered except for the customer.
The GST rules apply as follows:
- The abattoir sells the cow hide to the tannery for $22 (including $2 GST). When the abattoir fills in its GST return, it takes the GST it collected on its sale to the tannery ($2), subtracts any GST it paid for input (its input tax credit, in this case assume nil) and sends the net amount ($2) to the ATO.
- The tannery processes the cow hide into leather and sells it to the leather goods manufacturer for $44 (including S4 GST). When the tannery fills in its GST return, it takes the GST it collected on its sale to the manufacturer ($4), subtracts the GST it paid on its inputs ($2 paid to the abattoir on purchase of the cow hide) and sends the net amount ($2) to the ATO. The ATO has therefore collected $4 in total so far.
- The leather goods manufacturer makes the leather into a briefcase that it sells to a retailer for $88 (including $8 GST). When the manufacturer fills in its GST return, it takes the GST it collected from the retailer ($8), subtracts the GST it paid on its inputs ($4 paid to the tannery) and sends the net amount ($4) to the ATO. The ATO has therefore collected $8 in total so far.
- The retailer sells the briefcase to the final consumer for $110 (including $10 GST). When the retailer fills in its GST return, it takes the GST it collected on the sale to the consumer ($10), subtracts the GST it paid on its inputs ($8 paid to the manufacturer) and sends the difference ($2) to the ATO. The ATO has therefore collected $10 in total.
This means that the total GST payable on the briefcase was $10, which was the total amount sent to the ATO. It is also clear that the businesses did not ultimately bear the GST — this was totally borne by the final customer as part of the price paid. GST is also payable if an entity imports goods (1-280). More details: Australian GST Guide 10-000. 15-000; 2012 Australian Master GST Guide 4-000, 5-000.
Registration
To be liable for GST or to claim input tax credits, an entity must normally be registered, or be required to be registered (Div 23). An entity registers with the ATO, which is the body responsible for administering the GST (Div 25). Registration is compulsory if the entity's GST turnover is $75,000 or more ($150,000 if you are a non-profit body). For the calculation of GST turnover, see 1-115.
To be registered, the entity must be carrying on an enterprise — this is similar to being in business, but it is not limited to that (s 9-20). Guidelines on the meaning of "entity carrying on an enterprise" are set out in Miscellaneous Taxation Ruling MT 2006/1. An employee is not carrying on an enterprise.
An "entity" includes an individual, company, trust, partnership or unincorporated association (s 184-1). Compulsory registration applies to taxi businesses (Div 144). More details: Australian GST Guide 5-000; 2012 Australian Master GST Guide 3-000.
GST turnover
An entity's GST turnover is relevant in determining:
- its liability to register (1-110)
- its liability to use monthly tax periods (1-120) or lodge returns electronically (1-150)
- if it does not carry on a business, its eligibility to use the cash basis (1-130), make annual apportionments of input tax credits (1-100), or pay GST by instalments (1-150), and
- its eligibility to report and pay GST annually (1-150).
In calculating GST turnover, both the current year and the projected year are taken into account (Div 188). For example, an entity is required to register if either of the following applies:
- its current GST turnover is 575,000 or more, except if the ATO is satisfied that the projected GST turnover is below $75,000, or
- its projected GST turnover is $75,000 or more. At any particular time, your current GST turnover is measured over the 12-month period ending at the end of the current month. Your projected GST turnover is measured over the 12-month period starting at the beginning of the current month.
Tax periods
An entity's liability is worked out at the end of each of its tax periods (Div 27). The general rule is that these tax periods may be:
- monthly
- quarterly, ending on 31 March, 30 June, 30 September and 31 December, Or
- annual, in certain limited situations (1-150).
Monthly tax periods must be used if:
- the entity's GST turnover is $20m or more (1-115), or
- the ATO is satisfied that the entity has a history of failing to comply with its taxation obligations.
Quarterly tax periods normally end on 31 March, 30 June, 30 September and 31 December.
More details: Australian GST Guide 20-500; 2012 Australian Master GST Guide 7-000.
Basis of accounting
The GST and the input tax credits that belong to each period are worked out according to attribution rules, which vary according to whether the entity is on a cash basis or an accruals basis of accounting (Div 29).
If the entity is on the cash basis, the GST and input tax credits for each tax period are worked out on the basis of amounts actually received and paid out. An entity can use the cash basis if:
- it is a "small business entity" with an aggregated turnover of less than S2m (1-255)
- it does not carry on a business and its GST turnover (1-115) does not exceed $2m
- it accounts on a cash basis for income tax purposes
- it is a charity or related body, or
- it can convince the ATO that it is appropriate.
If the entity uses the accruals basis, it works out the GST and input tax credits for each tax period on the basis of its entitlement to be paid and its obligation to pay. This will normally be when it gives or receives an invoice.
In either case, the entity normally cannot claim an input tax credit unless it also has a complying tax invoice for the purchase at the time of lodging the return (1-140).
Example 1
Assume that a seller and buyer both operate on a cash basis and both have the same tax periods. The seller sells goods and issues a tax invoice in the first tax period of the year. The buyer pays for the goods in the second tax period of the year.
The seller should attribute the GST on the sale to the second tax period because that is when payment is received. The buyer should attribute the input tax credit to the second period because it paid for the goods in that period and had a tax invoice.
Example 2
Assume that a seller and buyer both operate on a cash basis and both have the same tax periods. The buyer makes a part payment for goods in the first tax period, receives the goods in the second period, together with a tax invoice, and pays the balance owing in the third period.
The seller should attribute the GST on the part payment to the first tax period, and the GST on the balance to the third tax period.
As the buyer does not receive a tax invoice until the second tax period, the input tax credit for the part payment should be attributed to that period. The input tax credit for the balance should be attributed to the third period.
Example 3
Assume that the seller and the buyer operate on an accruals basis and that both have the same tax periods. The seller sells goods and issues an invoice in the first tax period of the year. The invoice does not comply with the requirements for a tax invoice. The buyer pays for the goods in the second tax period of the year.
The seller becomes entitled to be paid when it issues the invoice and should therefore attribute all of the GST on the sale to the first tax period.
The buyer becomes liable to pay when it receives the invoice in the second tax period, but cannot attribute the input tax credit to that period because it does not have a tax invoice. Until it receives this, it cannot claim the credit.

The Performance-Based Management Handbook
Will Artley, DJ Ellison and Bill Kennedy
Oak Ridge Institute for Science and Education
2001
PGS 48 – 52
How Does Actual Performance Compare to Set Goals?
There are a number of ways to answer the question, “How does actual performance compare to the goals or standards set?” A simple check list may do if all of your performance targets or standards are events that were to have occurred. However, often the performance goal or standard is not so simple. To measure current performance you need to know something about past performance, i.e., where you started. You also must know something about the target or expectation for current performance, and have a notion of what constitutes “good” or excellent performance for this measure or indicator. That is, for a performance indicator or measure, you need a baseline or base level value, a target or expectation, and a benchmark. Often management encourages definition of “stretch” targets, exceeding normal expectations, as well as regular targets to provide incentives for achievement.
Trend Analysis
“Goals” and “stretch targets” can be numerical or they can be stated in terms of achievement of a significant, improving trend. One way of determining and showing a trend is a statistical process control chart. Another is to use expert opinion about qualitative definitions of success in a peer review. If a control chart is used, the chart becomes the criterion for determination of success. In both cases, numerical targets are not used. With the control chart, the goal or stretch target is stated as to “achieve statistically significant improvement” in certain measures over certain time frames. Goals that are stated in terms of achievement of statistically significant improvements are easy to monitor using a control chart. This methodology eliminates the problem of “we achieved a 49% improvement, but the target was 50 percent, so we failed.” Also, it prevents a random, lucky fluctuation in performance from being declared as a success.
Statistical Process Control
he simplest trending tool that allows for determination of statistical significance is Statistical Process Control, using control charts. A control chart includes: the performance data, an average (or center) line set at the mean (arithmetic average) of the data, an upper control limit set at the mean plus three standard deviations, and a lower control limit set at the mean minus three standard deviations. There are four types of control charts—the p-chart, c-chart, u-chart, and x-chart—that are used when the data being measured meet certain conditions (or attributes). Their characteristics are given in Table 1.2.
If There Is Variance, What Is the Cause and Is Corrective Action Necessary?
It is important to understand why there is variation between expected performance and measured performance. Analysis must set the stage for action plans at multiple organizational levels. What are causes, priorities for change, or gaps? Here are descriptions and examples of the most important types of analysis and commonly used tools:
Table 1.2: The Four Types of Control Charts and Their Characteristics
| Type | Characteristic |
|---|---|
| p-chart | Used with binomial data such as go/no-go situations. They account for sample size and are effective for small samples as well as large samples. |
| c-chart | Used for Poisson processes such as counting attributes or random arrival. |
| u-chart | Used for counting defects when sample size varies for each lot. |
| x-chart | Generic control chart that is used when the above conditions are not met. |
Analyzing Common and Special Cause Factors
A control chart can also be used for segregating Common Causes from Special Causes. Dr. Shewhart (Shewhart 1986) invented this way of thinking about uniformity and non-uniformity. He originally referred to these two types of causes as “chance causes” and “assignable causes.” Common causes of variation produce points on a control chart that, over a long period, all fall inside the control limits, and no significant trends exist. The performance data does vary from point to point, but the pattern is apparently random. Common causes of variation stay the same day to day. A special cause of variation is something special, not part of the system of common causes. Special causes correspond to specific issues acting upon the process, such as personnel and equipment changes, weather delays, malfunctions, and other “unique” events.
Analysis Using Histograms and Pareto Charts
The histogram and related pareto chart are convenient graphs to display the results of causal analysis and help determine priorities for action. The histogram displays the number of instances of the attribute being measured in each category (or bin). Usually, the histogram is used when the categories are numeric (0-5 days, 6-10 days, 11-15 days) and you desire to keep the categories in their “natural” order. The histogram also is used to check the distribution of process data. Distribution tests, such as testing for a “normal” distribution, are of limited usefulness in process improvement. The difficulty is that the time sequence of the data is lost when lumped into a distribution histogram. If analysts perform a control chart first, they will know that the loss of time sequence is acceptable. The pareto chart is a specialized version of a histogram that ranks the categories in the chart from most frequent to least frequent. A pareto chart is useful for non-numeric data, such as “root cause,” “type,” or “classification.” This tool helps to prioritize where action and process changes should be focused. If taking action based upon causes of accidents or events, it is generally most helpful to focus efforts on the most frequent causes. Going after an “easy,” yet infrequent, cause will probably not reap benefits.
Rules for Interpreting Data and Formulating Conclusions
Recommendations are normative statements of how things should be. They are grounded in, but depart from, an assessment report that describes what the current status is. The ultimate purpose of the recommendation is to convert findings into action statements that are directed to alternative ways of conducting business. A well written recommendation has five basic qualities. It should be timely, realistic, directed to the appropriate person or entity, comprehensive, and specific. Of the five, timeliness is most important.
In making recommendations, the analyst must consider the organizational environment, weighing resource and budget constraints, political pressures, and other conditions that might affect implementation. Successful recommendations are linked to the evaluation findings and grounded in the empirical evidence presented in the report. Under some conditions it may be more appropriate to offer options or alternative scenarios. Options would be appropriate if: (1) there is no preponderance of evidence elevating one course of action over another, (2) the audience likes options, (3) a political decision that must be debated is involved, or (4) when it is important to generate ownership of whichever option is chosen. Framing options or recommendations is a deliberate, evolutionary process that occurs throughout the analysis and review, culminating with interpretation of all the findings. Recommendations are solutions to problems and, as such, are developed as the program problems and potential solutions are discussed with interested stakeholders. Physically, recommendations may be presented separate from the evaluation report. Reports contain descriptive and empirical data based on observation and analysis. It rarely should be modified. Separating the recommendations, which are often modified, maintains the integrity of the report.

Business Process Improvement Toolbox (2nd ed.)
Bjørn Anderson
ASQ Quality Press
Milwaukee, WI, 2007
PGS 237 – 249
Tools for Implementing Improvements
All the previous categories of tools have to some extent been aimed at creating solutions or improvement actions to solve different problems. If these improvements are not implemented in the organization, the entire effort is wasted. Excellent improvement suggestions do no good lying in a drawer or on a shelf; they must be brought to life. This very difficult task consists of several subtasks:
- Sorting and prioritizing among the improvement proposals
- Organizing the implementation
- Setting targets for the improvements
- Developing an implementation plan
- Creating acceptance for the required changes and a favorable climate for the implementation
- Carrying out the implementation itself
This chapter partly addresses some general questions related to these tasks and partly describes some specific tools. The tools presented are:
- A △ T analysis
- flee diagram and process decision program chart
- Force field analysis
The remainder of this chapter contains a blend of descriptions of the more general tasks in the implementation phase and the more common tools. The first decision to be made in the implementation phase of an improvement project is usually what to implement. Often, the work of the preceding phases will have generated a number of possible changes. Rarely will the resources required to implement all suggestions be available. It is therefore a natural first step to prioritize the improvement proposals and start with those expected to produce the greatest effects or that for some other reason are preferred. Criteria that can be used for sorting the proposals are:
- The investment needs for introducing a new method or process
- The training needs for a new process
- Time limitations, both in the form of deadlines for the project and organizational restrictions with regard to the time available for performing the implementation task
- The organization's motivation level (that is, burned out or still enthusiastic)
A little more systematically, a four-field matrix can be designed, using the following issues as determining factors:
- Expected improvement effects
- The "implement ability" of the improvements, that is, how easy or difficult they will be to introduce in the organization
This will give a matrix like the one shown in Figure 12.1.

Improvements that fall within the low-hanging-fruit area are obviously the preferred ones to start with. Such a sorting will give a prioritized list of improvement actions in the order they should be implemented. There are several options for deciding how the implementation should be organized:
- By the original improvement team, where the same team that has carried out the project so far also undertakes implementing the improvements. The advantage of this approach is that the team knows the project and what the solutions entail.
- By a specific implementation team, where a new team is formed that consists of the necessary and suitable people to assume responsibility for the implementation itself. Even if this team does not know the work so far, it is often wise to include people in the implementation who were not involved in the development of improvement proposals. Thus, this approach can be sensible in some cases.
- In the line organization, where the functionally responsible people assume responsibility for implementing changes by using the resources of the ordinary organization. This is perhaps the most common model, where we ensure that those who will later perform the process also take part in implementing it.
After the model for organizing the implementation is selected, the next logical step is to set targets for the improvements: which performance level we want to achieve after the implementation has been completed. For this purpose, A △ T analysis is a helpful tool.
A △ T Analysis
A △ T is a tool that is quite closely related to both idealizing and value-added analysis. Whereas both of these tools are used to create improvement proposals, the main purpose of A △ T analysis is to set ambitious targets for the improvement work. The method is based on the assumption that it is always possible to find two durations, accumulated costs, total numbers of defects, or other accumulated performance measures for a given process:
- "A" stands for actual: the actual time, costs, and so forth, currently related to performing the process to be improved
- "T' stands for theoretical: the theoretically fastest time, lowest cost, and so forth, that can be achieved when performing the process
With A △ T defined this way, we see that the theoretical value is closely related to the ideal process in idealizing. Furthermore, if we are considering only time or cost, the theoretical value can often be found simply by subtracting OVA and NVA, identified through a value-added analysis. The analysis can be used in conjunction with these two tools. When performing an A △ T analysis, these two values can be used in two different ways. First of all, we can calculate the ratio between the, A and T values:

This ratio, A, expresses the improvement potential in eliminating all unnecessary activities and performing the process as efficiently as possible. The higher the ratio, the higher the potential. This ratio can also be used as an expression of how much there is to gain by approaching the ideal process.
For setting improvement targets, there is no need to calculate A. Instead, the target can be based on the T value. Whether the target should be set equal to the T value or somewhat less ambitious to take into account any practical limitations is an assessment that must be done in each specific situation. The steps of the analysis am as follows:
- Start the analysis from the flowchart for the current process.
- In the flowchart, add figures for time, cost, number of defects, and so on, for each activity.
- Critically evaluate each activity to determine whether it adds value. If it does not, determine whether it can be eliminated. Activities that can be eliminated are marked with a color or by some other suitable means.
- Summarize the A values and the T values, where the T values are all the non-marked activities, and calculate the ratio A △ T.
- Set the improvement target at or close to the T value.
When it comes to improvement targets, or targets in general, they should be:
- Ambitious enough to require some effort to be reached. Targets that are too easily attainable do not pose any challenges and rarely inspire great motivation. The result can therefore be a lower improvement gradient than what could have been the case had the targets been more ambitious.
- Realistic, so as not to deter. Targets that are too ambitious can cause the pendulum to swing too far to the other side, leading to frustration and reduced effort.
- Operative, so they are easy to comprehend and follow up, to monitor whether we are approaching the target.
Example
It has been claimed that when Ronald Reagan won his first presidential election, he gave all federal offices instructions to increase productivity by 5 percent within a year. After a year had passed, the results started coming into the administration office, and most were between 4.8 and 5.2 percent productivity increases. The target of 5 percent was probably not sufficiently ambitious, and a target of 10 percent would probably have resulted in figures between 9.8 and 10.2 percent. Because the target was set too low, it did not inspire and motivate sufficiently to reap the full effects possible. If, on the other hand, the target had been set at 50 percent, the results still might have been in the vicinity of 5 percent, as this would have been asking too much, creating frustration.
Example
A company that had reached the implementation phase of an improvement project had some problems in determining an improvement target for a reduced process duration. A suitable tool for this task was the A △ T analysis, as the company had produced a flowchart for the process and partly performed a value-added analysis. The flowchart with attached activity duration times and activities eligible for elimination marked is shown in Figure 12.2. As can be seen, the ratio between A and T is 2.05, that is, a potential for approximately halving the duration time of the process. To be a little more realistic, the target was reduced somewhat compared with the ideal, down to 12 days.

Tree Diagram and Process Decision Program Chart
Any project should have a project plan, as has already been emphasized. This is also true for improvement projects, especially in the implementation phase of such a project, which can often be viewed as a project of its own. Implementing improvements can often take longer than the total duration of the project thus far. It is therefore essential to have a project plan to guide this activity. Generally, such a plan should cover the following elements:
- Activities—those tasks that need to be carried out to implement the improvement proposals
- Sequence—the order in which the activities must be carried out
- Organization and responsibility—an indication of who is responsible for each activity, both carrying it out and monitoring its progress
- Schedule—a more detailed plan for when the activities should be carried out, including milestones for central results expected throughout the project
- Costs—estimates for the costs involved in the implementation
There are several techniques for project planning that involve different levels of scope and complexity. One easy-to-use tool, suitable for breaking down larger tasks into activities of manageable size, is a tree diagram. This diagram can be combined with more complicated calculation methods for the project, for example, PERT (Program Evaluation and Review Technique) or CPM (Critical Path Method). The approach for creating a tree diagram is as follows:
- Generate a list of activities that must be performed to implement the improvement proposals
- On sticky notes, write down each activity in the form of a verb followed by a noun
- Arrange the activities in logical subgroups that must be performed in sequence 4. Arrange the subgroups in an overall sequence to illustrate the entire plan in the tree diagram
A typical diagram will look like the one shown in Figure 12.3. The result will typically be a hierarchy of activities. The main activities, read from left to right in the diagram, represent the main tasks of the implementation. These main tasks will often be artificial activities (that is, names of a group of sub activities). Each of these main activities will therefore include a number of sub activities below them, to be carried out in the order they are presented from left to right. For each activity in the diagram, information about deadlines, responsibility, costs, and so on, can be attached.
The plan described in the preceding example is not very detailed and does not consider any unforeseen events during the implementation. This is typical in project plans of this type: they do not say what to do if something goes wrong. To include this element in the planning, we can use a process decision program chart (PDPC), which is really an extension of the tree diagram. This is a planning tool for making detailed implementation plans that include all possible negative events and problems that could occur along the way. Predicting such problems before they occur makes it possible to address them. This enables some form of preemptive problem solving, which is inexpensive compared with starting to think about solutions only after the problem has occurred. The PDPC is most often used when a large and complex task is to be carried out for the first time, where the costs associated with failure are exceedingly high, and where finishing by the deadline is critical. The approach for using PDPC is as follows:
- Generate a tree diagram for the implementation task or use one that has already been designed. At least to start with, it is wise to use a tree diagram that is not too complicated, as this can require undue time for analyzing possible problems for small, unimportant activities. An appropriate complexity contains the main activities with one level below them, as in the example shown in Figure 12.3.
- For each element at the lowest level of the tree diagram, ask questions like, what potential problems could occur during this activity? and what could go wrong here? For these questions, brainstorm a list of answers for each potential problem area. When no more answers surface, examine the list to eliminate problems that are unlikely or that are expected to have no significant consequences. Each element should include an assessment of the consequences in terms of time, cost, and quality.
- Add the remaining potential problems, those that are considered significant, to the diagram as what-if elements below the lowest level of activities. Use a different color or shape to separate these elements from the activities.
- For each what-if element, brainstorm possible countermeasures that can be undertaken if the problem occurs. These countermeasures should consist of reserve activities and indications of duration and cost. Place all countermeasures in the diagram, which is being transformed from a tree diagram to a PDPC. Place the countermeasures under the what-if elements and link them to the potential problems they solve. Again, use a different color to separate them from the what-if elements and the activities.
- Finally, evaluate each countermeasure with regard to ease of implementation, practicality, effectiveness, and so on. Mark difficult or ineffective ones with an X, and mark those you expect to be effective with an 0.

Example
A library decided to introduce a new computer-based registration system. To plan this task, the employees designed the tree diagram in Figure 12.4. For each activity, the completion date was attached.

Designing such a chart forces us to anticipate all possible problems that could occur during implementation and, importantly, develop countermeasures. This might change the original plan in order to avoid potential problems as well as prepare countermeasures in case problems do occur.

Example
The library that designed a tree diagram for introducing a new computer-based registration system took its study even further and created a PDPC for the implementation plan. The chart is shown in Figure 12.6.

Force Field Analysis
As mentioned at the beginning of this chapter, an important subtask in the implementation phase is to create acceptance for the suggested changes and a favorable climate for their implementation. This is a significant task that involves disciplines such as psychology and human resources management. A change process can be viewed as a formula involving the following elements:
Q = quality of the change approach
A = acceptance of the change among those involved
E = effectiveness of the change process
The formula is:
E= Q X A
Studies have shown that all successful change processes have high values for both Q and A, while most failed change projects also have high Q. The shortcomings are related to the acceptance of the changes. According to Miller (2002), there are often six layers of resistance:
- Disagreement that there is a problem at all
- Thinking the problem is outside our control
- Argumentation that the suggested solution cannot solve the problem
- Argumentation that the suggested solution will also cause negative effects
- Creation of barriers against the implementation
- Creation of doubt about whether others will cooperate for the solution
A general piece of advice is that the more information given to those who will be affected by the changes, the less resistance will be met. Thus, communication with everyone affected and others who might present obstacles to an effective implementation is essential. This includes:
- Top management, which has the authority to decide on implementation and allot the necessary resources for it
- Everyone involved in the process to be changed, as it is essential to motivate them for the change
- Everyone delivering input into the process or receiving output from it, as they could also be affected by the changes
- Other gatekeepers or people who can impact the implementation and its progress, usually people with financial authority
When it comes to creating a positive climate for the ensuing changes, force field analysis is a helpful tool that can contribute to creating an overview of the situation and possible actions to improve it (Andersen and Pettersen, 1996). Force field analysis is based on the assumption that any situation is a result of forces for and against the current state that are in equilibrium. An increase or decrease in the strength of some of the forces will induce change—a fact that can be used to create positive changes. A similar method is often referred to as benefits and barriers analysis. The approach is almost identical to force field analysis, with the exceptions that forces for the change are called benefits and forces against are called bathers. This method does not involve a diagram. The procedure for using force field analysis is as follows:
- Clearly define the change desired. This is information that can usually be taken directly from the implementation plan and its improvement objectives.
- Brainstorm all possible forces in the organization that could be expected to work for or against the change.
- Assess the strength of each of the forces and place them in a force field diagram. The length of each arrow in the diagram expresses the strength of the force it represents.
- Consider actions that could increase the forces for the change and reduce those against it, especially the stronger forces.
With these actions, the power balance surrounding the change could smooth the implementation. A force field diagram is shown in Figure 12.7.

Example
After identifying potential problems facing the introduction of a new computer system for registering transactions, as well as countermeasures for these, the library undertook a force field analysis to understand the climate for this major change. Important forces for the implementation included:
- The new system would dramatically improve the process of checking books in and out of the library, making it easier an employees.
- The system would automatically generate reminders for overdue books, thus replacing a currently manual job.
- Searches for titles would be quicker and easier.
- If the system worked as anticipated, it would dramatically improve customer service, which currently had a somewhat tarnished reputation.
Several forces working against the change were also identified:
- A general skepticism toward computer tools among many of the employees, whose average age was 42.
- Fear of computer problems that could not be solved as easily as with manual systems.
- Fear of becoming redundant due to reduced manpower needs.
Put into a diagram with the forces' strength represented by the arrow length, the resulting picture of the situation is as shown in Figure 12.8.

Finally, some general advice about effective implementation:
- To ensure full support for the changes, involve everyone responsible for results from the process being improved
- Try to elicit inspiration from those involved in the project
- Follow a clearly communicated plan
- Keep the affected employees informed about progress and achieved results
- Emphasize the importance of patience—changes do not happen overnight
Perhaps the greatest challenge in this phase of the improvement project is to maintain the team's intensity to ensure that the implementation is carried out. Therefore, continuous monitoring of progress is necessary with regard to:
- Time spent compared with the planned duration
- Resources consumed compared with the implementation budget
- The quality of the results