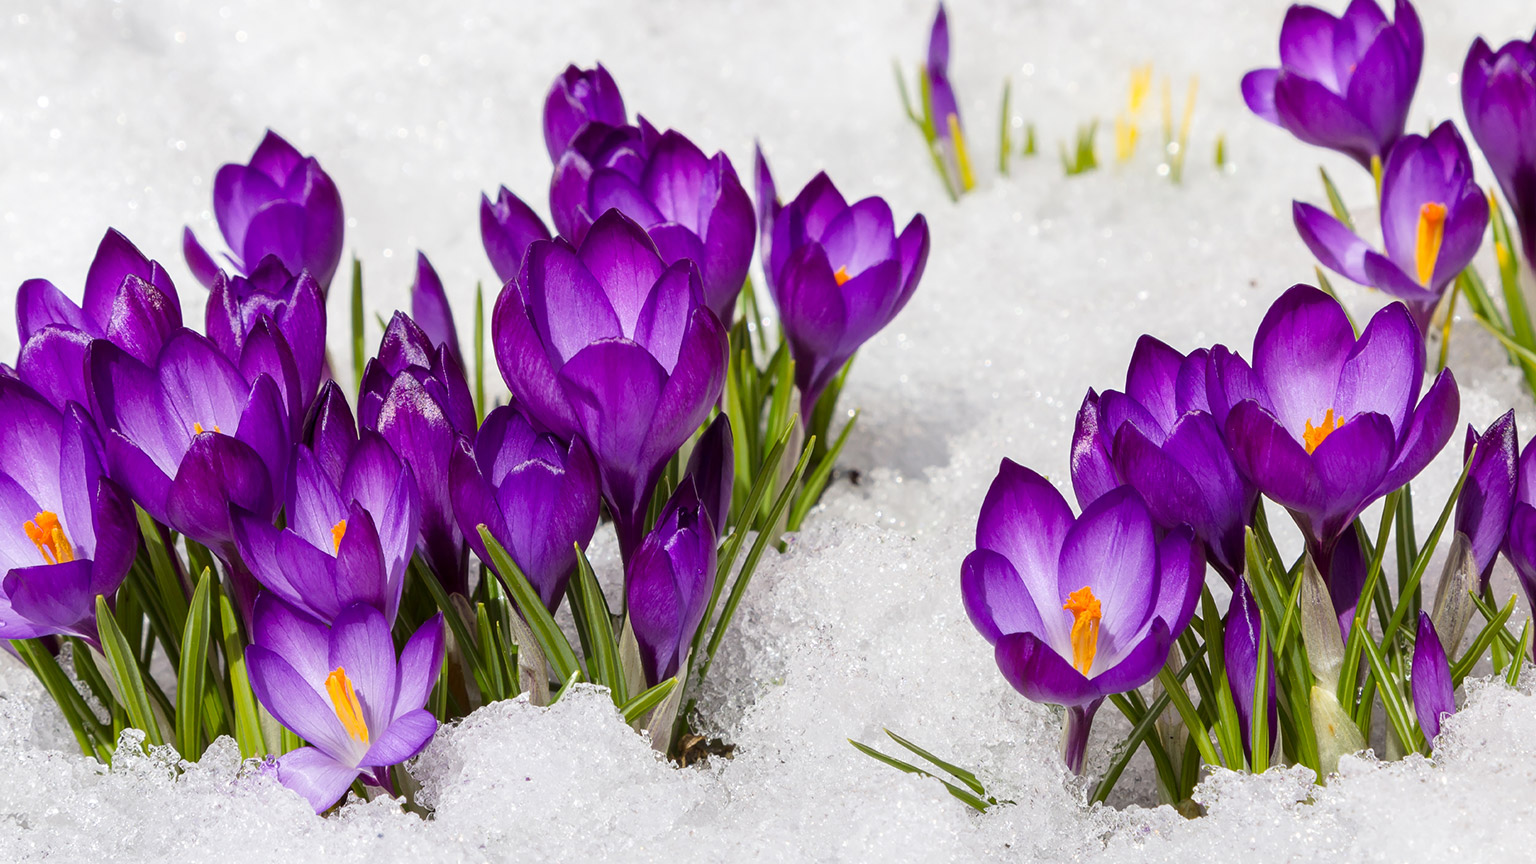
These crocus (Crocus sativus) flowers are not only getting moisture from the snow as it melts, but the snow provides some measure of insulation, protecting the plant from extreme cold temperatures and frost.
Now we know about how water is added to soil – through precipitation (rain, hail, snow) and irrigation – how it is held in the soil profile – based on soil texture – and how it leaves the soil – through evaporation, transpiration, and percolation deeper into the soil.
We can combine all that information to form a soil water budget. This topic will show you how.
But first, let's review the flow of water through the soil. Use these three cards to help you connect with the knowledge you already have about water flowing through soil. If you are still forming your understanding — don't worry. We're going to take a deep dive in this section.
We’re going to work through an example based on growing tomatoes in a loamy soil in Hokitika in February 2022, to show the impact of different approaches to irrigation.
You don’t need to know how to find all the information or do the calculations for this programme. Rather this is to show you one of the key ways irrigation scheduling is achieved in the horticulture industry.
The information we need for our budget:
| Data type | Value(s) | Data source we used |
|---|---|---|
| Soil texture | Loamy soil | - |
| Crop root depth | 0.45m | Estimated |
| Rainfall | 1 Feb: 0.4mm 10 Feb: 0.4mm 11 Feb: 3.8mm 12 Feb: 0.4mm 19 Feb: 5.2mm 20 Feb: 41.4mm 26 Feb: 0.2mm |
NIWA Cliflo |
| Average evapotranspiration (for a reference crop (ETO) in Hokitika in Feb 2022) | 3.2mm/day | NIWA Cliflo (see subtopic 7.2.2. of this Module for summary data) |
| Crop modifier - tomatoes | 1.15 | FAO Drainage Report 56, Chapter 6, table 11. |
| Average ET for our crop (ETC) | 3.7mm/day (3.2 x 1.15) | - |
| Maximum plant available water based on soil texture per metre of depth | 140mm | FAO Drainage Report 56 (see subtopic 7.3.5. of this module for summary data) |
| Maximum plant available adjusted for crop root depth (relative field capacity*) | 63mm (140 x 0.45) | - |
* This value is relative rather than absolute because it doesn’t include water than is held in the soil that is unavailable to plants.
Now that we have our data, here’s how to use the soil water budget table below.
- Each day, record the date and any rainfall that fell, in mm.
- Record the crop ET rate (ETC). You can find the ET rate for each day in the NIWA Cliflo database, but for this example we’re just going to use the average for that month which was 3.2mm/day.
- Calculate the plant available water for the day. This is found by: taking the previous day’s plant available water value, adding any rainfall or irrigation that was applied and then subtracting the ETC value.
| Date | Rainfall (mm) | Irrigation (mm) | ETC (mm/day) | Plant available water (mm) |
|---|---|---|---|---|
| 01/02/2022 | 0.4 | 3.7 | 20.0* | |
| 02/02/2022 | 3.7 | 16.3 | ||
| 03/02/2022 | 3.7 | 12.6 | ||
| 04/02/2022 | 3.7 | 8.9 | ||
| 05/02/2022 | 3.7 | 5.2 | ||
| 06/02/2022 | 3.7 | 1.5 | ||
| 07/02/2022 | 3.7 | -2.2 | ||
| 08/02/2022 | 3.7 | -5.9 | ||
| 09/02/2022 | 3.7 | -9.6 | ||
| 10/02/2022 | 0.4 | 3.7 | -12.9 |
* We are assuming that the plant available water was 19.6 on 31 January.
We can see that our plant available water goes into negative numbers which means on those days the water that remains in the soil is held too tightly for the plants to access it. They will start to wilt and die if not given some water quickly.
If we were keeping track of this information each day we would know when to irrigate to avoid this happening.
Take a moment and ensure you understand the concepts in this topic using this short four-question, single-answer quiz. The quiz will progress automatically.
Next up: We look at how to irrigate our crop effectively to keep the plants healthy and not waste water.
First, take a look at the three graphs that follow. These show the soil water budget for our Hokitika tomatoes for the whole month of February 2022, based on data from NIWA Cliflo. Select the labels or (+) signs to expand each section.

The only water being applied is rainfall, as shown by the light blue bars. The dark blue line shows the amount of plant available water in the soil. The red areas show when the water is no longer plant available – the 0mm line represents the permanent wilting point (PWP).

Here we are applying 32mm of irrigation every seven days, as shown by the mid-blue bars. At no time is the water unavailable to the plants, but we are applying more water than is needed, as shown by the upward trend of the blue line.

Here we’re applying 42mm irrigation to bring the soil close to field capacity (FC) and then only irrigating when needed.
In the first scenario the plants will start to wilt and will most likely die by the end of the month due to having no water for almost 20 days.
Both scenarios two and three provide enough water for healthy plants but use different amounts of water. The third of these three approaches is the preferred one: irrigate as required.
In that scenario, we use the information from our soil water budget to tell us when to irrigate and by how much. The rule of thumb is to irrigate when the available water drops to halfway between the FC and the PWP. Our soil has a relative FC of 63mm and our relative PWP is at 0mm, so we need to irrigate when our available water drops below 32 (63 / 2, rounded).
The following table provides a comparison of water application and volume of water needed for scenarios two and three for the duration of February 2022.
| Scenario two: Irrigate weekly | Scenario three: Irrigate as required | Water saved by using scenario 3 | |
|---|---|---|---|
| Total irrigation (mm) | 128mm | 74mm | |
| Water needed to irrigate 100m2 of crop | 12,800L | 7,400L | 5,400L (5.4m3) |
| Water needed to irrigate 1ha of crop | 1,280,000L (1,280m3) |
740,000L (740m3) | 540,000L (540m3) |

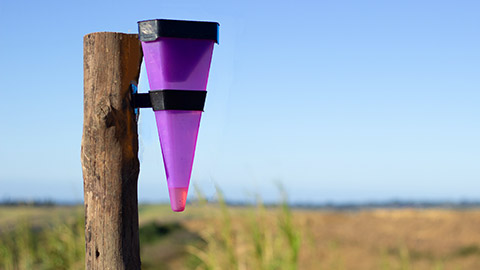
This purple device is a rain gauge — it measures rainfall. Knowing how much rain has fallen helps you to manage your water income.
Now that we’ve seen how we can use data to guide our irrigation choices, here are some general guidelines for applying irrigation.
- Measure and record rainfall in your garden: Use this information when choosing whether to irrigate and how much water to apply.
- Even if you don’t use a soil water budget, knowing how much rain fell gives a good idea of when you need to irrigate and when you don't.
- You can buy a rain gauge cheaply from your local garden centre or hardware store.
- Use a moisture meter: Consider getting a soil moisture meter so you can check the amount of water in the soil.
- Remember that basic soil moisture meters generally aren’t accurate enough to use to base calculations on but are more accurate than guessing.
- Knowing the depth of plant roots is critical: If your plants have shallow roots they can't access water deep in the soil profile.
- Water infrequently but deeply (at a low rate for a long time). For instance, rather than applying 4mm per day to offset evapotranspiration, we applied 32mm every week or so. Frequently watering leads plants to grow shallow root systems, but infrequent watering encourages them to send their roots down to look for water. This makes plants more drought-tolerant.
- To increase the amount of water in the soil:
- Add organic matter to act as a sponge and hold water in the soil.
- Add a layer of mulch to slow down the rate of evaporation.
- Increase the amount of water applied by irrigation.
- To decrease the amount of water in the soil:
- Adjust irrigation to apply less water.
- Test soil for organic matter. If this is high, stop adding organic matter.
- Test soil percolation rates. Identify the limiting factor (at which depth the percolation rate slows) and address accordingly.
If you go on to study horticulture at a higher level, or work in a horticulture operation, you’ll learn more about how to manage soil water.
How well did you understand this topic? Take this short quiz two-question quiz to consolidate your learning. Use the navigation beneath the questions to progress.
