Welcome to Pricing. In this topic, you will learn about:
- Price definition
- Elements of price planning
- Developing pricing objectives
- Estimating demand
- Determining costs, break-even analysis and mark-ups
- Examining the pricing environment
- Choosing a pricing strategy

Price refers to the amount of money charged for a product or a service, also referred to as the assignment of value.
When you think of price, you probably think of the amount of money you have to pay to purchase a product, or enjoy a service. Price certainly includes the cost of an item, but it also includes other things that must be exchanged as part of a transaction as well. For example, many international business transactions are characterized by various forms of barter or countertrade that do not involve an exchange of money at all.
The price of a product or service is typically the sum of all the values that customers give up to gain the benefits of having or using said product or service. For example, the purchase of a car may include trade-in of your existing vehicle along with a cash payment.
Price, or the amount the consumer must exchange in order to receive the offering can be assigned to:
- money, goods, services, favors, votes, or anything else that has value to the other party
- bartering: parties exchange goods or services (typically seen more frequently in business to business exchanges.
Price is one of the most important elements that determines a firm’s market share and profitability, it is the only element in the marketing mix that produces revenue; all other elements represent costs.
The term ‘price’ may also be referred to as:
- Tuition
- Interest on credit card
- Professional fee
- Insurance premium
- Airplane fare
- Bitcoin: most popular of type of cryptocurrency or digital currency
- Network of computers is called the blockchain
Opportunity costs
Opportunity costs refer to the something that we have to give up in order to obtain something else. For example, think about the “price” that must be paid by an individual for a two-week-long vacation at an all-inclusive resort. What else must be given up the individual besides the monetary cost of the vacation?
For part-time employees who are paid by the hour, the income they lose by not working during the vacation period represents an opportunity cost. The situation with full-time employees is a little different. While one can assume that the employee is paid for their vacation time, there is still an opportunity cost in that they can’t “return” the vacation and get their days “back” to use again, if they don’t like the resort, or if the weather is bad.
The opportunity cost for children may include missed learning opportunities (if the parents take the children out of school for the trip), or missed opportunities for other recreational activities that may be occurring at home during the same time span (football games, parties with friends, etc.).
Getting to the right price
It is very rare for someone to agree to buy something without knowing the price. There are steps to be aware of regarding price planning with several factors involved, some being of great significance for marketers such as non-monetary costs.
The process of price planning follows a sequence of steps that begins with setting pricing objectives, let us look at each of these steps in more detail.
Elements of price planning
Firms undertake price planning in six steps, as shown in the image below. The process begins by setting objectives which is then followed by estimating demand and determining relevant costs. Examination of the pricing environment precedes the choice of a pricing strategy and the implementation of pricing tactics.
The following illustration shows the breakdown and order of steps within the process of price planning.
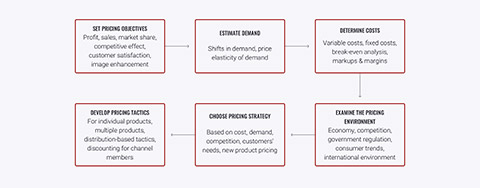
Let us look at each of the stages involved in more detail.
When embarking on price planning, the first important step is to develop pricing objectives which support the broader objectives of the firm as well as overall marketing objectives.
See the image below which discusses examples of elements for consideration when price planning.
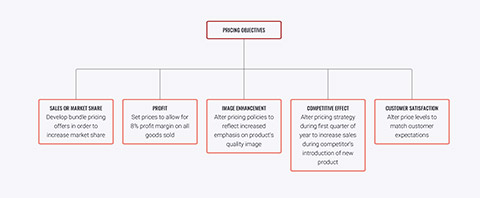
Focus on a level of profit growth or a target net profit margin, therefor prices are sett accordingly in order to achieve a designated percentage of profit margin. For example, setting prices to allow for an 8 percent profit margin on all goods sold.
Focus on the dollar or units sold while market share objectives attempt to increase market share. For example, developing bundle pricing offers in order to increase market share.
Along with the pricing plan, competitive effect objectives attempt to dilute the competition’s marketing efforts. For example, altering the pricing strategy during the first quarter of the year to increase sales during a competitors introduction of a new product.
Focus on keeping customers for the long term. For example, altering price levels to match customer expectations.
These objectives attempt to get customers to relate a high price to better quality. For example, altering pricing policies to reflect the increased emphasis on the products quality image.
Prestige products such as Rolls-Royce or Rolex have a high price tag, but appeal to customers’ thoughts about “status”.
Factors in price setting
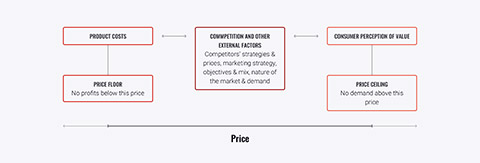
As we have discussed, there are several factors to consider when setting the price for a product or service. The image below summarizes the major considerations in setting prices and suggests three major pricing strategies:
- customer value-based pricing
- cost-based pricing
- competition-based pricing.
If customers perceive that a product’s price is greater than its value, they will tend not to buy the product. On the other hand, if the company were to price the product below its costs, the company’s profits would suffer, the aim, therefor, would be to find the sweet spot between the two extremes. The right pricing strategy is the one that delivers both value to the customer and profits to the company.
Now that the pricing objective have been appropriately developed, let us now consider estimating demand, the second step in the price planning process.
Demand refers to customers’ desire for a particular product. A key question is how much does this desire fluctuate with changes in pricing levels, how much are customers willing to pay as the price of the product goes up or down? A concept known as a demand curve. Economists use a graph of a demand curve to illustrate the effect of price on the quantity demanded of a product.
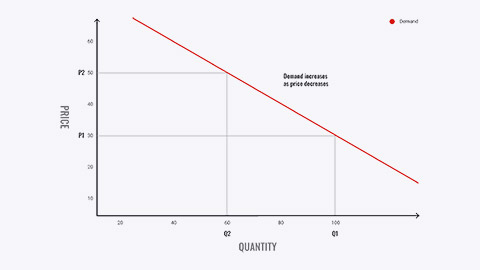
The law of demand shows: As price goes up, quantity demanded goes down, see the image below which shows and example of a demand curve.
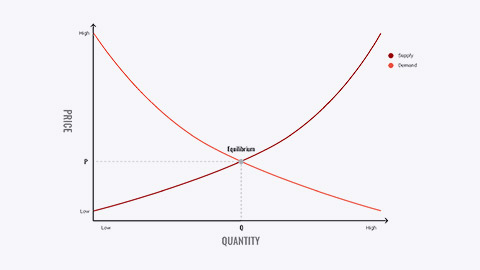
The demand curve, which can be a curved or straight line, shows the quantity of a product that customers will buy in a market during a period of time at various prices if all other factors remain the same.
In the real world, factors other than the price and marketing activities influence demand. For example, if it rains, the demand for umbrellas increases and the demand for tee times on a golf course is a wash.
Factors such as the development of new products may also influence demand for old ones. For instance, even though a few firms may still produce phonographs, the introduction of cassette tapes and then CDs and iPods has all but eliminated the demand for new vinyl records and turntables on which to play them.
Demand curves for normal products
Demand curve for prestige products
Demand curves illustrate the effect of price on quantity demanded.
For example, see the image below, a graph reflecting the demand for normal products, the demand curve isn’t a curve at all, but rather is just a straight line. In this situation, the law of demand dictates that as price goes up, quantity demanded declines.
The vertical axis of demand curves shows the various prices that a firm might be willing to charge for a product. Demand is portrayed as the number of units that consumers are willing to purchase at a given price. Thus when price is set at $30 (P1), the quantity demanded is forecast to be 100 units (Q1) while a price increase to $50 (P2) results in a drop of demand to 60 unit (Q2).
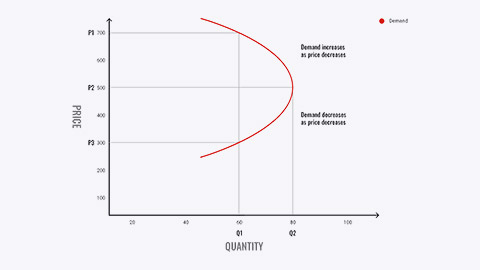
However, the law of demand does not always accurately reflect how price and demand interact. For example, brands that are marketed on the basis of prestige, status or simple snob appeal are characterized by a very different sort of demand curve, as shown below.
In this situation, low prices make the product undesirable as consumers simply can not reconcile a low cost with a prestigious product. They may suspect the brand is a counterfeit, for example.
Alternatively, as price increases, so does demand, to a certain point and this may actually increase the quantity demanded. Some consumers feel that a product becomes more desirable as the price increases simply because not everyone can afford to buy it and typically, as a result, some buyers will drop out of the market. It is the combination of these factors creates the backward-facing demand curve shown for Prestige Products as seen above.
Shifts in demand
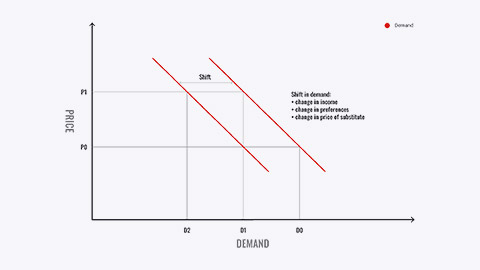
A shift is a change in direction or position. Shifts can occur naturally, such as when the paparazzi catch a celebrity using a company’s products. Sometimes “viral” social media postings can cause upward or downward shifts in products, depending if the posts are positive or negative. Consider what shift in demand would occur if your favourite movie star was photographed drinking a Starbucks beverage or if a YouTube video showed a particular brand of cellphone catching fire all by itself? Why?
As seen in the graph below, marketers can stimulate shifts through effective marketing such as changes in preferences.
- An upward shift is when a greater demand for a product occurs, for example, change in income
- A downward shift is when demand suddenly drops.
Price elasticity of demand
Price elasticity is term given to the percentage change in unit sales that results from a percentage change in price. This is important as marketers need to know how customers are likely to react to a price change. Marketers know that price elasticity of demand is an important pricing metric.
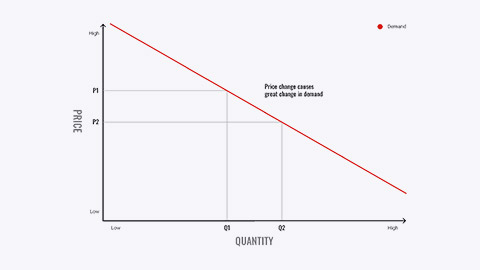
Elastic demand is when changes in price have large effects on the amount demanded, typically meaning customers are sensitive to changes in price.
Inelastic demand is when changes in price have little or no effect on the amount demanded, customers less (or not at all) sensitive to changes in price.
See the below examples of establishing price elasticity of both elastic and inelastic demand.
Elastic demand
Price changes from $10 to $9
$10 - $9 = $1
1/10 = 10% change in price
Demand changes from 2,700/month to 3,100/month
3,100 - 2,700 = 400 (increase)
Percentage increase
400 ÷ 2,700 = .148 ≈ 15% change in demand
Price elasticity of demand
\begin{equation} {\frac{percentage\ change\ in\ quantity\ demanded}{percentage\ change\ in\ price} } = \frac{15\%}{10\%} = 1.5 \end{equation}
Inelastic demand
Price changes from $10 to $9
$10 - $9 = $1
1/10 = 10% change in price
Demand changes from 2,700/month to 2,835/month
2,835 - 2,700 = 135 (increase)
Percentage increase
135 ÷ 2,700 = .05 ≈ 5% change in demand
Price elasticity of demand
\begin{equation} {\frac{percentage\ change\ in\ quantity\ demanded}{percentage\ change\ in\ price} } = \frac{5\%}{10\%} = 0.5 \end{equation}
Elastic Demand equation
%∆P → %∆Q>1 ➔ E>1
↓
%∆Q = 1 ➔ Elastic
%∆P
Inelastic Demand equation
%∆P → %∆ 0<Q<1 ➔ 0<E<1
%∆Q = E<1 ➔ Inelastic
%∆P
| Elasticity Ratio | Type of elasticity | Description |
|---|---|---|
| E = ∞ | Perfectly elastic | Any very small change in price results in a very large change in quantity demanded. |
| 1 < E < ∞ | Relatively elastic | Small changes in price cause large changes in quantity demanded. |
| E = 1 | Unit elastic | Any change in price is matched by an equal change in quantity. |
| 0 < E < 1 | Relatively inelastic | Large changes in price cause small changes in quantity demanded. |
| E = 0 | Perfectly inelastic | Quantity demanded does not change when price is changed. |
Price-elastic demand
price-inelastic demand
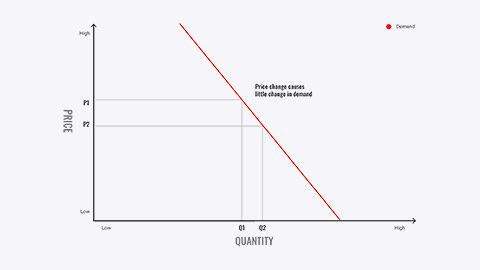
Elasticity of demand is defined as the percentage change in unit sales that results from a percentage change in price, the elasticity of demand may be either elastic or inelastic.
When changes in price have large effects on the amount demanded, demand is elastic. Thus an increase in price can negatively impact revenues when the percentage increase in price cannot compensate for the revenue lost through lower unit sales.
When changes in price have little or no effect on the amount demanded, demand is inelastic. Such situations make it much easier for marketers to change price without negatively impacting the volume of sales.
Cross-elasticity of demand
The essence of cross-elasticity of demand is that when products are substituted for one another, a price increase in one will be reflected as an increase in price for the other, meaning, changes in the prices of other products may affect a product’s demand.
However, when products are complements, meaning that one product is essential to the use of the first, an increase in the price of one will decrease demand for another.
Substitutes, an increase in the price of one will increase demand for the other:
↑P Good B ➔ ↑Q Good A
eXPD < 0 Positive
Complementary for use of a second, an increase in the price of one decreases demand for another (for example, hot dogs & ketchup) ↑P Good B ➔ ↓Q Good A
eXPD < 0 Negative
Cross-price elasticity of demand is the percentage change in the quantity demanded of ‘good A’ as a result of a percentage change in price of ‘good B’:
%△Q Good A = eXPD
%△P Good B
Specific examples of these are shown below, click on each to read more:
Increasing the price of Diet Dr Pepper to $5.99 a 12-pack from $4.99 could easily increase demand for Diet Dr Thunder (currently selling for over $2.00 less per 12-pack in the PPT author’s market).
Increasing the price of pay-per-view movies available via cable could increase demand for Netflix (movie rental by mail or download).
General indicators of customer price sensitivity
Price sensitivity is generally high if factors in the following three areas are present.
Product
- Low differentiation of alternatives
- Has easy comparability
- Will perform as expected
- Is not mission-critical
Price
- Has easy comparability
- Is high in a relative sense
- Reference price exists
- Not needed as a quality cue
Buyer
- Is sophisticated and deliberative
- Bearing costs
- Able to switch easily
- Is not motivated by prestige
Pricing in Different Types of Markets
Before setting prices, the marketer must understand the relationship between price and demand for the company’s product. The seller’s pricing freedom varies with different types of markets.
- Pure competition
- Monopolistic competition
- Oligopolistic competition
Under pure competition, the market consists of many buyers and sellers trading in a uniform commodity, no single buyer or seller has much effect on the going market price. Sellers in these markets do not spend much time on marketing strategy.
Under monopolistic competition, the market consists of many buyers and sellers trading over a range of prices rather than a single market price, a range of prices occurs because sellers can differentiate their offers to buyers. Sellers try to develop differentiated offers for different customer segments and, in addition to price, freely use branding, advertising, and personal selling to set their offers apart.
Under oligopolistic competition, the market consists of only a few large sellers. Because there are few sellers, each seller is alert and responsive to competitors’ pricing strategies and marketing moves.
In a pure monopoly, the market is dominated by one seller. The seller may be a government monopoly, a private regulated monopoly, or a private unregulated monopoly. Pricing is handled differently in each case.
The third step of the pricing process requires that the marketer be certain that the products price will cover costs. For this to happen, marketers must estimate; variable costs, fixed costs, average fixed costs and total costs.
Variable Costs: Per-unit costs of production that will fluctuate depending on how many units a firm produces (such as the costs to make a pizza, labour costs of cooks, and boxes for the pizza)
Fixed Costs: Costs that do not vary with the number of units produced (such as rent on the building, electricity, water, and insurance)
Average fixed costs: fixed cost per unit
Total costs: total of fixed and variable costs for a set number of units produced
Break-even analysis
Break-even analysis is important because it helps marketers understand the relationship between costs and price and therefor indicates to marketers how many units must be sold in order to cover all costs. The break-even point is the point at which the total revenue and total costs are equal and beyond which the company makes a profit; below that point, the company will suffer a loss, knowing the break-even point will tell you at what point the firm will start making a profit.
Contribution per unit is the difference between the price the firm charges for a product and the variable costs.
Break-even analysis assuming a price of $100
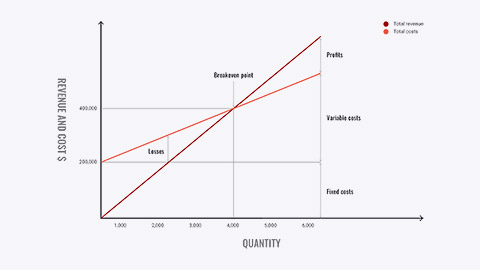
Break-even analysis is a critical technique used by marketers to determine the number of units which must be sold at a given price to cover total costs.
As seen in the graph above, total revenue and total cost are equal at the break-even point. Assuming a price of $100, the manufacturer will reach the break-even point (in units) at 4,000, which, when multiplied by the $100 unit price, indicates a break-even point (in dollars) of $400,000.
This concludes that sales of more than 4,000 units will yield profits, but sales below the break-even point will lead to financial losses.
Markups and Margins: Pricing Through the Channel
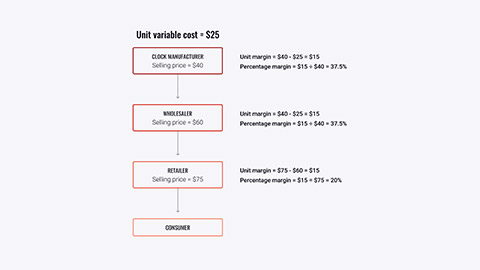
Markup is an amount added to the cost of the product to create a price at which the channel member will sell the product.
Most products are not sold directly from the manufacturer to the consumer; thus channel pricing considerations are often part of the marketer’s job. Marketers must make certain that they price the product in a way that will allow each member of the distribution channel to earn a profit before selling the product in turn to the next member of the distribution channel, or to the ultimate consumer. Of course, the final price to the ultimate consumer cannot be so high that will refuse to purchase the product.
Several terms must be understood as each has a place in pricing the product, the following are key terms which you should become comfortable and well versed in.
- Gross margin
- Retailer margin
- Wholesaler margin
- List price or manufacturer’s suggested retail price (M.S.R.P)
Let us look at closer at what each of these terms is referring to.
The markup amount is often called the gross margin, which not only covers the profit expected by the channel member, but also the fixed costs of the retailer or wholesaler. Retailer margin and wholesaler margin are just two different names for gross margin, but specific, as the names imply, to either retailers or wholesalers.
The markup should never exceed the list price, or manufacturer’s suggested retail price (MSRP), as this is the price the manufacturer has estimated that the end customer should be willing to pay. This means that even if the customer is willing to pay $10 for a product, the manufacturer must sell the product for less than this amount to the retailer. If a distributor or wholesaler is also used, the price charged by the manufacturer will be lower still to ensure that both the distributor and retailer can add adequate markups to make handling the product viable.
Markup can be calculated as a percentage of the final selling price, or as a percentage of the price paid for the product. For simplicity sake, let’s assume markup is calculated on the basis of final price.
- $10 – final price to consumer. Retailer margin = 30%. 1 – 0.3 = 0.7 $10 x 0.7 = $7 price to retailer if manufacturer sells directly to them.
- Assuming that a wholesaler is also in the picture, and that the wholesaler’s margin is 20%, 1 – 0.2 = 0.8 $7 x 0.8 = $5.40. Thus the manufacturer would price the product at $5.40 to the wholesaler.
Prices, Costs, and Margins in the Channel of Distribution
The fourth step is to examine the pricing environment. A key step within effective marketing and price setting is to try to anticipate how the competition will react to pricing changes, this involves firms considering external influences when making pricing decisions. These influences can be categorised as economic and non-economic forces.
Economic influences
The Economy
Consumers become very price sensitive when economic conditions appear bleak.
Factors impacting pricing strategies
- Boom or recession
- Inflation
- Interest rates
Responses to the frugality of post-recession consumers
- Cut prices and offer discounts
- Develop more affordable items
- Redefine value propositions
As we have discussed, it is essential that marketers also consider the firm’s external environment when they set prices. Broad economic trends such as the business cycle, economic growth, inflation, and consumer confidence may help a firm determine which pricing strategy is most appropriate.
In particular though, marketers need to understand how price impacts consumers during times such as a recession. Consumers’ tend to become very price sensitive when economic conditions are bleak. For example, Procter & Gamble (P&G) suffered market share, sales, and profit declines in 2008 as consumers switched away from P&G’s premium-priced brands to cheaper alternatives. P&G chose both price-cutting and product enhancement strategies as a means of combating the recession. For example, they created a more absorbent Pampers diaper without increasing price. On the other hand, Starbucks chose to keep its premium image intact by raising prices of its multi-ingredient sugary coffees by between 10 and 30 cents. Popular beverages such as lattes and brewed coffee from 5 to 15 cents.
Inflation, on the other hand, often allows marketers to increase prices because consumers have become accustomed to price increases. Unfortunately, during inflationary periods, consumers may also grow fearful about the future and cut back on purchases. If this happens, the marketers may actually lower prices and temporarily sacrifice profits to maintain sales.
Non-Economic Influences
Competition
The industry structure can influence pricing a great deal, as a result, marketers must also try to anticipate how the competition will react to pricing changes. Oligopolies (a market or industry that is dominated by a small group of large sellers), such as the airline industry, typically attempt to avoid price competition and are more likely to price similarly in order to remain profitable. Restaurants and other industries characterized by monopolistic competition -vary their prices, and focus on non-price competition as each sells at least a somewhat different product. This type of pricing strategy is aided by the fact that consumers are less likely to comparison shop as the offerings between different firms within an industry are usually different enough to make comparisons difficult. And of course, there is typically little opportunity to alter price in a purely competitive market such as is found with most agricultural products and commodities.
Pricing wars can be disastrous, so it’s not always smart to continually lower prices. During price wars, consumers’ perceptions of a “fair price” may change, leaving a target market who is unwilling to pay “normal” prices once the war is over.
Government regulation
Laws and government agencies impact pricing decisions. Government regulation impacts pricing in two ways: Firstly, the various regulations enforced at the federal and state levels increase the costs of production. Secondly, the President and government has the ability to freeze or regulate prices, including credit card fees, interest rate charges, etc.
Consumer trends
Consumer cultural and demographic trends can strongly influence prices. One example is that even consumers who are well-off see nothing wrong with bargain-hunting, particularly in tough economic times.
The International environment
A special economic consideration in international price setting is the exchange rate and exchange rate volatility. Changes in the exchange rate can substantially influence the profitability of a brand sold in a foreign market and the marketing environment varies widely between countries, therefor, with these factors in mind, companies may vary their pricing depending upon the country in which their product is sold. Very often unique environmental factors force marketers to adapt their pricing strategies. For example, in developing countries, consumers often cannot afford the cost of a bottle of detergent or shampoo. Instead, marketers create one-use packages called sachets that sell for just a few cents and make the product affordable to consumers of that country. It is important to note that the competitive environment and government regulations also impact international prices.
Now we have established our market and audience, our methods to capture their attention and analyzed pricing demands, let us now consider the approach to choosing a pricing strategy. Have a look at the table below which defines some common terms used within this stage.
| Pricing Situation | Description |
|---|---|
| Product line pricing | Setting prices across an entire product line |
| Optional-product pricing | Pricing optional or accessory products sold with the main product |
| Captive-product pricing | Pricing products that must be used with the main product |
| By-product pricing | Pricing low-value by-products to get rid of or make money on them |
| Product bundle pricing | Pricing bundles of products sold together |
Product Mix Pricing

Captive products can account for a substantial portion of a brand’s sales and profits. For example, Gillette has long sold razor handles at low prices and made its money on higher-price, higher-margin replacement blade cartridges. “The razor business is all about the blades,” says an analyst. “Get consumers hooked on your razor, and they buy the highly profitable refill blades forever.” Last year, Gillette sold well over half a billion dollars’ worth of refill blades at prices ranging up to a hefty $5 per cartridge.
Gillette has lost market share in recent years as price-fatigued customers have shifted to lower-priced private-label upstarts such as Dollar Shave Club and Harry’s. In order to compete, Gillette was recently forced to slash cartridge prices across the board by 15 to 20 percent.
New Product Pricing Strategies
Companies bringing out a new product face the challenge of setting prices for the first time. They can choose between two broad strategies. These are market-skimming pricing and market-penetration pricing.
Market-skimming pricing (price skimming)
Market-skimming pricing or price skimming refers to setting a high price for a new product to skim maximum revenues, layer by layer, from the segments willing to pay the high price. The company makes fewer but more profitable sales. This strategy works only under certain conditions. First, the product’s quality and image must support its higher price, and enough buyers must want the product at that price. Second, the costs of producing a smaller volume cannot be so high that they cancel the advantage of charging more. Finally, competitors should not be able to enter the market easily and undercut the high price.
Market-penetration pricing
Market-penetration pricing refers to setting a low price for a new product in order to attract a large number of buyers and a large market share. The high sales volume results in falling costs, allowing companies to cut their prices even further, however, several conditions must be met for this low-price strategy to work. First, the market must be highly price sensitive so that a low price produces more market growth. Second, production and distribution costs must decrease as sales volume increases. Finally, the low price must help keep out the competition, and the penetration pricer must maintain its low-price position, otherwise, the price advantage may be only temporary.
Let us look at a some examples of price adjustment strategies.
Price Adjustment Strategies
| Strategy | Description |
|---|---|
| Discount and allowance pricing | Reducing prices to reward customer responses such as volume purchases, paying early, or promoting the product |
| Segmented pricing | Adjusting prices to allow for differences in customers, products, or locations |
| Psychological pricing | Adjusting prices for psychological effect |
| Promotional pricing | Temporarily reducing prices to spur short-run sales |
| Geographical pricing | Adjusting prices to account for the geographic location of customers |
| Dynamic pricing | Adjusting prices continually to meet the characteristics and needs of individual customers and situations |
| International pricing | Adjusting prices for international markets |
Responding to Competitor Price Changes
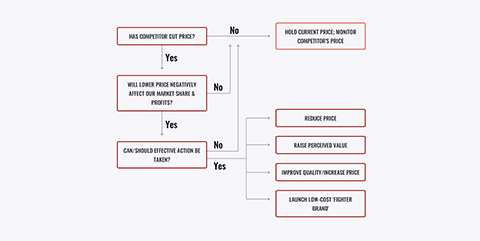
This figure shows the ways a company might assess and respond to a competitor’s price cut.
If a company learns that a competitor’s price cut that is likely to harm company sales and profits, it might make any of the following four responses:
- Reduce its price to match the competitor’s price.
- Maintain its price but raise the perceived value of its offer.
- Improve quality and increase price, moving its brand into a higher price–value position.
- Launch a low-price fighter brand—adding a lower-price item to the line or creating a separate lower-price brand.
Read the following articles:
The Good-Better-Best Approach to Pricing
Pricing Policies That Protect Your Brand
Upgrade Your Pricing Strategy to Match Consumer Behavior
Listen to the following podcast:

