Environmental issues are harmful effects of human activity on the biophysical environment. Global environmental issues are those which are beyond the scope of a single nation to address and instead require concerted action from the global community, for example, climate change.
The complex environmental issues caused by humanity׳s huge and growing urban resource consumption and pollutant discharge has become an increasingly prominent problem. Facing this dilemma, researchers have looked for ways to understand the components of the problem to guide their search for solutions.
Major current environmental issues may include:
-
Climate change - Global warming and the resulting large-scale shifts in weather patterns.
-
Pollution - The introduction of contaminants into the natural environment that causes adverse change. Such as air, soil, noise, and water pollution.
-
Environmental degradation - The deterioration of the environment through depletion of resources such as air, water and soil, the destruction of ecosystems, habitat destruction, the extinction of wildlife, and pollution.
-
Resource depletion - The consumption of a natural resource (non-renewable and renewable) faster than it can be replenished.

Carbon dioxide levels in the atmosphere have increased by more than 45% since the Industrial Revolution and are now the highest they have been for at least 800,000 years.www.climatecouncil.org.au
What is climate change?
Climate is different from weather. When we talk about the Earth’s climate, we are referring to the average weather conditions over a period of 30 years or longer. Weather, on the other hand, refers to what you see and feel outside from day to day (e.g. sunny, rainy).
So climate change is any change in the climate, lasting for several decades or longer, including changes in temperature, rainfall or wind patterns.
The best scientific evidence we have shows that our world is rapidly heating.
Long-term air and ocean temperature records clearly show the Earth is warming. The global average temperature has already risen by 1.1°C since the time before the Industrial Revolution. This might not sound like a lot, but 1.1°C represents a massive amount of extra heat and energy – equal to four Hiroshima bomb detonations per second.
While the earth’s climate has changed throughout history, scientists agree that the significant changes we’ve seen over the past hundred years or so have been due to human activities. Recent warming is also happening at a rate that is much faster than previous climatic changes.
What is causing climate change?
It is caused, in short, by the excessive amount of greenhouse gases entering the Earth’s atmosphere due to human activity. These greenhouse gases are causing our climate to heat dramatically.
Let’s break it down - A certain amount of greenhouse gases (like water vapour, ozone, carbon dioxide, methane and nitrous dioxide) occur naturally. For example, carbon dioxide is produced through the respiration of natural ecosystems (plants), or through the decay of organic matter (biomass). These greenhouse gases act like a blanket in our atmosphere, trapping some of the sun’s heat close to the Earth’s surface. This is known as the ‘greenhouse effect’ – and it makes the planet warm enough for us to live.
But since the Industrial Revolution (which began in the mid to late 1700s), greenhouse gases have built up in the atmosphere, leading to more heat being trapped close to the earth’s surface. This is because Western civilisations began digging up and burning coal, oil and gas on a massive scale. At the same time, agriculture, tree-clearing (deforestation) and the production of waste (landfill) also increased. All of these processes also produce greenhouse gases. Carbon dioxide is the most significant of all the greenhouse gases, followed by methane.
As more greenhouse gases are added to the Earth’s atmosphere, more of the sun’s heat is trapped. This causes the Earth’s average temperature to rise.
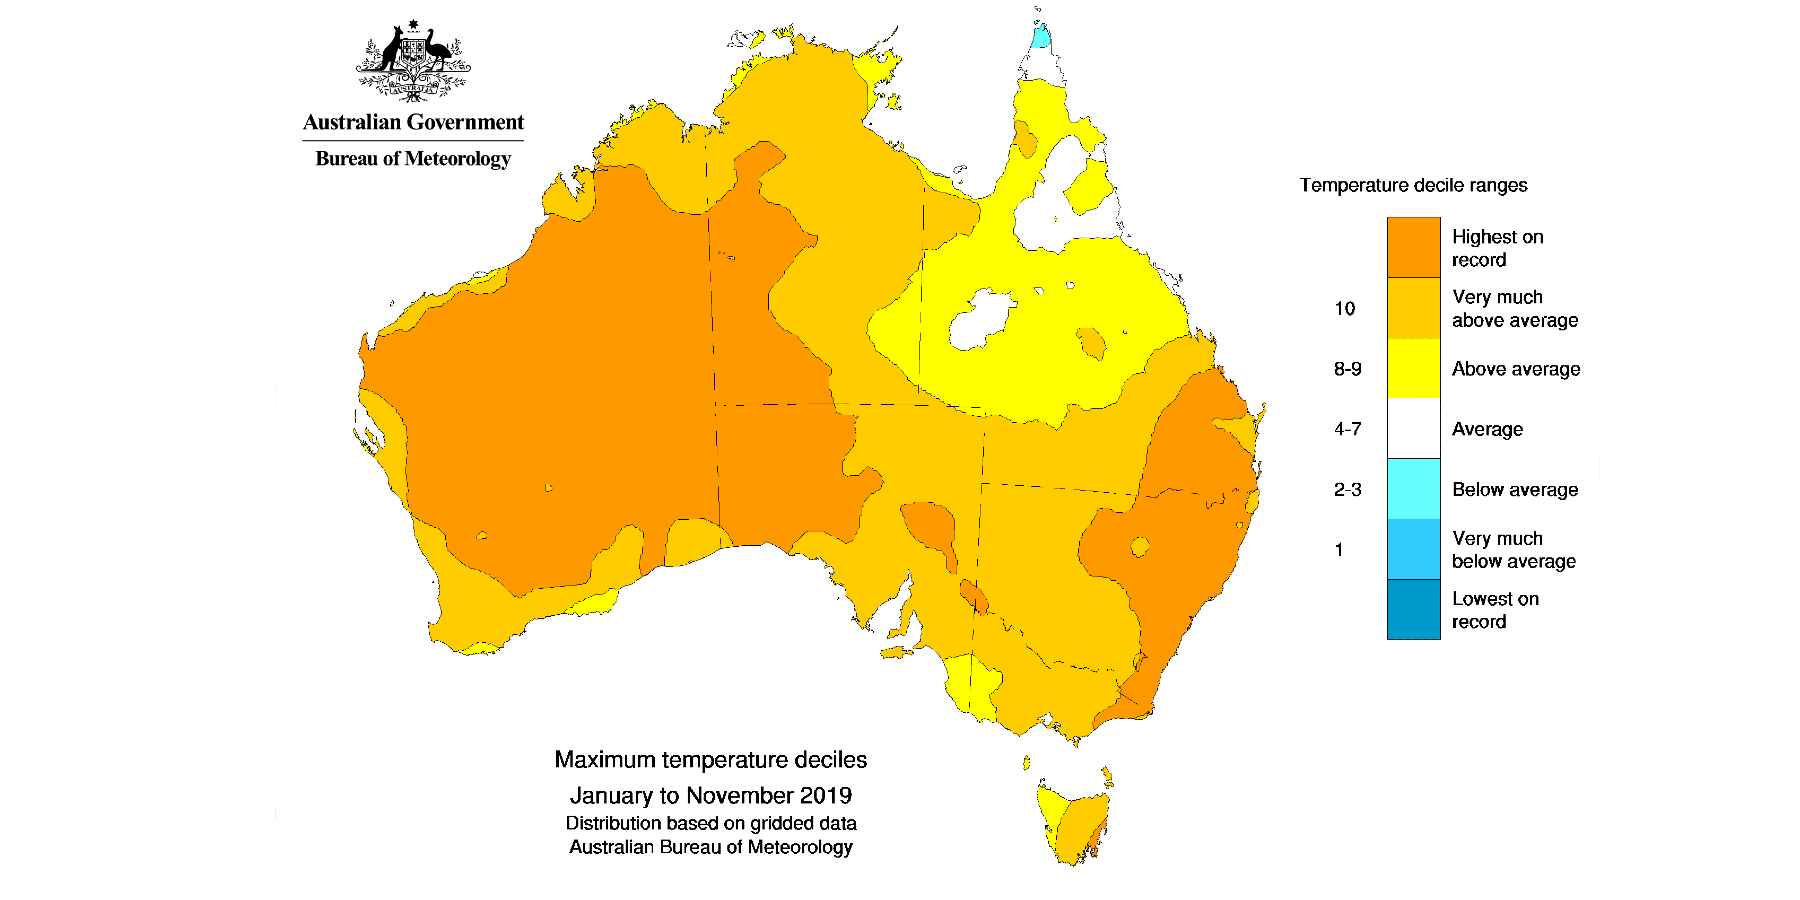
The map below displays Australian BOM data of average minimum temperature deciles for 2019:
What are the main sources of greenhouse gas emissions in Australia?
There are eight major areas (sectors) in Australia responsible for our greenhouse gas emissions;
-
Electricity - Emissions from burning coal and gas to power our lights, appliances and more.
-
Transport - Emissions from petrol and diesel used to power cars, trucks and buses, and emissions from aviation fuel used to power planes.
-
Stationary energy - Fuels like gas consumed directly, rather than used for electricity, in industry and in households.
-
Agriculture - Greenhouse gases such as methane and nitrous oxide produced by animals, manure management, fertilisers and field burning.
-
Fugitive emissions - Gases vented via leaks during fossil fuel extraction and/or transportation.
-
Industrial processes - Emissions produced by converting raw materials into metal, mineral and chemical products.
-
Waste - Emissions from decaying organic matter.
-
Land use, land use change and forestry (LULUCF) - Emissions and removals mainly from forests, but also from croplands, grasslands, wetlands and other lands.
How do scientists know the climate is changing?
Scientists collect data about the climate by testing a number of things, for example:
-
Air and ocean temperature.
-
Precipitation.
-
Sea levels.
-
Ocean salinity and acidity.
-
Tree rings.
-
Marine sediments.
-
Pollen.
Some are simple tests while others are complicated long term studies.
Ice cores from Antarctica are incredibly helpful in showing how the climate has changed over time, because they can provide a record of what the level of greenhouse gases such as carbon dioxide and methane were in our atmosphere in the past, as well as providing clues about past temperatures. Ice core data stretches back 800,000 years and shows that the concentration of greenhouse gases in our atmosphere over this period has never increased so quickly, or by so much, as it has during recent times.
Carbon dioxide levels in the atmosphere over the past 800,000 years, based off data from ice cores (highest previous concentration was 300 ppm). C02 levels have never been as high as they are now (2018 Average was 407.4 ppm). Source: NOAA
Pulling all of the various data together, scientists have concluded that humans have been driving the significant changes in climate that we are currently experiencing.
Note: The evidence that supports human-caused (anthropogenic) climate change is vast and includes many lines of evidence published in tens of thousands of peer-reviewed scientific journal articles.
How does climate change affect us?
The impacts of climate change in Australia, include:
-
Increased frequency and/or severity of extreme weather events including floods and droughts.
-
More frequent, more intense and longer-lasting heatwaves. Heatwaves are deadly, having killed more people than all other extreme weather events in Australia combined.
-
Greater risk and severity of bushfires and earlier, longer bushfire seasons.
-
Sea level rise, leading to more coastal flooding, erosion and saltwater intrusion into freshwater wetlands, such as in the World-Heritage listed Kakadu National Park. Low-lying properties near rivers and coastlines are also at risk posing significant threats to commercial, industrial, road, rail, and residential assets.
-
Impacts on wildlife due to heat stress, drought and habitat changes, which have flow-on effects down the food chain. Australia holds the first record of a mammalian extinction due to climate change with other species on the brink.
-
More frequent marine heatwaves, which impact marine ecosystems such as the Great Barrier Reef. After the back-to-back marine heatwaves in 2016 and 2017, 50% of the coral on the Great Barrier Reef died. Mass bleaching occurred again in 2020.
-
Impacts on health due to changes in air pollution and air-borne allergens (such as pollen), vector-borne diseases, extreme weather events and other factors. (Refer to U.S. Global change research program essay on climate change and human health.)
-
Increased pressure on emergency services and health systems, as the fire seasons of states and territories increasingly overlap which stretches resources, and the health impacts of climate change worsen.
-
Agricultural impacts from more frequent droughts, floods and heatwaves.
Why do only a few degrees of warming matter?
A few degrees of warming is incredibly significant.
We are already experiencing these impacts today, at a rise in temperature of just 1.1°C since the pre-industrial period. In recent times, Australia has been rocked by the Black Summer of 2019-2020 characterised by catastrophic bushfires, unprecedented in their scale and harm; has seen devastating floods in Townsville, and a fierce drought which has threatened the food and water security of Australians for many years.
The risks to our wellbeing and livelihoods, and to other species and ecosystems, become much more profound as temperatures continue to rise.
The work of the Intergovernmental Panel on Climate Change (IPCC) shows the dire consequences we face if we fail to limit the global temperature increase to 1.5°C. Even at 1.1°C of global warming, how much the global temperature has increased by so far, the impacts we have seen from a changing climate have been intolerable. Lives, livelihoods and homes have been unnecessarily destroyed and communities are under constant pressure.
It is essential that we do our best to hold global temperatures as low as possible, as shown in the following table:
| 1.5°C | 2°C | Impact of 2°C compared to 1.5°C | |
| Loss of plan species. | 8% of plants will lose ½ their habitable area. | 16% of plans will lose ½ their habitable area. | 2x worse |
| Loss of insect species. | 6% of insects will lose ½ their habitable area. | 18% of insects will lose ½ their habitable area. | 3x worse |
| Further decline in coral reefs. | 70% - 90% | 99% | up to 29% worse |
| Extreme heat. | 14% of the global population exposed to severe heat every 1 in 5 years. | 37% of the global population exposed to severe heat every 1 in 5 years. | 2.6x worse |
| Sea-ice-free summers in the artic. | At least once every 100 years. | At least once every 10 years. | 10x worse |
Source: www.climatecouncil.org.au
For more information, refer to NASA provided school resource on Climate Change.
Every living thing needs energy. For human beings, day to day living and working, requires the power from something external, such as; electricity, oil or gas. This power is used to provide heat, light, cooling, food, and transport to name a few.
Energy can be classified as:
-
Renewable Energy - Comes from sources that can be renewed or will never run out. This includes energy from on-going natural phenomena such as wind, sunlight, tides, gravity and geothermal heat (e.g. hot springs from deep underground). These sources of energy are considered to be kinder to the environment. Often called ‘green’ energy, they don’t produce harmful greenhouse gases when used.
-
Non-renewable Energy - Sources are those that cannot be replaced in a short amount of time when they have been used. Also known as fossil fuels, they take millions of years to form. So, in effect, when they're gone, they're gone! Coal, natural gas and crude oil are all examples of non-renewable energy sources. Australia, and the rest of the world, currently gets most of its energy from non-renewable sources, but that is slowly changing.
Why is energy a global environmental issue?
Non-renewable energy sources (fossil fuels) such as coal, crude oil and natural gas are extracted and burned to produce energy. The extraction, production, and consumption processes release carbon dioxide and other greenhouse gases which in turn trap heat in the Earth's atmosphere, making them the primary contributors to global warming and climate change.
Refer to National Geographic resources on Fossil Fuels.
Electricity is the largest source of greenhouse gas emissions in Australia, responsible for 32% of emissions. This is mainly because 84% of our electricity comes from burning fossil fuels, the large majority of this (59.9%) is from burning coal.
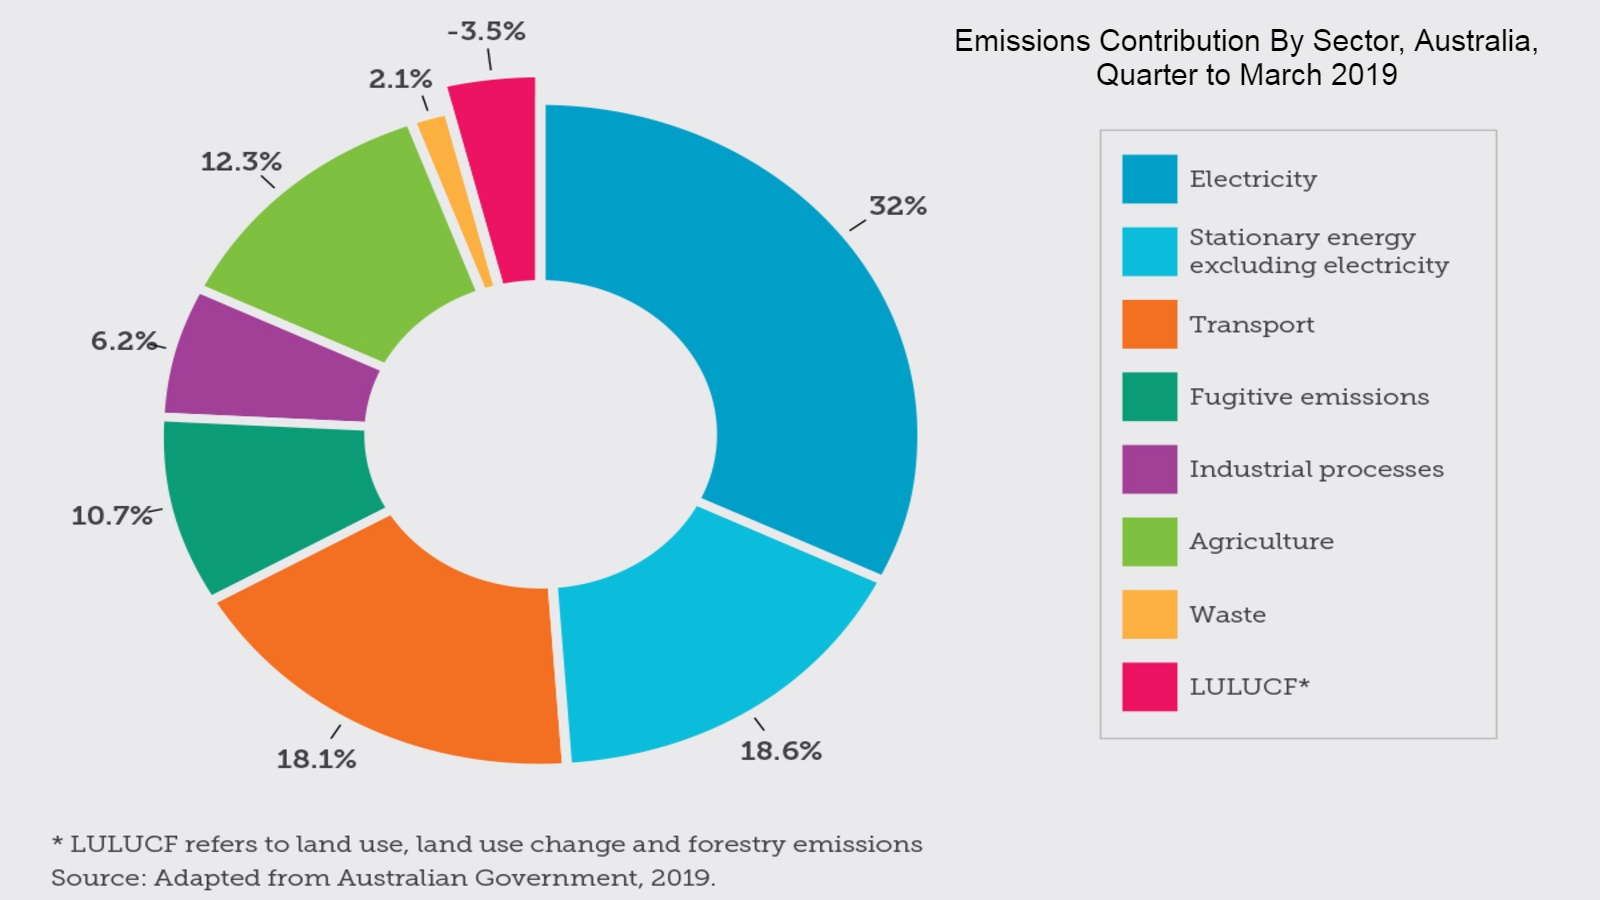
The above graph displays Australia’s greenhouse gas emissions by sector, 2019. Electricity remains the biggest contributor of greenhouse gases in Australia.
The following SBS video provides an overview of Australia's energy network.
What about renewable energy?
Renewable energy sources like solar, wind and hydro are less harmful to the environment than non-renewable energy sources like coal.
There are also other technologies, such as; energy harnessing technologies (geothermal energy, bioenergy, and ocean energy), and grid strengthening technologies (battery storage, and smart technology which predicts when and where electricity is required).
Fortunately, Australia is the sunniest and one of the windiest countries in the world, which means we are perfectly placed to generate our electricity from renewable energy sources, like solar and wind.
Updating Australia’s energy system with renewables and storage is crucial for cutting our greenhouse gas emissions and combating climate change.
Governments around the world are now engaged in efforts to ramp down greenhouse gas emissions from fossil fuels to prevent the worst effects of climate change. At the international level, countries have committed to emissions reduction targets, while other entities—including cities, states, and businesses—have made their own local commitments. These efforts generally focus on replacing fossil fuels with renewable energy sources, increasing energy efficiency, and electrifying sectors such as transportation and buildings.
However, many sources of carbon emissions, such as existing power plants that run on natural gas and coal, are already locked in. Considering the world's continuing dependence on fossil fuels, many argue that in addition to efforts aimed at replacing them, we also need to suck carbon from the air with technologies such as carbon capture, in which emissions are diverted to underground storage or recycled before they reach the atmosphere. A handful of commercial-scale projects around the world already capture carbon dioxide from the smokestacks of fossil fuel-fired plants, and while its high costs have prevented wider adoption, advocates hope advances in the technology will eventually make it more affordable.
Australia needs to actively transition away from fossil fuels like coal, oil and gas, including those we export. As the second largest exporter of both thermal coal (which is burned to generate electricity) and gas, Australia has a huge influence on global emissions and the fossil fuel market. If we include all the fossil fuels that Australia exports, Australia is the fifth biggest polluter in the world – so we’re a big deal when it comes to climate change.
Source: www.climatecouncil.org.au / www.nationalgeographic.com / www.arena.gov.au
The following video illustrates the Energy challenges that global communities face today as well as some possible solutions.
Australia should not approve any new fossil fuel projects, and must actively phase out existing projects to reduce emissions. This process has to support fossil fuel-dependent communities and workers – and make sure that they have opportunities to move into other industries.
Land use is the management and modification of land for various uses, including agriculture, forestry, mining, industry and urban development.
Land management is the process of managing the use and development (in both urban and rural settings) of land resources. Land resources are used for a variety of purposes which may include organic agriculture, reforestation, water resource management and eco-tourism projects. Land management can have positive or negative effects on the terrestrial ecosystems as land being overused or misused can degrade and reduce productivity and disrupt the balance of nature/ecosystems. - Source: www.wikipedia.org/wiki/land_management
The following map of Australia illustrates Australian land use as of 2011.
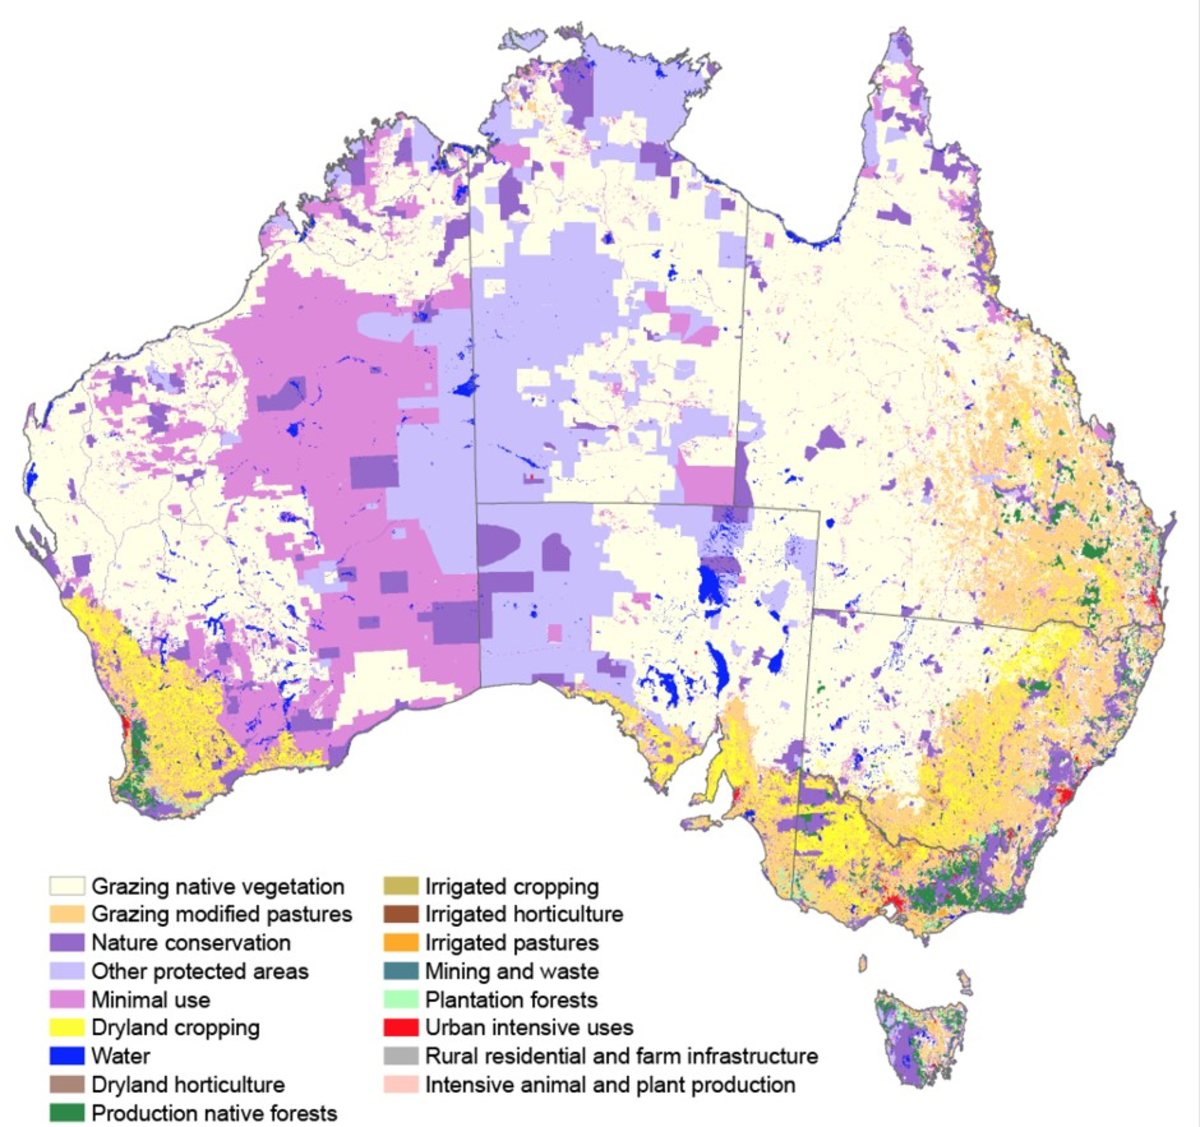
Source: Figure above, Australian land use at the national scale, 2010–11 Australian Bureau of Agricultural and Resource Economics and Sciences, used under CC BY 3.0
An Overview of Australian Land Use:
Australia’s population is concentrated along the eastern, south-eastern and south-western coastal fringes (refer above, Urban intensive uses areas in red.)
To many living in these areas, the daily experience is one of dense urban, industrial and residential zones, fringed by intensive horticulture and agriculture, human-made water bodies and perhaps production forestry. Yet cities account for less than 0.2 per cent of Australia’s land area.
The dominant land use, in terms of extent, is livestock grazing of native vegetation (44.9 per cent); grazing of modified pastures accounts for another 9.2 per cent. Nature conservation and other forms of protection, together with minimal use, are the principal use for 38.2 per cent of Australia’s land area. Dryland cropping is practised on approximately 3.6 per cent of the land area.
Examples of areas where land management practices are carried out include:
The area of land formally owned and managed by Indigenous Australians has continued to increase, to 42 per cent of Australia’s land area.
Indigenous people, their land, and their cultural and natural resource management activities are core contributors to managing Australia’s environment.
Indigenous lands contain significant levels of biodiversity, and long-term investment in Indigenous land management programs has delivered environmental, cultural and economic benefits (Altman et al. 2007, SVA Consulting 2014, van Bueren et al. 2015). Indigenous land, water and sea interests occur over 41.8 per cent (3,217,101 square kilometres) of Australia.
Indigenous people comprise 2.7 per cent of Australia’s population, and the proportion of the Indigenous population that is on Indigenous lands is just 25.1 per cent. More than 50 per cent of these Indigenous land interests lie in very remote areas of Australia and on some of the least commercially viable lands (Altman et al. 2007). Indigenous communities in these remote regions face key challenges for enterprise development, key services, and employment (Jackson et al. 2012, Altman & Markham 2014, Woinarski et al. 2014b).
Land management and, in places, the carbon economy, may bring potential benefits to Indigenous communities in terms of income, jobs, social welfare, links to community and reconnection with Country. However, land tenure will not necessarily bring economic benefits to Indigenous communities, and other legislative constraints may preclude economic development options for communities, keeping some indigenous communities as the most disadvantaged in Australia.
Since 2011, areas managed for conservation have continued to expand, to around 18 per cent of Australia’s land area. During the past decade, Australia’s terrestrial conservation estate (International Union for Conservation of Nature categories I–VI) expanded by more than 50 per cent to nearly 140 million hectares. However, calculations suggest that nearly 25 per cent of the continent of Australia needs to be protected to meet the strategic goals of the Convention on Biological Diversity (Polak et al. 2016).
Land under conservation management now includes a rapidly growing area dedicated to, and managed for, conservation by private owners (e.g. conservation trusts). The extent of private conservation lands is now more than 7 million hectares.
The sophistication of agricultural land management continues to increase. This is seen in ongoing reductions in the intensity of agricultural chemical use in the cotton industry for example, due largely to the adoption of genetically modified cotton (Acworth et al. 2008); more careful use of fertilisers in sensitive environments (e.g. catchments of the Great Barrier Reef); and more flexible approaches to grazing management to reduce soil erosion and increase productivity.
The role of farmers as caretakers and the part that they play in conserving their land is increasingly recognised.
Horticultural production supply, quality and profitability are threatened by introduced and native pests, diseases and weeds. Integrated pest and disease management uses a number of different integrated methods, rather than relying on a single approach. This is advantageous when managing native animals (e.g. parrots, fruit bats) as pests, insects and diseases (Horticulture Australia 2006). Integrated pest management practices aim to integrate all available pest control techniques to produce healthy crops with the least possible disruption to the agro-ecosystem, rather than relying on routine applications of chemical pesticides.
Native vegetation is increasingly recognised as valuable in this process as native vegetation remnants host a higher density of predatory insects and spiders than crops; crops usually host higher densities of pests (immature and mature) than native vegetation (Parry et al. 2015). Remnant vegetation also provides parasite habitat, which contributes to pest suppression in crops. Management and improvement of remnant vegetation can increase the predator to prey (pest) ratio, which can improve pest control in grain and cotton crops (Bianchi et al. 2013). Retention and management of remnant native vegetation can also maintain populations of native bees (agricultural crop pollinators), which are more abundant and diverse in agricultural landscapes with more remnant native vegetation (especially riparian vegetation) than in those with less native vegetation (Cunningham et al. 2013).
Agricultural practices also aim to protect the soil and prevent nutrient leaching, erosion, and sediment movement to protect water resources and oceans. For example, modelled estimates of the nutrient and sediment loads reaching the Great Barrier Reef lagoon suggest that changes to the landscape—grazing, bushfires, and vegetation clearing for agriculture and urban development—will increase sediment deposition to more than 3 times background (pre-European colonisation) levels (McCulloch et al. 2003, Kroon et al. 2012, Waters et al. 2014). Australia's waterways and ecosystems can not survive this.
Principles and guidelines for managing stocking rates, watering points and groundcover condition aim to improve water quality through best-practice livestock grazing (Bartley et al. 2010, Silburn et al. 2011, Hunt et al. 2014). Significant investment by the Australian Government, state and territory governments, and industry has led to a better understanding of the source and causes of nutrient and sediment increases, and engagement with natural resource management (NRM) bodies, industry and farmers is modelled to be potentially achieving significant (10–30 per cent) decreases in sediment loads.
A combination of good contextual understanding, participation across the range of stakeholders and adequate funding should thus result in better-quality water reaching the Great Barrier Reef. In the Fitzroy Basin in Queensland, adoption of best management practice is high in dryland cropping enterprises as a result of the Reef Water Quality Protection Plan, even though croppers have not received the same resources as graziers and cane growers (Darbas et al. 2013).
The area of public native forest managed for wood production has continued to decline since 2011, to around 7.5 million hectares. There has been a corresponding increase in the extent of public native forest in conservation reserves (Davidson et al. 2008).
Plantation forests funded by managed investment contracted significantly to around 400,000 hectares in 2012–13 from 730,000 hectares in 2008–09, which represents around 20 per cent of Australian plantations compared with 36 per cent in 2008–09 (ABARES 2014).
The extent and severity of wildfires in south-eastern Australia have rekindled debate about strategies for fire suppression, how best to balance protection of life and property with the protection of environmental assets, residential expansion in forested regions, and the future viability of some native forest-based industries (Teague et al. 2010).
Carbon Sequestration is the processes to remove carbon from the atmosphere, involving capturing and storing carbon in vegetation, soil, oceans, or another storage facility.
The recent expansion in the use of land and vegetation for carbon sequestration, carbon emissions avoidance and emissions reductions has become a mainstream interest for industries and governments. The advantages and risks of biosequestration compared with other forms of sequestration (e.g. geological capture and storage) may have a very large impact on future rural land use and management. Biosequestration is the storage and removal of carbon from the atmosphere by conversion of carbon dioxide into biomass, generally by photosynthetic plants or bacteria via land-use practices such as reforestation, sustainable forest management, and genetic engineering.
Models of carbon stocks and flows in native forests managed for timber production, of harvested wood products (including paper), and of long-term storage of harvested wood product wastes in landfill suggest broadly positive benefits when whole-of-system accounts are considered (Ximenes et al. 2016). These benefits include both sequestration—with carbon fixed for the long term in both timber products and timber wastes stored as landfill—and carbon emissions avoidance.
For example, the use of native timber products for paper pulp has significant greenhouse gas mitigation potential compared with the carbon emissions footprint of imported paper pulp from unsustainably managed forests in South-East Asia.
On balance, careful management of production forests was shown to have a better modelled carbon outcome than conservation management (Ximenes et al. 2016), although challenges remain to show that production management approaches are environmentally sustainable in the long term (Lindenmayer et al. 2015).
An example of a fire management practice - Savanna burning for reduced carbon emissions;
Fires in the savannas of northern Australia release the greenhouse gases methane and nitrous oxide as they burn. These emissions from Australia’s savanna fires comprise 2–4 per cent of the National Greenhouse Gas Inventory (Cook & Meyer 2009). Thus, there is potential to use fire management to reduce greenhouse gas emissions by increasing the incidence of early dry-season fires, to reduce the extent of large, high-intensity fires late in the dry season, and to reduce overall fire frequency and consequently the average emissions of greenhouse gases.
The approach has been developed as the ‘Emissions abatement through savanna fire management’ methodology to reduce accountable emissions under Australia’s Carbon Farming Initiative.
An example of the implementation of this initiative is the West Arnhem Land Fire Abatement Project, which involves multiple traditional land-owning groups in an area spanning 24,000 square kilometres in the Northern Territory (Cook et al. 2012). The primary goal of the project is to reduce greenhouse gas emissions.
During the first 7 years of implementation, the project has reduced emissions of accountable greenhouse gases (methane and nitrous oxide) by 37.7 per cent, relative to the pre-project 10-year emissions baseline (Russell-Smith et al. 2013).
Additionally, the project is providing the means to reconnect people to their Country, to keep alive traditions and to adapt them to new circumstances.
It is also reducing the impact on the biodiversity of decades of out-of-control fires, and providing an opportunity for traditional ecological knowledge and western scientific approaches to jointly inform future land management.
The CSIRO is currently working with the Australian Government Department of the Environment and Energy to quantify the increased carbon sequestration that can occur from changing fire management.
The recent downturn in the mining industry has put some proposed developments on hold and resulted in the cessation of activities at other sites.
A dramatic expansion in coal mining and the coal seam gas (CSG) industry in some prime agricultural regions has caused conflict because of competition for land and concerns about contamination of, and competition for, water resources.
The associated infrastructure and expansion of export facilities are also placing pressure on some coastal environments.
Most of the announced CSG reserves are already committed to the liquefied natural gas industry from 2015–16, with the potential for domestic gas shortages in eastern Australia and the prospect of large increases in gas prices. A consequence is that exploration for shale gas and tight gas has increased because shale gas is likely to be plentiful and has the potential to be an economically very important additional energy source (Cook et al. 2013). Increased use of shale gas (and other gas) for electricity generation could significantly decrease Australia’s greenhouse gas emissions, based on the replacement of coal with gas (Cook et al. 2013).
Shale gas, like CSG, has possible adverse impacts on the landscape, soils, flora and fauna, groundwater and surface water, the atmosphere, and human health, through hydraulic fracturing (fracking), habitat fragmentation, disruption of ecological processes, fugitive gas emissions and so on.
Changes to the Environmental Protection Board (EPBC) Act recognised that national environmental assets could be affected by changes to water quality, quantity and availability as a consequence of coal mining or CSG extraction. In response, the Australian Government has invested in a Bioregional Assessment Programme, which is compiling the scientific evidence necessary to support decisions taken by states and territories about the potential impacts of, controls for, and mitigations available for, any new developments (e.g. the New South Wales review by the Chief Scientist and Engineer; O’Kane 2014).
Relevant industries have also taken steps to maintain public confidence and obtain a social licence to operate through offsetting impacts of mining developments—for example, the Gas Industry Social and Environmental Research Alliance.
Australian cities and coastal settlements continue to sprawl, despite some successful attempts by local, state and territory governments to manage development to protect biodiversity, good-quality agricultural lands and areas prone to flooding.
For example, one of the stated purposes of the Planning and Development Act 2005 of Western Australia is to ‘promote the sustainable use and development of land in the state’. This includes protecting the land of agricultural significance from urban and peri-urban encroachment, maintaining appropriate buffers between development and coastal estuarine and water foreshores, and accounting for sea-level rise and increased storm surge arising from coastal development.
There is also a growing recognition of the value of green space in urban areas for recreation, biodiversity, visual amenity, flood mitigation and other ecosystem services.
Source: www.soe.environment.gov.au
Examples Of Environmental Impacts Of Land Use
Land-use change is arguably the most pervasive socioeconomic force driving changes and degradation of ecosystems. Deforestation, urban development, agriculture, and other human activities have substantially altered the Earth’s landscape. Such disturbance of the land affects important ecosystem processes and services, which can have wide-ranging and long–term consequences.
Agricultural land provides open space and valuable habitat for many wildlife species. However, intensive agriculture has potentially severe ecosystem consequences. For example, it has long been recognised that agricultural land use and practices can cause water pollution and the effect is influenced by government policies. Runoff from agricultural lands is a leading source of water pollution both in inland and coastal waters. Conversions of wetlands to crop production and irrigation water diversions have brought many wildlife species to the verge of extinction.
Forests provide many ecosystem services. They support biodiversity, providing critical habitat for wildlife, remove carbon dioxide from the atmosphere, intercept precipitation, slow down surface runoff, and reduce soil erosion and flooding. These important ecosystem services will be reduced or destroyed when forests are converted to agriculture or urban development. For example, deforestation, along with urban sprawl, agriculture, and other human activities, has substantially altered and fragmented the Earth’s vegetative cover. Such disturbance can change the global atmospheric concentration of carbon dioxide, the principal heat-trapping gas, as well as affect local, regional, and global climate by changing the energy balance on Earth's surface (Marland et al. 2003).
Urban development has been linked to many environmental problems, including air pollution, water pollution, and loss of wildlife habitat. Urban runoff often contains nutrients, sediment and toxic contaminants, and can cause not only water pollution but also a large variation in streamflow and temperatures. Habitat destruction, fragmentation, and alteration associated with urban development have been identified as the leading causes of biodiversity decline and species extinctions (Czech, Krausman and Devers 2000; Soulé 1991). Urban development and intensive agriculture in coastal areas and further inland are a major threat to the health, productivity, and biodiversity of the marine environment throughout the world.
Source: www.choicesmagazine.org
According to the Hazardous Waste (Regulation of Exports and Imports) Act 1989, Waste means a substance or objects that: (a) is proposed to be disposed of; or (b) is disposed of; or (c) is required by a law of the Commonwealth, a State or Territory to be disposed of.
Consumption is the act of consuming, as by use, decay, or destruction. In an economic sense, consumption is the using up of resources, goods or services, either by consumers or in the production of other goods.
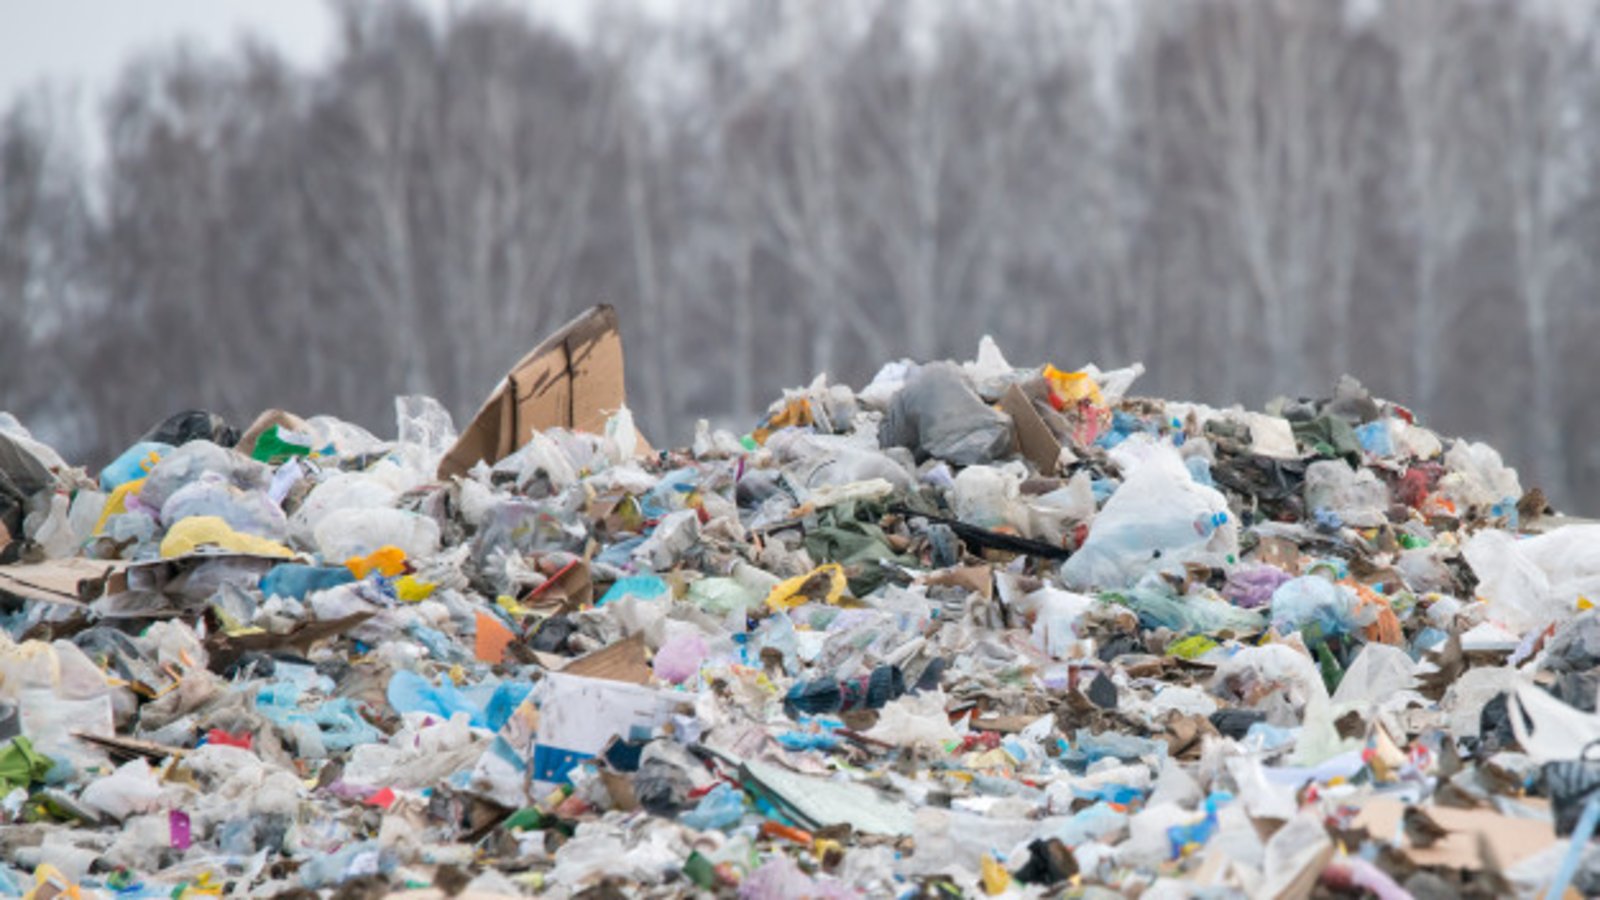
Almost everything we do creates waste, and as a society, we are currently producing more waste than ever before. In 2016-17 Australia generated about 67 million tonnes of waste, and that figure is increasing. The cost of food waste alone to the economy is estimated at $20 billion each year.
Types of household waste:
In 2016-17 around 6.7 million tonnes of organic waste was sent to landfill and included food waste, biosolids, green waste and timber.
When organic waste decomposes in landfills, it produces landfill gas which consists of about 55% methane. Methane is a much more damaging greenhouse gas than carbon dioxide (CO2). It's also foul-smelling and highly flammable.
Organic material sent to landfill would be better composted at home or dropped at a local green waste recycler. Check with your local council to find out about organic waste facilities in your area.
When buying paper or cardboard products, look out for items that contain a high percentage of Australian recycled fibre or are made with fibre content from sustainably managed sources, such as plantations or sustainably managed native forests. Australian paper manufacturers have to meet environmental production standards which may not have to be met in other countries. Paper and cardboard can be collected for recycling.
More than 3.5 million tonnes of plastic were consumed in Australia in 2016-17. Less than 10% (293,000 tonnes) were recycled in 2016-17.
Plastics are man-made products that come from valuable non-renewable resources like oil, gas and coal. Plastic has been the most common item collected on Clean Up Australia Day for 20 years.
Hard plastics can generally be recycled through kerbside recycling programs, where they are then melted, stretched, cut and moulded into a recycled product.
Some supermarkets now offer a drop-off point for recycling soft plastics including shopping bags, cling and bubble wrap, pasta and rice bags, and biscuit packets.
Reducing consumption of plastics goods is the only way of controlling this waste.
Packaging makes up a significant part of the rubbish in landfill.
Buying in bulk can save you money, packaging and transport costs. If not, always try to choose products that use less packaging.
Remember to take reusable bags out with you to avoid the need for plastic bags.
Aluminium is a common metal and is used widely in cans (including aerosol) and for food-related products like foil and pie trays.
Producing aluminium uses so much energy that the metal is sometimes called 'frozen electricity'. However, aluminium can be easily recycled, and many times over. Even aluminium with food scraps stuck to it can be recycled.
When recycling steel cans, it's best to put the lid inside the can and then squash the top of the can before placing it in your recycling bin.
Electronic waste or e-waste includes products such as computers, televisions, home entertainment systems, printers, faxes and mobile phones.
Only about 10% of e-waste is recycled compared to 52% of general waste. E-waste contains many parts that can and should be recycled so that the resources can be used again. E-waste also contains a range of hazardous elements such as lead and mercury which can be released into the environment if not disposed of properly.
E-waste can’t be recycled in your kerbside bin, but it can be recycled or safely disposed of through other services. Check Planet Ark's Recycling Near You or TechCollect.
The Australian Government has also introduced an industry-funded National Television and Computer Recycling Scheme, which also accepts used computer accessories such as keyboards, mice and hard-drives.
E-waste you may be able to recycle includes: mobile phones and components, and telephone systems stereo components, DVD and video players TVs computers and accessories printers, faxes and scanners batteries cartridges
The bathroom, toilet and laundry can be high use areas for chemicals. Try to limit the chemicals and waste that you put down the sink and toilet.
It’s possible to clean effectively without chemicals, for example using bicarbonate of soda or white vinegar applied with water and a soft cloth.
You could also; reuse existing containers and buy refills, buy toothbrushes and shavers with replaceable heads, refill your liquid soap containers, buy toilet paper made from recycled paper or plantation timber, recycle paper and cardboard products.
In Australia, we waste more than 30% of the food we purchase. Australian consumers throw away around 3.1 million tonnes of food each year. Of this, 2.54 million tonnes of food waste was from our homes. When rotting food ends up in landfill it turns into methane, a greenhouse gas that is particularly damaging to the environment. Food waste costs Australian households between $2200 to $3800 a year.
Much of the food waste in our kitchens comes from inadequate planning or simply buying too much food. To work out how much you and your family really eat, check portion guides. For detailed information on how to choose and store different foods visit the Food Safety Information Council website.
Vegetable and fruit scraps can be composted.
Hot beverage pods, capsules and discs are not recyclable through kerbside recycling. Putting these items in the recycling bin can make the sorting process more difficult and may contaminate the recycling stream.
However, there are other ways to recycle these items. You can recycle any pre-packaged disc or capsule used in capsule-specific machines to make hot beverages, recycling boxes can be purchased from TerraCycle.
Or choose not to use these products, make your own or carry your own travel mug to buy a hot drink from a local cafe.
About 35% (7 million tonnes) of building waste goes to landfill each year in Australia, so minimising and recycling building waste can have a big impact.
Work with your designer and builder to plan how to minimise waste during the project and recycle leftover building materials.
Use recycled materials and materials with high recycled content where it's fit for purpose—this helps to lower waste volumes and increase the viability of recycling which in turn will develop the market for recycled resources.
In 2016-17 Australia produced about 6.3 million tonnes of hazardous waste, and this is increasing at a rate of approximately 9% a year.
Hazardous waste includes products such as motor oil, brake fluid, kerosene, paints, mineral turpentine, pesticides, herbicides, rat poison, batteries, compact fluorescent lamps (CFLs), oven cleaners, pool chemicals, and asbestos.
Some of the chemical products can ignite at relatively low temperatures, or react with air, water or other substances, and explode or produce toxic vapours.
These products cannot be disposed of in your regular garbage collection, and for many hazardous wastes, it can be illegal to do so as they can leak into the environment and waterways and cause serious health risks.
It's important to manage hazardous waste and dispose of leftover chemicals correctly at a hazardous waste centre. Check with your local council for disposal or collection services available in your area.
Source: www.energy.gov.au
Both consumption and waste have major environmental impacts. Producing goods and transporting them to consumers uses large quantities of fossil fuels and produces pollution, particularly carbon dioxide (the major greenhouse gas leading to climate change). When these products become waste, they are transported again—usually to landfills, where they produce methane (another potent greenhouse gas) as they break down—or to incinerators, which generate more pollution as they burn.
Energy, water and material resources are fundamental to human well-being and economic prosperity. The way in which resources are used and the amount used has created pressures on the environment. Current patterns of production and consumption have resulted from a narrow historical focus of exploiting seemingly abundant resources for human need and greed, and to maximise economic value and utility.
This includes energy generation and consumption. The supply of and demand for stationary and transport energy, and the key implications of the extraction, processing, distribution and use of energy for the environment, such as greenhouse gas emissions, land disturbance, water extraction and emission of air pollutants. Key issues also include the range of fuels used, the efficiency of conversion and processing of fossil fuels into a useable form; the efficiency of distribution; as well as the level of demand for energy, including the influence of population growth and diversity, economic activity, and consumer choices.
This includes the trends in water storages, consumption across different industry sectors and the community. As well as key pressures on the natural environment resulting from the water extraction, storage, supply and consumption system. Governance, demand management, and the structure of the water industry.
This includes the use and flow of natural resources in the production of goods and services, which can ultimately become waste released to the environment.
Key findings on consumption;
-
There is a global consensus that current patterns of resource use are unsustainable.
-
The way many resources are used, and the amount that is used, is placing stress on natural systems.
-
Energy generation and resource consumption have the single biggest impact on our ecological footprint.
-
To date resource efficiency gains have generally fed into higher economic productivity, not environmental benefits. Increasing the efficiency of resource use is essential but insufficient unless it can demonstrate a reduction in absolute environmental impacts/pressures.
-
To address sustainable consumption and production requires significant technological research and development with an increased emphasis on appropriate governance frameworks, industry partnerships and behavioural change - reduce, re-use, recycle.
The consumption choices we make as individuals, and as a wider community, can result in a significant impact on the natural environment.
In 2005 a study found that Australian household wasteful consumption, that is, annual spending on unused goods and services, amounts to over $10.5 billion per year, of which food accounts for $5.3 billion, that is gut-wrenching, considering that approximately 689 million people in the world are living on less than $1.90 a day and have no food security (www.worldbank.org, 2017).
Household energy consumption patterns, production of waste, as well as our choices about modes of transport are all part of a chain of decision making which has implications on the natural environment and the quality of all our lives.

Although Australia is a land often devastated by drought, if you live in the city, it's very unlikely that you'll turn on the tap and find no water comes out. And given about 70 per cent of Australians live in major cities, it's easy to forget just how good most of us have it. Whether it's for cooking, drinking or bathing, we don't have to collect water from a well, or pump it ourselves, or worry about it being dirty or unsafe. The sources of our water supplies are out of sight, out of mind.
For most of us, the water we use inside our homes arrives treated and clean, after it has been pumped and piped through the mains from rivers and reservoirs, as well as from aquifers and seawater desalination plants.
However, there are Australians who are not so lucky. You may know that not all Australians have access to safe drinking water. For example, remote Indigenous and non-indigenous communities, or for the people trucking drinking water to small drought-stricken towns, like Murrurundi.
What is the true picture of the state of our water? Refer to the 2017 article BOM Water in Australia.
Water scarcity has always been a contentious issue in Australia, a country which is known as the driest inhabited continent in the world. The recent 2018-19 summer was the hottest on record, causing waterholes to dry up which adversely affected cattle and wildlife as well as crop production.
The image below shows Annual rainfall during 2018–19 compared with historical records (1911–2019) - Australian Bureau of Meteorology 2020
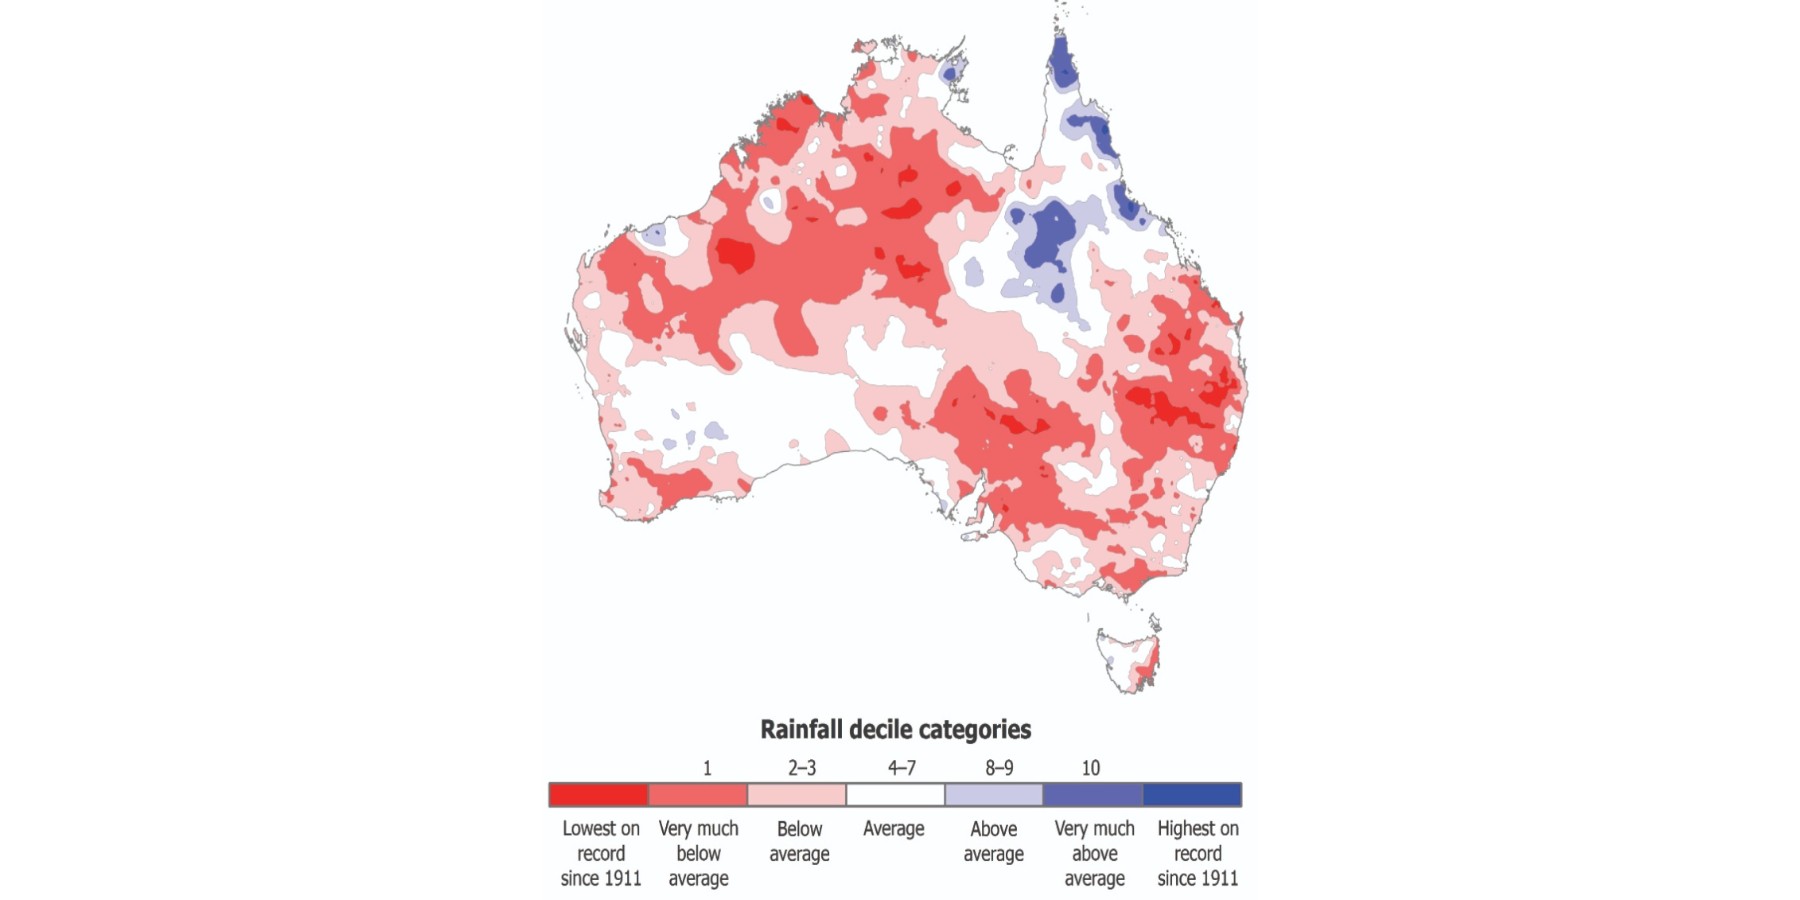
Lower rainfall has led to a reducing share of water in storage dams across the country, with water catchments struggling to maintain a sustainable water supply in most regions. This has been exacerbated by the increasing demand for water by both household and industry consumers.
The majority of Australia’s water is sourced from surface water and groundwater. Surface water stored in dams or reservoirs is the main source for the municipal water supply, which means Australia’s water supply is vulnerable to the effects of climatic change occurring across the country. In particular, lower rainfall can impact water availability in the country. Groundwater extraction in Australia has been on the rise, supplying water to many different states, such as Western Australia, where surface water is limited.
Water is a crucial resource for Australia’s agriculture industry in particular. Crops including cereals, cotton, and sugar cane all require large volumes of water for irrigation. The Murray-Darling Basin, one of the largest and most significant agricultural areas in Australia, depends on access to millions of litres of water each year for agricultural purposes.
Household consumers have also seen the impact of water scarcity, with Brisbane having one of the most expensive prices for water in the world. Expenditure on public water services by households in Australia has increased per kiloliter over the years. On top of this, water restrictions have been imposed in many regions in order to combat drought and water shortages. Unsurprisingly, around three-quarters of Australians believe the climate is changing.
Following global trends, alternative sources of water are becoming more prevalent in Australia. Treatment applications such as seawater desalination and reclaimed water are increasing in popularity (though they are not without consequences), while integrated storm-water management solutions are also being sought to preserve valuable potable water. It is clear that the future of water sustainability in Australia will depend on effective governance, driven by environmentally-oriented development, ethical industry, and political objectives. (L. Granwal, 2020, www.statista.com)
Refer to The World Bank site on the topic of Water.
We have to think about how we use our water resources. As our cities grow and the climate changes, it's no longer reasonable to wash our hands of the water question. For our hotter and drier cities of the future, building more dams won't be the answer. Seawater desalination plants aren't without their problems as desal is energy-intensive and its salty brine is damaging to the local marine environment. Although some cities like Perth are making headway with wastewater recycling, the cheapest and easiest option for all of us is to change our water behaviour, and to better live within our means.

Relying on technology alone is not the answer. The development of urban water supplies and sanitation over the past century or so has brought incredible benefits to our lives, while technology and infrastructure allow us to consume that water in the blink of an eye. According to the Australian Bureau of Statistics, households in the Northern Territory (349kL) and Western Australia (241kL) use the most water each year, while Victoria (166kL) and Tasmania (147kL) use the least.
Climate, soils and pricing all play a role here, but these statistics suggest that some cities have much thirstier habits than others.
Thinking more carefully about where our water comes from — and at what cost — is vital to making sense of living in Australian cities now and in the future
How To Save Water At Home.
Sources: www.abc.net.au/news/2019-11-11/ , www.bom.gov.au/water/waterinaustralia/ , www.statista.com

A biophysical environment is both biotic (biological) and abiotic (physical rather than biological) surrounding of an organism or population, and consequently includes the factors that have an influence in their survival, development, and evolution. A biophysical environment can vary in scale from microscopic to global in extent. All ecosystems are a direct result of the biophysical elements of a given locality and they all interact with each other at any given place. The biophysical environment includes living things such as plants and animals, and non-living things such as rocks, soils and water.
The biophysical environment is made up of four parts: the atmosphere, hydrosphere, lithosphere and biosphere;
-
The atmosphere includes gases that are around the earth and everything that happens in them, such as heat from the sun, weather, smog and haze, climate and acid rain.
-
The hydrosphere is the portion of the earth that is composed of water in all forms – running water, ice and water vapour.
-
The lithosphere refers to the rocks and soils on the crust of the earth and how our continents form and wear away.
-
The biosphere is the zone of the earth and adjoining parts of the atmosphere in which plants and animals exist.
Interactions occur between the four spheres.
The social environment is the environment developed by humans as contrasted with the natural environment. It is society as a whole, especially in its relation to the individual.
It consists of three kinds of environments:
-
Cultural - Behaviors, norms, and values that people use to understand and explain their physical and social environment.
-
Economic - Concerned with the production, distribution, and consumption of goods and services. All the comforts and conveniences which man has made.
-
Psycho-social - Relating to the interrelation of social factors and individual thought and behaviour.
Socio-cultural factors are the larger scale forces within cultures and societies that affect the thoughts, feelings and behaviours of the population. Such factors include; attitudes, child-rearing practices, cross-cultural differences, ethnic identity and values, kinship structure, power and wealth, regional differences, religious beliefs and practices, rituals and taboos.
Man has been so noisy about the way he has conquered nature and nature has been so silent in her persistent influence over man, that the geographic factor in the equation of human development has been overlooked.E. C. Sample
What is the relationship between the biophysical environment and the human socio-cultural environment?
The biophysical domain provides material components for environmental spaces (i.e. geographical contexts of interaction between people and nature), and provides opportunities for cultural practices (i.e. activities that relate people to each other and the natural world). In turn, environmental spaces and cultural practices shape the biophysical domain and enable cultural benefits (i.e. dimensions of well being associated with cultural spaces e.g. identities, experiences, capabilities, goods, and services). These cultural benefits then shape environmental spaces and cultural practices. - Authors; Robert Fish, Andrew Church, Michael Winter on the co-production and reciprocity of culture-nature relationships. 2016 www.sciencedirect.com
We understand that the physical environment plays a predominant role in determining the behaviour of the individuals and groups. So great is the influence of the physical environment on human life that special studies have been made about this relationship since the 1700s (Montesquieu).
Sociologists have been engaged in studying the relationship between the physical environment and social phenomena. This emphasis on the relationship between the characteristics of the physical habitat and social developments had led to the development of specific schools of Sociology (e.g. the Ecological school and the Regional school, USA, Geographical school, and theories on how Climate influences us.)
The ecological school has been particularly interested in the social and cultural phenomena associated with various urban areas. Focusing upon the social effects of locality, the processes that mark the rural and urban communities.
The regionalists have sought to establish a relationship between man’s physical environment and his social life. According to them, man’s surroundings closely influence his activities.
In Germany, an important branch of the geographical school was developed by F. Ratzel in his extensive work Human Geography. In England, H.T. Buckle wrote a history of civilisation along similar lines, along with writers like Simple, Dexter, and Huntington have sought to depict the impact of climatic conditions on human society.
Some examples of general conclusions, from studies (historic and modern) of relations between social developments and physical environment, are as follows;
An example of the impact of the environment on society in terms of population:
The physical conditions of a country profoundly influence the distribution, size and density of its population.
For instance, the plains are the most densely populated and the mountains sparsely populated. The influence of plains on population can be seen from the fact that a greater number of people live in the plains than elsewhere. In the plains, there is a greater number of towns and densely populated cities.
The population in the hilly areas is thinner. The distribution of population in the hills is also uneven. The people live scattered due to the unevenness of the terrain.
Likewise, the density of population is small in desert areas and in those places which suffer from lack of rainfall. Temperature, rainfall and humidity are the factors which determine the density of population.
An example of the impact of the human population on the environment:
The ways in which populations are spread across Earth has an effect on the environment. Developing countries tend to have higher birth rates due to poverty and lower access to family planning and education, while developed countries have lower birth rates. In 2015, 80 per cent of the world’s population live in less-developed nations. These faster-growing populations can add pressure to local environments.
Globally, in almost every country, humans are also becoming more urbanised. The pressure placed on growing cities and their resources such as water, energy and food due to continuing growth includes pollution from additional cars, heaters and other modern luxuries, which can cause a range of localised environmental problems.
Some examples of the impact of the environment on physical necessities:
The topography of a country affects the human habitation, diet, dress and animal husbandry. For example;
Historically, the northern (American and Scandinavian) tribes lived in snow houses, use animal skins for garments and utilise the fish and seal for food.
Houses in the mountains are made of wood and stone while those in the plains are built of brick and cement.
The dietary habits also are affected by topography. Thus rice is the diet of Bengalese while wheat is the diet of Punjabese in South Asia.
People living in the mountainous regions wear thick and woollen clothes while those living in the plains wear cotton clothes.
Particular animals can be reared only in particular geographical environments. Camels are found in desert areas, goats and sheep in the hills, cows and buffaloes in the plains.
Some impacts of physical needs on the environment:
For many, particularly in industrialised countries, the consumption of goods and resources is just a part of our lives and culture, promoted not only by advertisers but also by governments wanting to continually grow their economy.
Culturally, it is considered a normal part of life to shop, buy and consume, to continually strive to own a bigger home or a faster car, all frequently promoted as signs of success. The mass production of goods, many of them unnecessary for a comfortable life, is using large amounts of energy, creating excess pollution, and generating huge amounts of waste.
It may be fine to participate in consumer culture and to value material possessions, but in excess, it is harming both the planet and our emotional wellbeing.
Examples of the impact of the environment on occupations
Human occupations also are largely influenced by geographical factors. For example:
-
In coastal areas fishing is the main occupation.
-
Oil wells are to be found in other regions.
-
The main occupation of fertile plains is agriculture.
-
The mountainous people rear grazing animals.
Examples of impactful occupations and related practices:
-
Oil production, distribution, and consumption.
-
Energy production, distribution, and consumption.
-
Transport.
-
Timber industries.
-
Housing development.
-
Infrastructure.
-
Consumer products.
-
Food production.
-
Sport and recreation.
-
Tourism.
-
Health.
Daily habits and involvement in occupations can bring impacts to the environment, both in a micro and macro context.
Educational practices related to environmental issues have an important role in building sustainable habits. Sustainable practices at an individual and national level, change daily habits and increase the involvement in occupations that are sustainable.
Examples of the impact of the environment on physiology:
Historically it was thought that the topography affects the colour of the skin, stature, shape and colour of the hair, shape of the nose, head etc. For example, people of regions with predominantly hot climates have got darker skin than those living in colder climates.
Diets differ in areas and this provides some evidence for stature and shape differences of people. However, with globalisation, people of different bodily characteristics may be found in the same environment and people of same characteristics may be found in different environments. Thus climate and diet is not the only factor determining physiology.
People living in areas that have poor access to regular transport will be required to walk long distances and physically will be in contrast to people living in areas that are hardly ever required to walk distances.
Impact of physiology on the environment:
It is evident that human dietary changes and overconsumption of goods and services relating to beauty, body image, health etc. has a direct and indirect impact on the environment in terms of waste, pollution, resource depletion.
Impact of environment on individual energy and skill:
An individual’s energy and health are not determined by climate alone as they are the results of many factors of diet, hygienic conditions, living standards, attitudes and values.
But there is a theory about the condition of our environment, such air quality, temperature, weather, terrain etc., does affect energy levels and skill levels (learning and skill in overcoming our challenges).
Some are of the opinion that geographical environment has a great deal to do with human activity. Extremes of heat or cold have a deterrent effect on human activity. It seems clear that a certain moderate temperature is best calculated to evoke human activity.
According to a sociologist (Huttington), “When the temperature falls greatly, mental work seems to suffer more than physical, and declines as much as when there is no change.”
Impact of energy and skill on the environment:
We have access to vast amounts of knowledge that sustains our economic progress, sometimes at the cost of our natural resources, but it is with skills that we are able to innovate and ultimately find solutions to the environmental challenges we face.
We may be exhausted and apathetic to the condition of the environment, the effect our behaviours have on our planet. Our interest in change seems to wane, depending on how we feel on any given day and with our lack of comprehension or education on the importance of sustainability.
Examples of the impact of the environment on civilisation and culture:
Civilisations are influenced by the geographical environment.
The Euphrates, the Ganges, the Nile, the Yangtzekiang nurtured the earlier civilizations. The civilization of Europe would have been very different had there been no Danube or Rhine.
“Barrier and threshold” these are the roles which the sea coasts have always played in history. The seas are both a barrier and an opportunity for the people.
The power of Spain, Holland and England have arisen not only by historical circumstances but also by improvements in the techniques of navigation. Historically, the Britishers were able to extend their empire in such an extent that the sun would never set on it because she was the mistress of the seas.
Culture also is influenced by the geographical environment. The art, literature and modes of living of a country bear the impression of its natural environment. The natural conditions affect the outlook on life, traditions, folk’s lore, marriage, institutions, a form of government etc. People’s ideas and motives are influenced by the way in which they earn their livelihood.
A nation’s military power is greatly restricted if resources such as iron and oil deposits are absent.
Examples of the impact of civilisation on the environment:
The growth of civilization has changed and minimised the influence of geographical conditions.
In the history of civilization, the countries which once were at the summit are now at the bottom and those which were backward are today the most advanced.
The distribution of agricultural resources is less determinative as civilization progresses with the distribution of the population. For example, historically the most populous parts of a region would be centred around the greatest fertility of the soil but now populations are greatest where there are industrial opportunities. Similarly, natural routes of migration and trade matter less, than of old, as men have learnt to build railways through mountains and over swamps and to use the unbounded highway of the air.
Examples of the impact of the environment on economies:
The economic organisation of a country is to a large extent determined by geographic conditions. The products of a place are governed by the raw material available. Sufficient natural resources are necessary for the economic prosperity of a country.
As there is a greater density of population in cities, we find major industries there. The economic life of the people living there is to an extent more prosperous if not more active.
Agriculture and animal husbandry is the main occupation of rural areas.
On the plains, there is a wide network of roads and railway lines. Transport is easier here than in hilly communities.
Examples of the impact of economic development on the environment:
In regions where people are generally poor. There are fewer means of transport and communication which make industrial growth difficult. In these areas, income comes predominantly from the extensive use and misuse of local natural resources.
Examples of the impact of the environment on politics:
Poorer communities may not have a well organised political life. The scattered nature of some populations and fewer means, make it difficult to give an organised shape to the administration. Poverty and lack of education do not allow democratic notions to develop.
The establishment of a permanent government is a problem in some regions. These governments experience much difficulty in maintaining peace and order. Due to poverty governments cannot tax their people very much and not in a position to provide them with good education, sustainability programs, and other social welfare activities.
Impact of politics on the environment:
Politics can dictate land usage, pollution, regulations, trade, bans, and allowances for individuals and corporations.
Endangered species can be protected in national parks and reserves if desired, or purposefully hunted down, if desired.
Politics determine the laws citizens passively act by, and politics can create active action too. Thus varying impacts on the environment.
According to Huttington, “The geographical distribution of minerals is one of the greatest causes of international troubles and wars.”
Examples of the impact of the environment on social life:
The standard of living is higher in resource-rich regions. The progress of culture is ensured through the progress of civilization. Art, literature and music progress. Education also develops easily. The social organisation is strengthened. The sense of group cooperation is awakened.
In regions where the environment dictates the lack of availability of essential services, the following may be observed:
Absence of education keeps them conservative.
People in labour-intensive occupations, such as agriculture, busy in earning a livelihood may not get ample leisure to develop art and literature. They have got a tough life.
The people do not benefit by modern scientific inventions because of the lack of developed means of transport and communication.
There may be fewer doctors, teachers and engineers due to lack of education or employment opportunities.
There is much religious superstition and dogmatism.
Examples of the impact of social life on the environment:
The practices that we value as a society, such as, social get-togethers, time outdoors, recreational activities, festivals, hobbies, fitness etc., have an impact on the environment.
It can be direct impacts such as visiting a national park, boating on a river, fishing etc., or indirectly such as purchasing a product or utilising a service.
1. The theory that climatic conditions matter less in determining the trajectory of civilisation, providing humans are able to modify their environments to sustain growth.
-
Climatic conditions matter less in so far as men gain control over the natural disadvantages of certain climates. For instance, even the extremes of heat and of cold grow less deterrent as the arts of warming and cooling dwelling places improve.
-
Man cannot be regarded as nature’s slave. The innumerable scientific inventions have made man 'the lord of Nature'. Humans modify their physical environment rather than the environment modifying them. We can live anywhere if we so will.
-
Geography by and in itself never absolutely determines the course of human events. As scientific technology advances, man’s ability to modify his environment increases.
-
Man is not a passive factor, but an active agent. Nature but offers the materials, man’s need, his genius and ability compel him to utilise them for his own purpose.
Thus, our physical environment cannot determine the progress of our civilisation. It can, of course, define and decide some of its limits.
As Isaiah Bourmann (geographer) said, “Earth facts do not determine the form and nature of human society in development. They condition it. New earth facts are continually being discovered and old earth facts given new significance as human knowledge, thought and social action develops. The relations are reciprocal. It may be, therefore, said that the physical environment without playing a determinant role provides an external set of conditions under which the life of man in society proceeds. These conditions can hardly be ignored in the study of social behaviour. The sociologists should show their relation to the direct determinants of social phenomenon, the attitudes and interests of men. The physical environment is more of limiting than of a determining nature.”
2. The theory that civilisation is doomed because of human activity creating conditions that make life on earth unsustainable.
-
Human society is in jeopardy from the accelerating decline of the Earth’s natural life-support systems.
-
The knock-on impacts on humankind, including freshwater shortages and climate instability, are already “ominous” and will worsen without drastic remedial action.
-
Population growth is noted as a factor, along with inequality.
-
Agriculture and fishing are the primary causes of the deterioration of biodiversity.
To learn more about modern theories, read this interesting in-depth article on culture and sustainability in the current 'Anthropocene' age.
Anthropocene - is the current unofficial geological age, viewed as the period during which human activity has been the dominant influence on climate and the environment (The current official age is called the Holocene.)
"The health of the ecosystems on which we and other species depend is deteriorating more rapidly than ever. We are eroding the very foundations of economies, livelihoods, food security, health and quality of life worldwide," said Robert Watson, the chair of the Intergovernmental Science-Policy Platform on Biodiversity and Ecosystem Services (Ibpes). "We have lost time. We must act now".
Sources: www.science.org.au , www.sociologydiscussion.com (Shelly Shah)
What is an environmental and social impact assessment (ESIA)?
The purpose of an ESIA is to identify the positive and negative impacts caused by project implementation.
It is a process for predicting and assessing the potential environmental and social impacts of a proposed project, evaluating alternatives and designing appropriate mitigation, management and monitoring measures.
It aims to predict impacts at an early stage in project planning and design, find ways to reduce adverse impacts, shape projects to suit the local environment, and present the predictions and options to decision makers.
ESIAs vary in scope and type of analysis, depending on the characteristics of the proposed project. In doing so, each element of a project should be analysed for its potential to affect the environment and/or society during each phase of the project (including construction, operation and decommissioning).
ESIAs address a project’s environmental and social costs and benefits, including an appraisal of the economic implications of the proposed project. The ESIA should consider the project as designed, in addition to potential alternative options (including that of no action).
In addition to the direct effects outlined above, the possible interactions between different environmental components (indirect effects) should also be considered, together with the impacts that could occur in conjunction with other activities taking place in the near vicinity at the same time (cumulative effects).
Stages in the ESIA Process are;
-
Defining the Project.
-
Scoping.
-
Stakeholder Consultation at every applicable phase.
-
Baseline Data Collection.
-
Assessment and Disclosure.
-
To provide information necessary to facilitate a full understanding of the environmental and social impacts of the proposed project and the associated mitigation measures that will be implemented.
-
To encourage discussion and invite comments on the proposed mitigation measures. Comments received must be reviewed and where necessary incorporated into the ESIA report.
What are the common data collection techniques when conducting an ESIA?
A successful process of ESIA requires the assessor to employ various mathematical and digital methods to monitor and assess all areas of concern involved in the project in hand.
There is some specific characteristic which an ESIA methodology should depict;
-
It should be appropriate to the necessary task of ESIA process such as impact identification/comparison of alternatives.
-
It should be significantly free from assessors bias.
-
It should be economical in terms of costs, and its requirement of data, investigating time, personnel, equipment, and facilities.
-
The ultimate objective of a method should be to carry out; Impact identification, Impact prediction, and Impact evaluation.
The most common methods used during ESIA can be remembered as ACMNO;
A simple method based on a subjective environment impacts on broad aspects.
The Ad hoc method is useful when time constraints and lack of information requires that the ESIA must rely exclusively on expert opinion.
It provides minimal guidance for total impact assessment while suggesting the broad areas of possible impacts and the general nature of these possible impacts.
When more scientific methods are available, this method is not recommended.
Types of Ad-hoc methods:
-
Opinion polls
-
Experts opinion
-
Delphi methods
Advantages:
-
Specialists in a particular area will provide guidance.
Disadvantages:
-
It requires an expert.
-
Short/long term impact is merely examined on guess basis.
-
Identification, prediction, and interpretation of impacts are quite poor.
There are many methods by which we can assess the impact of a developmental project on our site and its various components. The simplest of these methods are checklists.
Checklists were too primitive to be used for large-scale projects. A step higher from the checklists is the matrices form of impact assessment in ESIA. It is a listing of potential Environmental Impacts. This method is done to assess the nature of the impacts i.e. its type such as adverse /beneficial, short term or long term, no effect or significant impact, reversible or irreversible, etc.
Types of Checklist methods:
-
Simple Lists.
-
Descriptive Checklists.
-
Scaling Checklists.
-
Questionnaire Checklists.
Advantages
-
Simple to understand and use.
-
Good for site selection and priority setting.
Disadvantages
-
Does not distinguish between direct and indirect impacts.
-
Does not link action and impact.
-
Sometimes it is a cumbersome task.
A matrix is considered to be a more systematic approach to assessing and monitoring all the aspects of the project in hand as compared to the checklist method.
In a matrix, the activities linked to the project are listed on one axis: for example, building construction, water supply, energy supply, gaseous emissions, liquid effluents, cooling water discharges, noise, solid wastes treatment and disposal, transportation etc.
Leopold Matrix
The Leopold matrix is the best-known matrix methodology available for predicting the impact of a project on the environment.
It is a two-dimensional matrix cross-referencing, which means that:
-
The activities linked to the project that is supposed to have an impact on man and the environment.
-
The existing environmental and social conditions that could possibly be affected by the project.
The Leopold matrix is a very effective tool for monitoring the “Direct” impacts of various aspects or risk elements of the project on the Environment.
However, it fails to analyse indirect aspects that are considered significant for a complete assessment of the project.
Interaction Matrix
The inability to detect indirect impacts systematically and understand them easily was a big drawback of the Leopold matrix. To overcome this, Environment Canada proposed a different form of a matrix in 1974. This was called the component interaction matrix.
Here, instead of taking activities on the horizontal axis and environmental components on the vertical axis, both axes listed environmental components. So, if two components were seen to be linked by secondary or tertiary interactions, they would be marked by 1, 2, etc. And if they are not impacted by multiple levels of interactions, they would be marked zero.
Why the matrix method is better than the checklist method?
There are a set of valuable reasons as to why the matrix method is considered to be better.
Checklists tend to be long and also requires a lot of work in describing an impact or writing it out in words. In matrices, this ambiguity and extra work are removed by introducing a quantitative aspect in the assessment of an impact.
Checklist tends to get confusing when you assess multiple levels of impacts descriptively. This is resolved in matrices, to an extent, with the help of customized matrices.
Matrices are also versatile, as they can be used for small and large-scale projects alike.
Matrices can be applied in medium to large scale projects where the number of developmental activities is many (up to 100). This will obviously result in effects on many environmental aspects. All of these cannot be covered easily in checklists.
Matrices are flexible, which is why they have been accepted and used the world over.
It is perfectly acceptable to customise the matrix according to the project at hand.
Advantages
-
Links action to impact.
-
A good method for displaying ESIA results.
Disadvantages
-
Difficult to distinguish direct and indirect impacts.
-
Significant potential for double-counting of impacts.
-
Qualitative - Qualitative research methods explain how and why something happens and do not answer what and how much happens.
It uses the matrix approach by extending its take to account primary as well secondary impacts.
Data is shown in the form of a tree called Relevance/Impact tree/Sequence diagram. Helps in the identification of direct and indirect, short and long term environmental impact, a crucial and intact basic step of making Impact tree. The method is widely used to identify cause-effect linkages.
Advantages
-
Links action to impact.
-
Useful in simplified form in checking for second-order impacts.
-
Handles direct and indirect impacts.
Disadvantages
-
Can become overly complex if used beyond simplified version.
-
Qualitative.
This relies on a set of maps of a project area’s environmental characteristics covering physical, social, ecological, aesthetic aspects.
Separate mapping of critical environmental features at the same scale as the project’s site plan.
The Older Technique: environmental features were mapped on transparent plastic in different colours.
Newer Technique: Geographic Information Systems (GIS) are used.
Advantages
-
Easy to understand and use.
-
Good display method.
-
Good for site selection setting.
Disadvantages
-
Addresses only direct impacts.
-
Does not address impact duration or probability.
How well you incorporate the multidisciplinary scientific methods to generate a sound ESIA statement depends on your patience, skills, experience, and the care you have for the locality (area, society, indigenous animal and plants, ecosystems, etc), and how genuinely you care about the project under consideration.
The job of an ESIA team is to narrow down the scope of the ESIA which should start as extensively as possible by looking at all potential risks and then screen them to eliminate what can or should be eliminated. Leaving a list of possible or probable impacts that should be measured, monitored, assessed.
So, what is observed and measured during an ESIA? Some examples include:
-
Air quality, Emissions, and Radiation.
-
Water.
-
Pesticides and Toxic substances.
-
Ecosystems and introduced contaminants.
-
Health.
-
Noise.
-
Biosecurity.
-
Product lifecycle - from manufacture to disposal.
-
Solid waste, liquid waste, and hazardous waste.
-
Soil.
-
Landscape impact.
-
Visual impact.
How is data recorded?
Most organisations have their own data management systems. These can be operational, program, beneficiary, stakeholder, and financial data management systems. Reporting for different businesses to meet their own unique reporting requires the aggregation of results from different data stores.
Some examples of data collection methods/systems include;
-
Paper-based.
-
Excel or Google spreadsheets for program or operational data.
-
Mobile Offline data collection for survey data.
-
Custom Case management and program management system.
-
Customised databases.
-
Online survey tools such as Survey Monkey.
While most organisations will continue to track data using their favourite approach, reporting consistent results and tracking past results is challenging. With growth, the entire data system can look more like data islands.
The best approach is to provide a simplified data warehouse that allows an organisation to intelligently map data from any data sources and store them in a cloud-based database. Once intelligent mapping is defined, field managers and operational staff can simply drag and drop results to the cloud every time new data and/or results are acquired.
There are a number of software platforms that exist to help you measure and maximise your companies social value. For information refer to the www.socialvalueint.org directory on social value tools and software.
Source: Copyright © 2020 World Business Council for Sustainable Development and www.envibrary.com, (A. Samajdar)
Additional information:
-
Environmental impact assessing requires a multidisciplinary approach and requires some skill and planning. For excellent information on Methods, Monitoring, Measurement, and Assessment refer to the US EPA page on Environmental measurements and modelling.
-
For more information or to understand if your project needs approval refer to Environment Assessment And Approvals.
-
For more information on methods, refer to www.knightpiesold.com information on ESIA Process Approach and Methodology.
The following Sopact video explains some data collection and assessment considerations when conducting an impact assessment.