Now that you understand the fundamentals of spreadsheet planning, formulas and functions, it's time to create your spreadsheets for yourself. In this topic, you will gain practical skills for creating and using spreadsheets in a business environment.
By the end of this topic, you will understand:
- how to create various types of spreadsheets commonly used in business environments
- how to perform basic formulas and functions within spreadsheets
- how to style a spreadsheet according to organisational requirements
- how to embed charts within spreadsheets to visually represent data
In this topic, you will produce four (4) spreadsheets relating to various business functions.
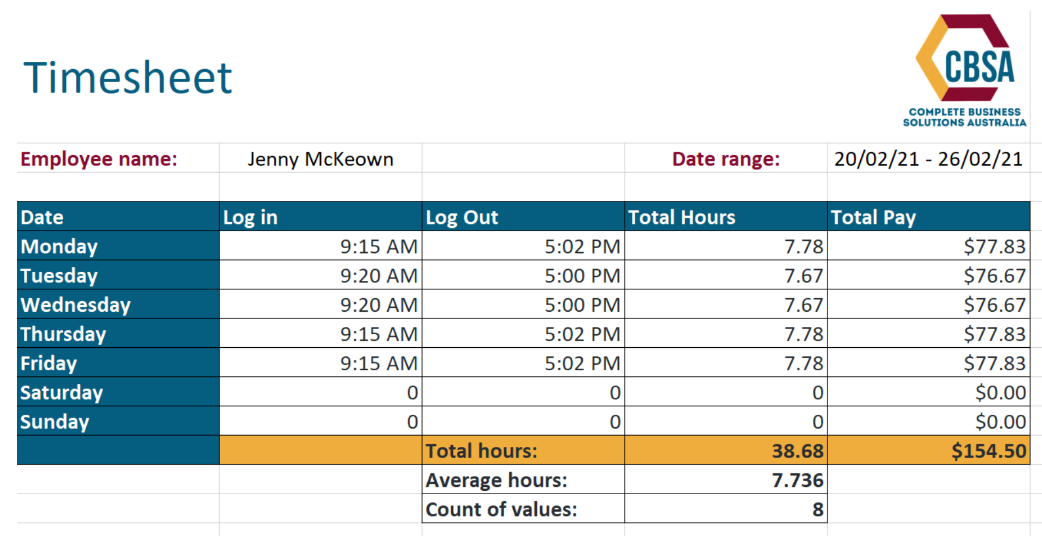
Timesheet
A timesheet lets you track the hours you have worked each day or over a certain period. A simple timesheet is manageable using a spreadsheet; however, more complex systems that record further information, such as leave accruals, requests and balances, are usually housed within a database.
Spreadsheet 1: Design and Produce a Timesheet
Imagine that you are an employee at CBSA. Your manager has asked you to create a simple timesheet management system that will allow those in your work area to track their time.
CBSA is currently tendering for a human resources management system to be developed, which will allow for the capturing of complex employee data, including timesheet management. Therefore, your system is an interim solution and will only require data to be captured as follows:
- Employee name
- Date range (From Monday to Sunday of each week)
- Days of the week
- Work commencement time
- Work finish time
- Total hours worked
- Total pay.
Before commencing this activity, watch the following video for a step-by-step demonstration of creating a basic timesheet using Microsoft Excel. (4.39)
To complete this activity:
- Open your 'BSBTEC302 – Design and produce spreadsheets – Learning activities' spreadsheet created in Activity 1C.
- Open a new worksheet by clicking on the + next to the worksheets created in the previous activities.
- Rename the tab as 'Timesheet.'
- Follow the written instructions at the following link: Excel Timesheet Calculator - How to calculate hours in Excel. 3
- Enter dummy data for hours worked and hourly rate.
- Ensure the employee name and date range have been recorded on the timesheet.
- Add a row at the bottom of the timesheet to capture 'Average hours worked' and use the appropriate function to capture this (if required, refer to learnings in Topic 3 relating to AutoSum)
- Add another row at the bottom of the timesheet to capture the count of values and use the appropriate function to capture this.
- Edit the columns and cells to fit the content nicely
- Download the CBSA Style Guide.
- Edit your spreadsheet using at least three basic design features to increase readability and make it attractive (the design elements are at your discretion but may include using a heading, colours, logo, whitespace, etc.). Be sure to stick to the CBSA's style guide (Note: If you don't have access to the 'Arimo' font, use 'Calibri' instead).
- Save your work
- Exit application.
Use the 'Help' function for assistance if you get stuck at any time.
Timesheets may look similar to the example in the video but may contain different data and formatting. When creating your Excel timesheet, check that all the fields listed above have been entered and that functions to calculate sum totals, averages, and count of values have been used correctly. Formatting should follow CBSA's Style Guide.
Your timesheet may look like the following image:
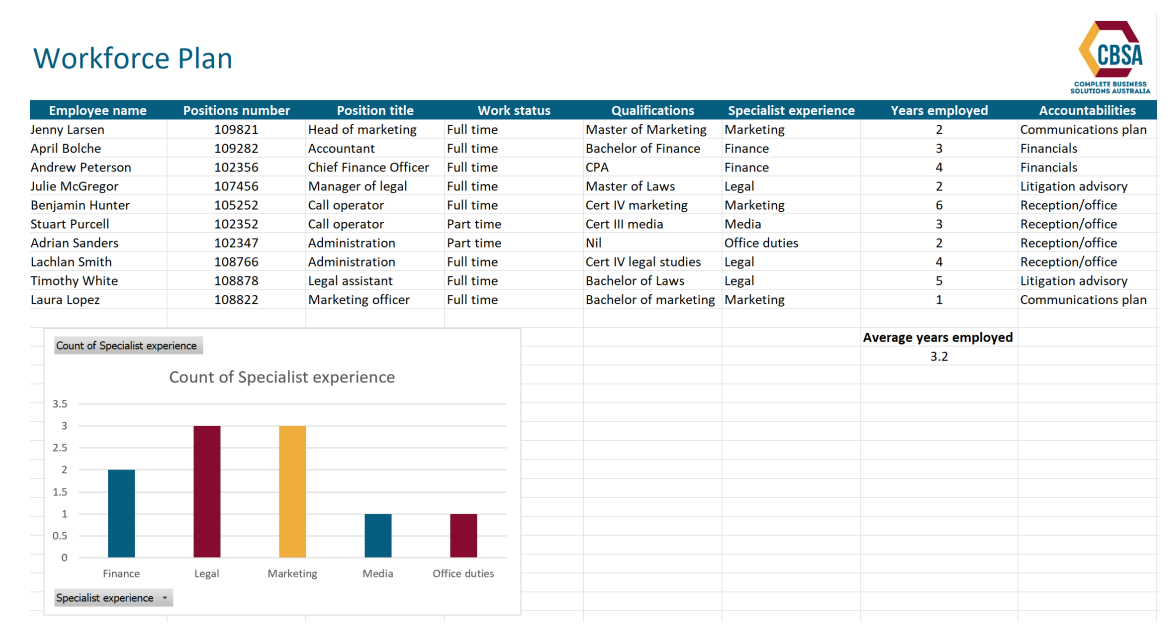
A workforce plan is a document that some businesses use to ensure their workforce can handle their work requirements. When designing a workforce plan, you must consult with people with relevant information on position descriptions and employee data; this can include people from the Human Resources department, managers, team leaders and other people involved in workforce planning.
Spreadsheet 2: Design and Produce a Basic Workforce Plan
Imagine that your manager at CBSA has asked you to create a simplified workforce plan. Your manager would like to use the workforce plan to capture various data against employees, the business, and accountabilities. On this occasion, your manager would like to know the average years of experience across all staff at CBSA and what CBSA's greatest areas of specialist experience are.
The simplified workforce plan will need to capture the following information:
- Employee names
- Position numbers (this will be unique to each employee)
- Position title
- Work status: Full-time or part-time
- Qualifications
- Specialist experience
- Number of years employed at CBSA
- Interest areas
- Current project accountabilities.
To complete this activity:
- Open your 'BSBTEC302 – Design and produce spreadsheets – Learning activities' spreadsheet created in Activity 1C. Then, open a new worksheet by clicking on the + next to the worksheets created in the previous activities.
- Rename the tab as 'Workforce Plan.'
- Design your workforce plan to capture the information listed above. The design is at your discretion but should make logical sense and flow.
- Enter dummy data for ten fictional employees.
- Using the information from Topic 3, the appropriate function is used to work out the average years' experience of all employees across CBSA as a whole. Record this number in your workforce plan.
- Design a chart to capture the count of specialist experience. The chart should clearly demonstrate which areas have the highest levels of specialist experience. Edit the columns and cells to fit the content nicely.
- Access the CBSA Style Guide
- Edit your spreadsheet using at least three basic design features to increase readability and make it attractive.
- The design elements are at your discretion but may include using a heading, colours, logo, whitespace, etc. Be sure to follow CBSA's style guide (Note: If you don't have access to the 'Arimo' font, use 'Calibri' instead).
- Save your work.
- Exit application.
Use the 'Help' function for assistance if you get stuck at any time.
Your workforce plan may look similar to the following screenshot but may contain different data and formatting. Check that all fields listed above have been entered and that functions to calculate the average years of employment and specialist experience have been used correctly.
Formatting should follow CBSA's Style Guide.
Spreadsheets are useful for a range of functions in the office, from creating small tables to working out basic costs to analysing data for large-scale projects. Often, in an office environment, you will be asked to complete small-scale tasks that can be produced quickly and efficiently using a spreadsheet.

Spreadsheet 3: Produce a Stationery Order and Determine Costs
Imagine your colleague has asked you to assist with preparing the monthly stationery order. To do so:
- Copy the information from the following table into a new worksheet in your' BSBTEC302 – Design and produce spreadsheets – Learning Activities spreadsheet created in Activity 1C.
- Then, label the worksheet 'Stationery Order'.
Stationery Order Item Quantity Single Price Total Price Blue pens 20 $ 1.95 Black pens 20 $ 1.95 Red pens 20 $ 1.95 Yellow highlighter pens 10 $ 1.50 Stationery Order Item Quantity Single Price Total Price Green highlighter pens 10 $ 1.50 Pink highlighter pens 10 $ 1.50 A4 printer paper 500 sheet reams 4 $ 6.00 Spiral bound notebooks 10 $ 4.00 A4 binders 10 $ 2.50 Mousepads 10 $ 4.00 Toner cartridge 1 $ 100.00 TOTAL Apply discount coupon -$15.00 Add GST 10% GRAND TOTAL: - Once copied into your spreadsheet, the title, 'Stationery Order', should appear in row 1, from columns A to D. The 'Grand Total' should appear in row 17, from columns A to D. Edit the column sizes, so the text fits nicely.
- Then, use appropriate formulas to work out the totals to be placed in the grey cells in column D. This includes:
- Use the appropriate formula to determine the 'Total Price' from D3 to D13
- Use the appropriate function to determine 'Total' in 14
- Use the appropriate formula to determine 'Total' minus the discount in D15
- Use the appropriate formula to work out GST of 10% in column D16 (D16 should contain GST amount only, not GST added to the running total)
- Use the appropriate formula to determine the 'Grand Total' in D17 (D17 includes running total plus GST).
- Save your work
- Exit application.
Use the 'Help' function for assistance if you get stuck at any time. If you have followed the steps correctly, your document should include the data for 'Total price', 'Total' and "Grand total', just like in the following example:
| Stationery Order | |||
|---|---|---|---|
| Item | Quantity | Single Price | Total Price |
| Blue pens | 20 | $ 1.95 | $ 39.00 |
| Black pens | 20 | $ 1.95 | $ 39.00 |
| Red pens | 20 | $ 1.95 | $ 39.00 |
| Yellow highlighter pens | 10 | $ 1.50 | $ 15.00 |
| Green highlighter pens | 10 | $ 1.50 | $ 15.00 |
| Pink highlighter pens | 10 | $ 1.50 | $ 15.00 |
| A4 printer paper 500 sheet reams | 4 | $ 6.00 | $ 24.00 |
| Stationery Order | |||
| Item | Quantity | Single Price | Total Price |
| Spiral bound notebooks | 10 | $ 4.00 | $ 40.00 |
| A4 binders | 10 | $ 2.50 | $ 25.00 |
| Mousepads | 10 | $ 4.00 | $ 40.00 |
| Toner cartridge | 1 | $ 100.00 | $ 100.00 |
| TOTAL | $ 391.00 | ||
| Apply discount coupon -$15.00 | $ 376.00 | ||
| Add GST 10% | $ 37.60 | ||
| GRAND TOTAL: | $ 413.60 | ||
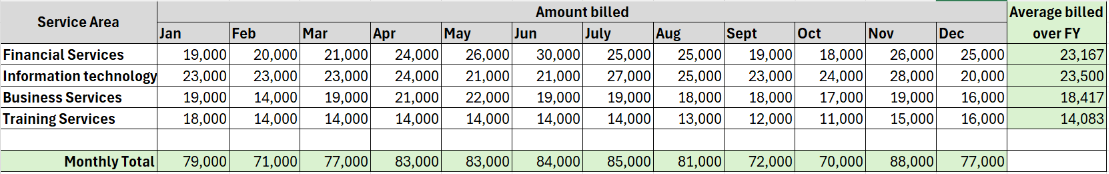
A billing summary shows the amount of money that has been earned per service over a period of time. Billing summaries may follow various formats. We will explore a basic billing summary and financial charts for this activity.
Spreadsheet 4: Design and Produce a Billing Summary and Financial Charts
Imagine your manager at CBSA has asked you to produce a billing summary and charts for an Executive Meeting to show the breakdown of billing per service over the last financial year.
To do this:
- Access the 'BSBTEC302 – Design and produce spreadsheets – Learning Activities' spreadsheet created in Activity 1C.
- Open a new worksheet by clicking on the + next to the worksheets created in the previous activities.
- Rename the tab as 'Billing Summary.
-
Copy and paste the data in the 'Service Billing Summary for Financial Year' table into your worksheet.
Note: When copying the data below into your spreadsheet, you may wish to combine both sections so the table is not split; this may make using functions easier.
Service Billing Summary for Financial Year Service Area Amount billed Average billed over FY
Jan Feb Mar Apr May Jun Financial Services 19,000 20,000 21,000 24,000 26,000 30,000 Information Technology 23,000 23,000 23,000 24,000 21,000 21,000 Business Services 19,000 14,000 19,000 21,000 22,000 19,000 Training Services 18,000 14,000 14,000 14,000 14,000 14,000 MONTHLY TOTAL: Service Billing Summary for Financial Year Service Area Amount billed Average billed over FY
July Aug Sept Oct Nov Dec Financial Services 25,000 25,000 19,000 18,000 26,000 25,000 Information Technology 27,000 25,000 23,000 24,000 28,000 20,000 Business Services 19,000 18,000 18,000 17,000 19,000 16,000 Training Services 14,000 13,000 12,000 11,000 15,000 16,000 MONTHLY TOTAL: - Use the appropriate formulas or functions to work out the information for the 'Average billed over FY' column relating to the average billed per month, per service
- Use the appropriate formulas or functions to work out the CBSA's total billing per month
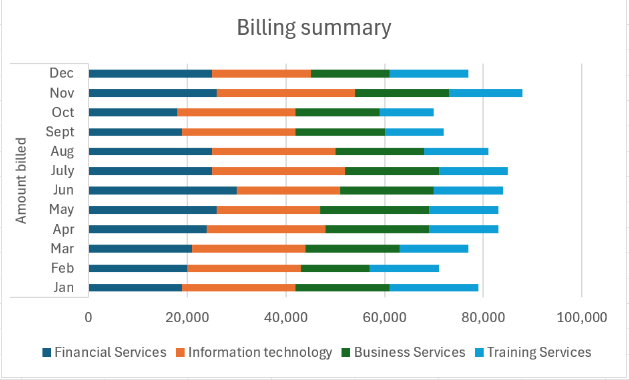
- Once completed, choose an appropriate chart to show the average billed per month, per service visually
- Choose an appropriate chart to visually show CBSA's total billing per month.
- Save your work
- Exit application.
Use the 'Help' function for assistance if you get stuck at any time. If you have followed the steps correctly, your documents should resemble the following screenshot.
CBSA's total billing per month chart:
Your completed charts should show the correct information in an easy-to-read visual representation:
Finalising spreadsheets
Before you send out an Excel workbook, there are a few steps you need to take. Are the contents accurate? Can you print the workbook? What are the spreadsheet's structure and formatting? Are the workbook's properties correct? You should develop a checklist of things to be checked and actioned as you finalise a workbook.
The following short video with Justin Conway from eHowTech covers Finalising spreadsheets (2.54)
WorkBook and WorkSheet Design Checklist
- Check the workbook structure: Is it self-explanatory?
- If you have several worksheets in your workbook, add a sheet with a table of contents at the front to give an overview of the entire workbook.
- Save the file on the worksheet you want people to see first. For example, when you save an Excel workbook, the current position and selected cell will be saved. So, the next time somebody opens the workbook, they will start in the same position when saved. So, if you want a new user to begin on a certain worksheet – for example, an introduction sheet – make sure you've saved it that way.
- Review the order of worksheets: Are the worksheets sorted logically?
- Colours of worksheet tabs: You can set worksheet colours. If done well, colours can make workbook navigation easier.
- Are there hidden rows or columns? In general, grouping them and closing the group is the better option; hidden rows and columns can be difficult to spot.
- Check for hidden sheets: Are those sheets needed? If yes, should they be hidden?
- Spellcheck (press F7): Conduct a spellcheck (keyboard short cut by pressing F7).
- Check and compare calculations: Check if your results match the input values.
- Look for duplicate or unnecessary content: Are there tables or data not needed for your calculations? You might want to consider removing them.
- Look for outliers: Can you see a valid explanation?
- Check for outliers (e.g. with conditional formatting): Are there outliers? If yes, is there an explanation for them?
- Conduct error checking: Use the error-checking functions in the spreadsheet program. In Excel, you will find this on the 'Formulas' ribbon within the 'Formula Auditing' group.
- Remove unnecessary comments: are there comments in the workbook? Are they necessary for understanding the data? Consider adding a row or column for comments. Then, they can be displayed better and printed.
- Are their filters in your worksheets? Consider clearing them.
- Frozen panes. Are the headlines or important columns fixed so they stay visible when scrolling?
Printing
- Set up print preferences
- Have you defined any headers and footers for printing worksheets?
- Are there any rows or columns you want to repeat on each print page? Then, define them within the 'Page Setup' area on the 'Page Layout' ribbon.
- Printout format: orientation, margins, zoom factor: Ensure that the worksheets are in a "printable" format.
Try to complete the following five (5) quiz questions to test your understanding of this topic: