Ratio Analysis
Financial ratio analysis is a tool that can be used to find out how a company is performing. The ratios are calculations based on selected values found in the financial statements. It is not useful to look at one ratio by itself; the best thing to do is carry out many calculations and analyse the results. This section of the module will help you understand how to compare businesses and evaluate how businesses are doing financially.
Important
Ratios can measure:
- Profitability
- Asset utilisation
- Working capital management
- Long-term financial stability
- Financial markets.
In the following table, we have listed what items you would expect to find in each financial statement and therefore what ratios (1-5 shown above) we could calculate from each statement.
| Statement | Items | Ratios |
|---|---|---|
|
Financial Performance (also known as the Income Statement or Profit & Loss Account) |
Sales, revenue, cost of goods sold, expenses, gross profit, tax, net profit | 1 |
| Movements in Equity |
Capital/share capital Retained earnings |
5 |
|
Financial Position (also known as the Balance Sheet) |
Assets, share capital, current assets, non-current assets, current liabilities, non-current liabilities |
2 3 4 |
Explore
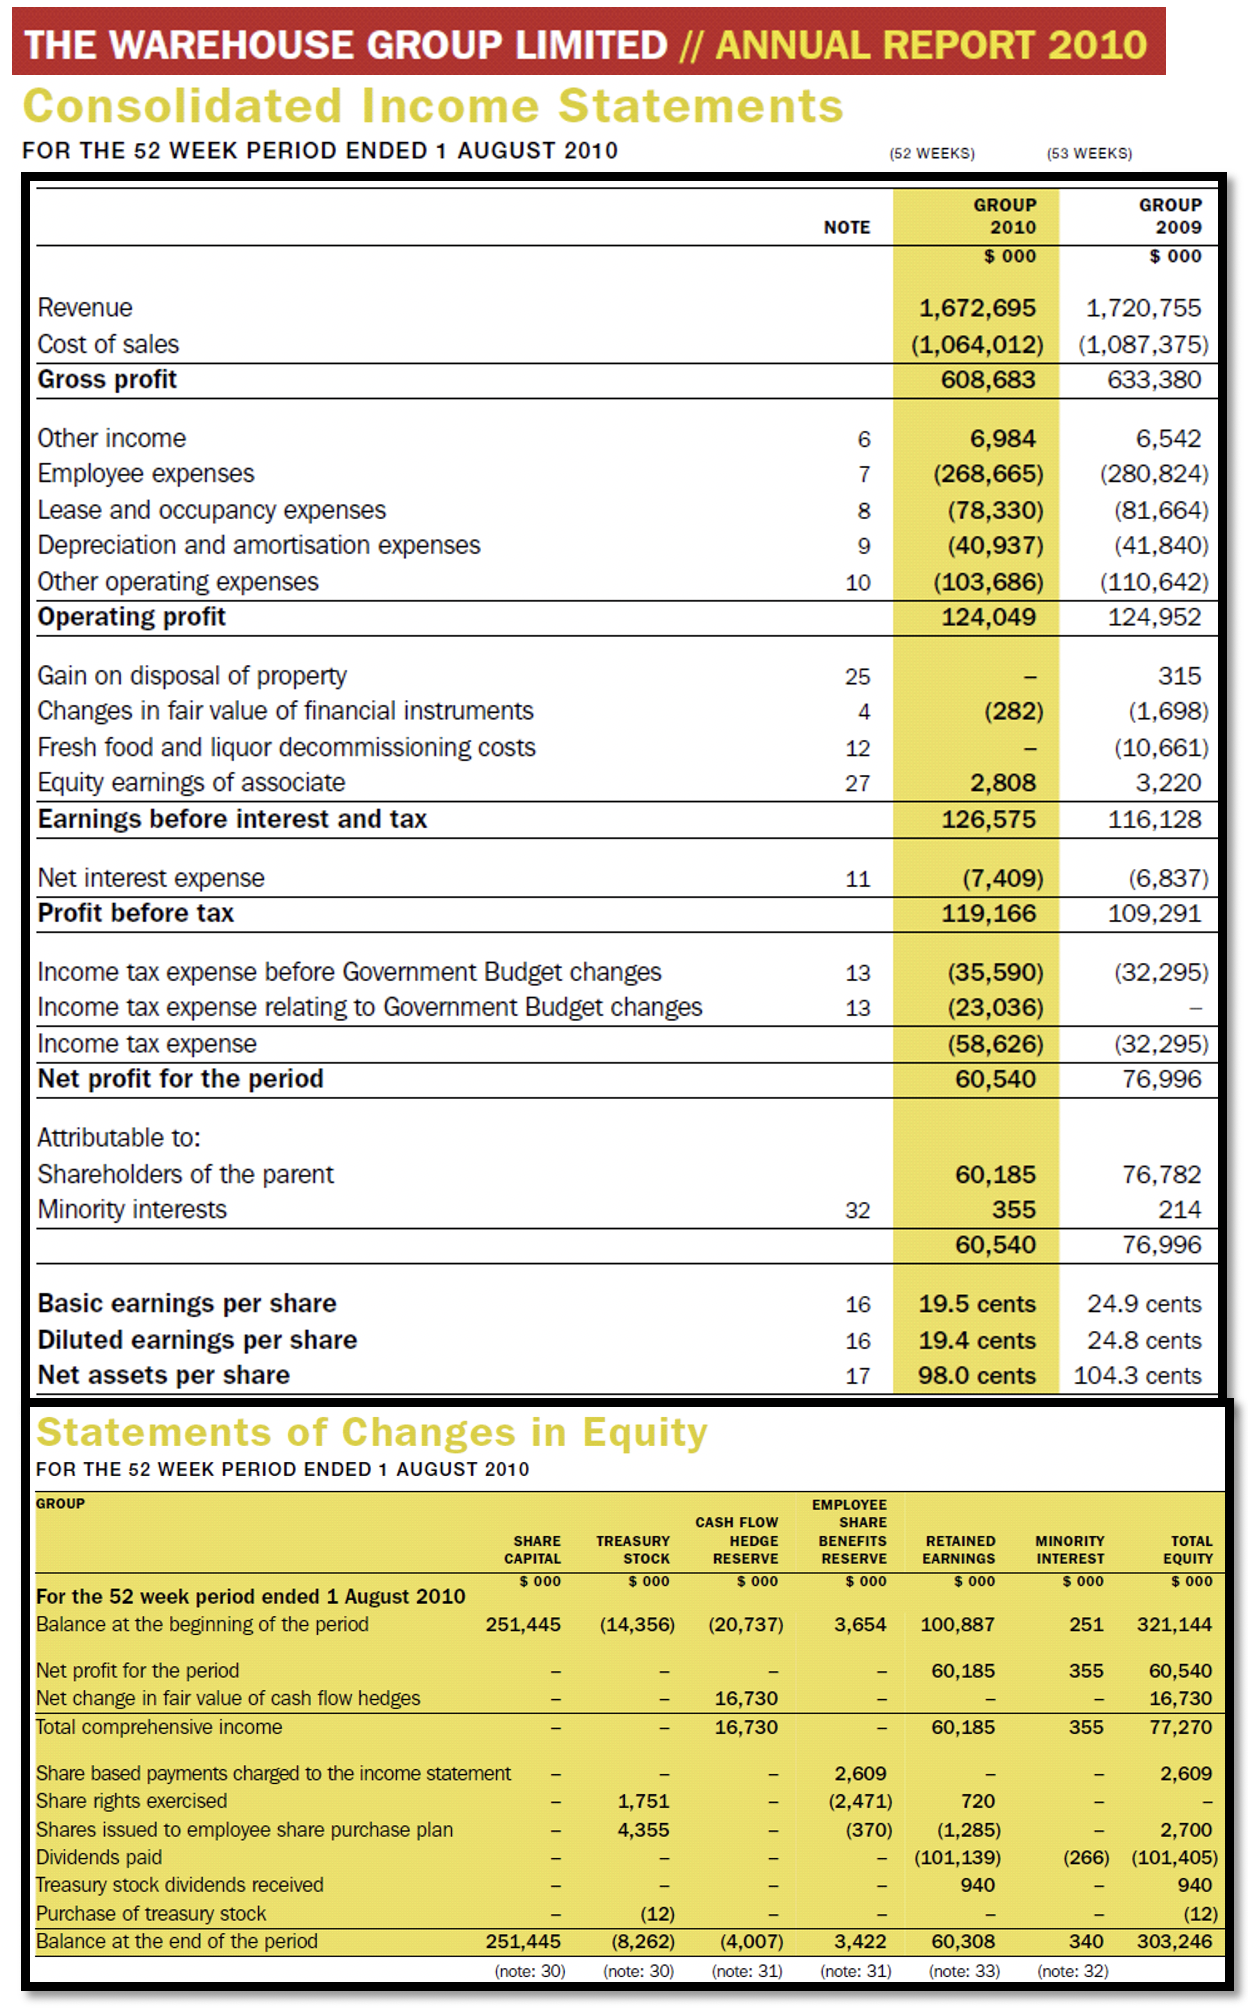
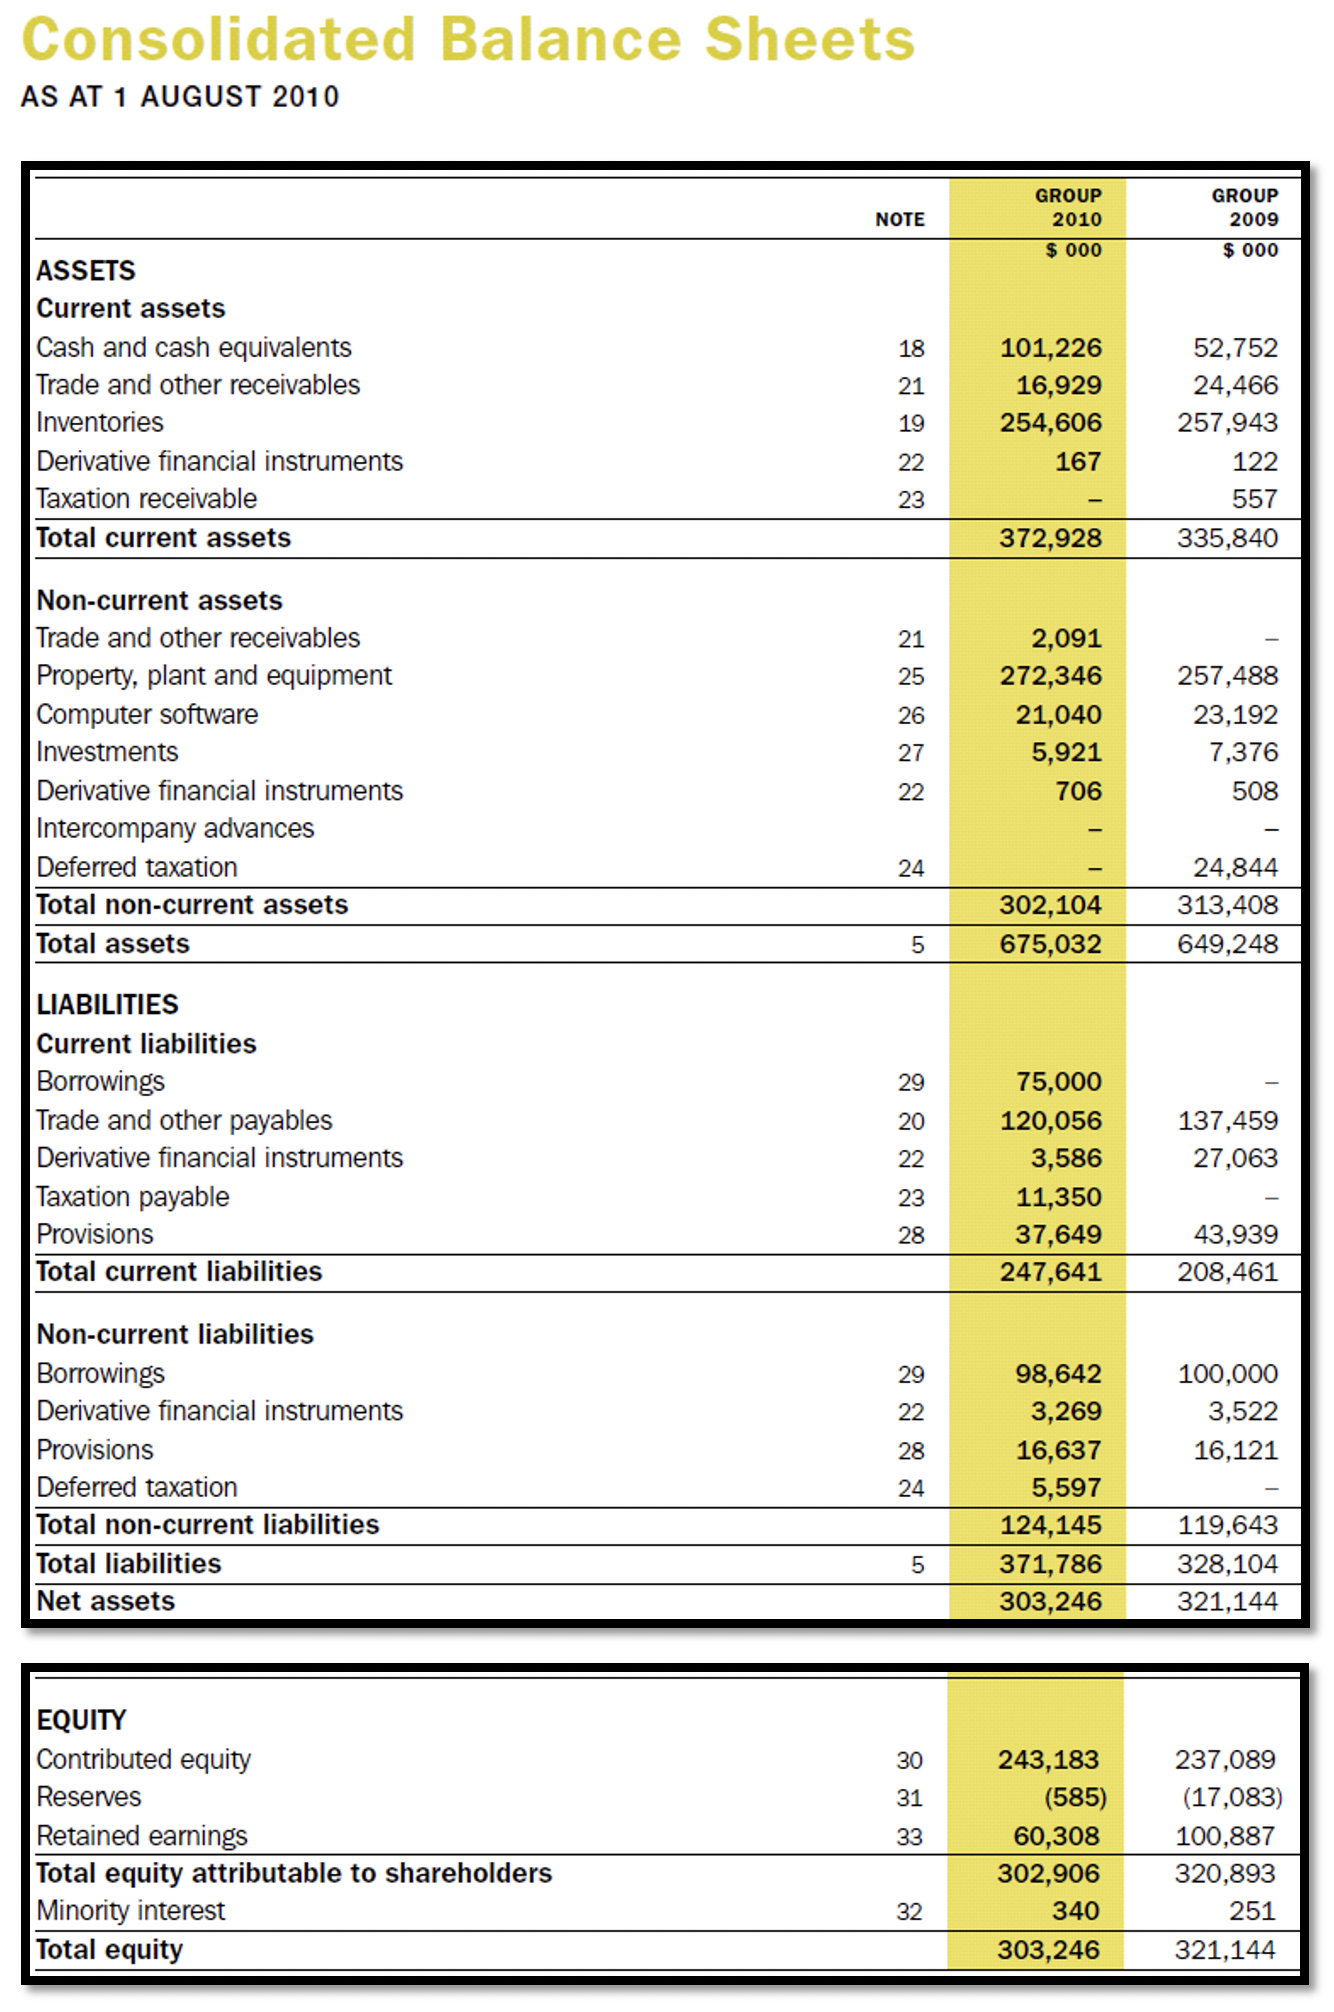
In this topic, we use The Warehouse Group Limited as a case study to demonstrate the different ratios. Their financial information is as follows:
http://www.thewarehouse.co.nz/red/menucontent/homepage/investor-centre

What is the company’s net return on assets and sales?
These ratios measure how profitable a company is; they are a measure of the company’s overall performance. Profitability ratios measure the company’s use of its assets and control of its expenses to generate an acceptable rate of return.
Reflection
Can you remember the difference between gross and net profit?
- Gross profit is sales - cost of sales.
- Net profit is gross profit - overhead expenses.
Different types of businesses will have different gross and net profit margins depending on the industry and environment they operate in.
Here are some examples:
| Business Type | Gross Profit | Net Profit |
|---|---|---|
| Hotel | 9.64% | 7.36% |
| International Airline | 5.62% | 4.05% |
| Discount Airline | 27.46% | 10.87% |
| Manufacturer | 35.14% | -10.48% |
| Retailer | 11.41% | 1.63% |
| Pizza Restaurant | 47.52% | 7.55% |
| Computer Software | 89.55% | 27.15% |
(Adapted from http://www.bized.co.uk)
From the above examples, we can point out that:
- The international airline has a gross profit margin of only 5.62% (the lowest) whereas the computer software business has a gross profit margin of 89.55% (the highest). These two companies are obviously operating in very different environments.
- However, when looking at the net profit margin, the international airline’s net profit margin is only a little bit lower than its gross profit margin. Whereas the discount airline's gross profit margin is 27.46% its net profit margin is a lot less than that at 10.87%.
Tip
It is important to highlight that these comparisons give us a great insight into the cost structure of different businesses. In the case of the software company, it has a very high gross profit margin of 89.55% but a net profit margin of 27.15%.
This is still high, but we can now see that the administration and similar expenses are very high whilst its cost of sales and operating costs are relatively very low.
Gross Profit Percentage
| Explanation | Gross profit in relation to sales revenue. It tells us the percentage of sales that are available to cover general expenses and operating costs. |
| Formula | Gross profit divided by sales x 100 (gross profit is sales - the cost of sales). |
| Result Format | Percentage, e.g. 20%. This represents the average gross profit earned on every dollar of sales before we consider operating expenses (and profit). |
| Comment | The higher the percentage the better. An increase in this ratio over the years implies increased profits; due to an increase in sales or a decrease in the cost of sales and vice versa. We need to look at the statement of financial performance to find out exactly why gross profit is high or low. |
Important
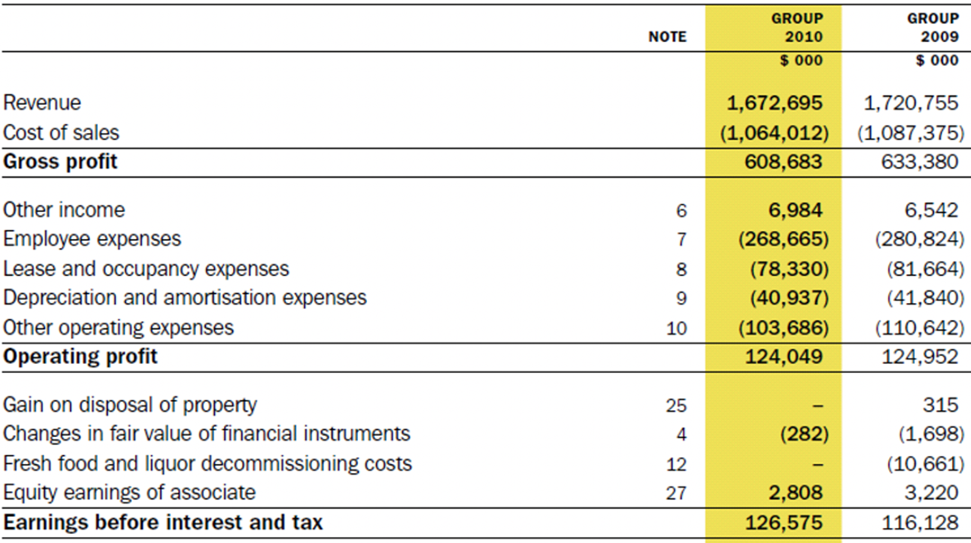
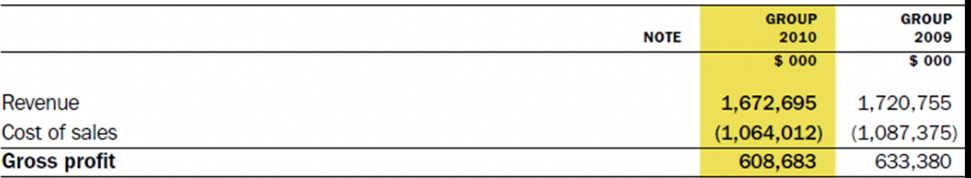
Now, let's calculate the gross profit percentage ratio for The Warehouse Group in 2010. (These following figures have been rounded to 2 decimal places.)
Remember these calculations earlier?
It is:
Gross Profit ÷ Sales × 100
Which is:
608,683 ÷ 1,672,695 × 100 = 36.39%
Then if we calculate the gross profit percentage ratio for The Warehouse Group in 2009. It is:
Gross Profit ÷ Sales × 100
Which is:
633,380 ÷ 1,720,755 × 100 = 36.81%
If we compare the results of both years, the ratio results are very similar but there was a slight decrease in 2010. Even though revenue decreased a little in 2010, the cost of sales also decreased.
If the gross profit figure had stayed the same for the two years, the gross profit percentage ratio in 2010 would be:
Gross Profit (2009) ÷ Sales (2010) × 100
Which is:
633,380 ÷ 1,672,695 × 100 = 37.87%
This shows even though sales decreased in 2010, the gross profit percentage increased very slightly.
Net Profit Percentage
| Explanation | Tells us the percentage of profit earned on sales, after you subtract the operating expenses. | |
| Formula |
EBIT divided by Sales × 100 (EBIT means earning before interest and tax. It is the gross profit expenses; before interest and tax). |
|
| Result Format | Percentage, e.g. 20%. This represents the average profit earned on every dollar of sales after we consider operating costs (excluding interest and tax). |
|
| Comment | An increase in this ratio over the years implies increased profits; perhaps due to an increase in gross profit or a decrease in operating expenses and vice versa. Again, we need to look at the statement of financial performance to find out exactly why the net profit is high or low. |
Important
Now, let's calculate the net profit percentage ratio for The Warehouse Group in 2010. Remember this calculation earlier?
It is:
Net Profit ÷ Sales × 100
Which is:
126,575 ÷ 1,672,695 × 100 = 7.57%
Then if we calculate the net profit percentage ratio for The Warehouse Group in 2009, it is:
Net Profit ÷ Sales × 100
Which is:
116,128 ÷ 1,720,755 × 100 = 6.75%
When we compare the results of both years, the ratio results increased slightly in 2010.
If the net profit figure had stayed the same for the two years, the net profit percentage ratio in 2010 would change by:
Net Profit (2009) ÷ Sales (2010) × 100
Which is:
116,128 ÷ 1,672,695 × 100 = 6.94%
This shows that even though sales decreased in 2010 the net profit percentage increased.
Time Out: Comparing Results
As we have already learned, one ratio by itself is not useful. We need to make comparisons to get more information and make sound business decisions. There are two methods we can use for making comparisons. We will briefly look at them now, but you will be using them later when writing your financial reports.
Here is the Statement of Financial Performance (Profit and Loss Account) for the Carphone Warehouse (a telecommunications company in the UK).
| Carphone Warehouse Profit and Loss Account for the years ended | ||
|---|---|---|
| 31 March 2001 | 25 March 2000 | |
| £'000 | £'000 | |
| Sales | 1,110,678 | 697,720 |
| Cost of sales | 830,126 | 505,738 |
| Gross profit | 280,552 | 191,982 |
| Operating expenses | 176,960 | 129,359 |
| Operating profit | 66,016 | 41,389 |
| Other costs/income | 6,555 | -5,132 |
| Net profit | 45,012 | 25,300 |
Let's calculate the gross and net profit margins for the years ended 31 March 2000 and 2001:
| Ratio | 2001 | 2000 |
|---|---|---|
| Gross Profit | 280,552 ÷ 1,110,678 x 100 25.26% |
191,982 ÷ 697,720 x 100 27.52% |
| Net Profit | 45,012 ÷ 1,110,678 x 100 4.05% |
25,300 ÷ 697,720 x 100 3.63% |
-
Comparing the same business over a number of years.
Looking at the results, we can see that the Carphone Warehouse had almost the same profitability results for the two years. This suggests the business is being managed in a stable way. From what we know about the mobile phone industry, i.e. it is constantly changing and growing, we could say this is a good sign as it implies the Carphone Warehouse is stable.
Are the Carphone Warehouse’s ratio results actually good or bad?
We don’t know! We need even more information.
-
Comparing one business with a similar business in the same industry
One way to find out how good or bad the Carphone Warehouse is doing is to compare its ratios with that of another company in the same industry, such as Vodafone.
| Ratio | Vodafone 2001 |
|---|---|
| Gross Profit | 41.4% |
| Net Profit | -55.57% |
In comparison to the Carphone Warehouse, Vodafone has a higher gross profit margin.
However, when we look at the net profit margin we can see something unusual; Vodafone has made a net loss. To help us find out why this is the case we can look at Vodafone’s Statement of Financial performance.
| Vodafone Profit and Loss Account for the year ended 31 March 2001 | ||
|---|---|---|
| £'000 | ||
| Sales | 15,004.0 | |
| Cost of sales | -8,702.0 | |
| Gross profit | 6,302.0 | |
| Operating expenses | -13,291.0 | |
| Operating profit | -6,989.0 | |
| Other costs/income | 80.0 | |
| Net Profit | -6,909.0 | |
Vodafone's operating expenses were very high, and this caused a huge net loss.
So, even though the businesses are in the same industry, they have very different results. At first glance, we may have said that Vodafone was more profitable than the Carphone warehouse but on closer analysis, we can see that the Carphone Warehouse is actually more profitable.
Return on Total Assets and Inventory Turnover
| Explanation | Also called ‘return on investment'. Measures the net profit after tax as a percentage of the assets employed. It tells us the overall effectiveness of management in using the resources available to the company. |
| Formula |
EBIT Total Assets × 100 (the total assets are simply current assets + noncurrent assets). |
| Result Format | Percentage, e.g. 20%. This represents the average profit earned on every dollar of assets the company owns. |
| Comment | A high ratio implies a higher return on assets. We need to compare this figure to previous years or similar companies to get a meaningful conclusion on whether the result was good or not. We can also compare it to the return on bank deposits (savings) so that we can see where it would be best to invest the money. |
Now, let's calculate the return on total assets percentage ratio for The Warehouse Group in 2010. It is:
EBIT
Total Assets × 100 = 126,575
126,575 ÷ 372,928 + 302,104 × 100
Which is: 126,575 ÷ 675,032 x 100 = 18.75%
Inventory Affects the Ratio Calculations (After 88 days in 2010)
However, how quickly inventory is usually sold depends on the type of business;
- Steel companies can have their materials in stock for as much as 9 months to a year.
- Vegetable shops should have stocks for no longer than 4 or 5 days.
Calculate the Inventory Turnover ratio for The Warehouse Group in 2010. (Note the closing stock for one year is the opening stock for the next year; closing stock for 2008 was $275,581, therefore this is the 2009 opening stock figure).
Cost of Good Sold ÷ Average Inventory × 100
Which is 1,046,012 ÷ (257,943 + 254,606) ÷ 2 × 100 = 1,046,012 ÷ 256,274.50
The result is 4.15 times or every 88 days.
Calculate the Inventory Turnover ratio for The Warehouse Group in 2009.
Cost of Goods Sold ÷ Average Inventory
Which is 1,087,375 ÷ (257,581 + 257,943) ÷ 2
The result is 4.08 times or every 89.5 days.
When comparing the results of both years, turnover decreased slightly in 2010 from 4.08 to 4.15 times. When converted to days the stock turnover decreased by one from 89.5 in 2009 to 88 days in 2010.

How effectively is the company using its assets?
These ratios show how much use the company makes of its assets in generating sales. They show whether the company’s investments in assets are too big or too small.
If the company has invested too much in assets, it means money is tied up in the assets and not being used as productively as it could be. The company may be making a mistake; it could invest the money more wisely somewhere else.
On the other hand, if the company has not invested enough in assets, then it may be over-using is resources and may not be able to continue meeting customer need. The company may be producing a poor-quality product or providing poor customer service.
Inventory Turnover
| Explanation | Measures the number of times inventory (stock) is turned over during the year, i.e. sold and replaced; this measures the efficiency of inventory management. | |
| Formula |
Cost of Goods Sold divided by Average Inventory (Opening and Closing Inventory / 2). |
Number of Days in the Year Inventory Turnover |
| Result Format | Times per year | Days |
| Comment |
A high turnover indicates better liquidity. This means less money is tied up in stock and is now free to be spent somewhere else. However, it may also suggest a shortage of inventory needed for sales, which could mean unhappy customers. A low turnover indicates poor liquidity or possible overstocking or obsolete stock. |
|
Inventory Affects the Ratio Calculations
Sometimes inventory causes problems because it can be difficult to sell or use. For example, even though a supermarket has thousands of people walking through its doors every day, there are still items on its shelves that don't sell as quickly as the supermarket would like. Similarly, there are some items that will sell very well if a business needed to sell some of its inventory to try to cover an emergency, they would be disappointed if it took a long time.
However, how quickly inventory is usually sold depends on the type of business:
- Steel companies can have their materials in stock for as much as 9 months to a year.
- Vegetable shops should have stocks for no longer than 4 or 5 days.
Explore
Now, let's calculate the inventory turnover ratio for The Warehouse Group in 2010. It is:
Costs of Goods Sold = 1,064,012 = 1,064,012 = 4.15 times or every 88 days
Average Inventory (257,943+254,606) / 2 256,274.50
Now, calculate the inventory turnover ratio for The Warehouse Group in 2009.
Costs of Goods Sold = 1,087,375 = 4.08 times or every 89.5 days
Average Inventory (257,581+257,943) / 2
Compare the results of both years.
In 2019, the inventory turnover ratio for The Warehouse Group was 4.08 times (or every 89.5 days). Turnover decreased slightly in 2010 from 4.08 to 4.15 times. When converted to days the stock turnover decreased by one from 89.5 in 2009 to 88 days in 2010.
(Note: the closing stock for one year is the opening stock for the next year; closing stock for 2008 was $275,581, therefore this is the 2009 opening stock figure).
Accounts Receivable Turnover
| Explanation | Tells us the average time a firm has to wait before it receives cash after making a sale; and how long it takes the customers to pay. It measures how good the business’s credit, billing, and collection procedures are. | |
| Formula | Annual Sales Average Accounts Receivable → |
Number of Days in the Year Accounts Receivable Turnover |
| Result Format | Times per year | Days |
| Comment |
A high turnover (fewer days) the more successful the company is in collecting cash from customers. A low turnover (more days) means customers are taking longer to settle their accounts and it is a sign to the company to reconsider its credit policy because the sooner it can receive the cash the sooner it can use it elsewhere. |
|
Explore
Now, let's calculate the accounts receivable turnover ratio for The Warehouse Group in 2010. It is:

In 2019, the accounts receivable turnover for The Warehouse Group was 67.4% (or every 5.4 days). The accounts receivable turnover ratio increased slightly in 2010 from 67 to 80 times. In other words, the company was waiting 4.5 days to receive payment from customers in 2010 compared to 5.4 days in 2009.
Is the company able to meet its short-term (next 2 months) obligations?
Working capital is used to measure the company’s short-term liquidity. It tells us how much cash is available to the company to pay its short-term debt, i.e. does it have enough cash resources to pay bills?
Working Capital = Current Assets - Current Liabilities
The liquidity of a business is a measure of how it can meet its short-term obligations, i.e. pay loans and creditors. An asset is said to be “liquid” if it can be quickly turned into cash. Liquid assets are current assets, such as cash and accounts receivable.
Current Ratio
| Explanation | Tells us how well the business can pay its creditors and loans in the next accounting period using its current assets |
| Formula | Current Assets Current Liability x100 |
| Result Format | x:y |
| Comment |
A ratio of 2:1 means that for every $1 of liabilities, the firm has $2 in assets, i.e. the firm has two times as many assets as liabilities. A ratio at this level (or above) is considered ideal. A really high ratio would suggest that there are too many assets; they are not being used efficiently. The ratio should be at least 1:1 because if the company cannot pay its bills it could become bankrupt. If the ratio result is less than 1:1 the business needs to take action to make an improvement. It could:
If the current ratio increases over the years, it means the company has improved, it had an increase in assets, and it is now in a better position to pay off its debts. |
Explore
Now, let's calculate the current ratio for The Warehouse Group in 2010. It is:

In 2019, the current ratio for The Warehouse Group was 1.61:1. The current ratio decreased from 1.61:1 in 2009 to 1.51:1 in 2010.
How to Improve Working Capital
There are two options;
- The business must increase current assets
or - The business must decrease current liabilities.
Some actions that can be taken include:
- Increase the gross profit percentage.
- Increase the rate of inventory turnover (in the short term the business could have a sale to convert inventories into cash or accounts receivable; in the long term the business could make changes to its product mix).
- Improve the debt collection period (encourage customers to pay quicker).
- Introduce more capital (cash) into the business.
- Reduce drawings.
- Sell any non-current assets that are not in use.
- Sell some non-current assets and then lease them back (a building for example).
- Borrow long-term funds.
Long-Term Financial Stability Ratios
Is the company able to meet its long-term obligations?
Also known as leverage or debt ratios, they measure the company’s long-term solvency, i.e. the ability of the company to meet all its liabilities. They tell us if the company is likely to survive in the long run. This analysis is used to give a warning of future failure.
Debt to Total Assets
| Explanation | Measures the percentage of funds provided by creditors and shows the protection provided by the shareholders for the creditors. |
| Formula | Total Debt (all liabilities) x 100 Total Assets |
| Result Format | % |
| Comment |
A low ratio implies financial stability and, therefore, more flexibility to borrow funds in the future. A higher ratio would not be welcomed by creditors as they would think there is more risk involved. |
Explore
Now, let's calculate the debt to total assets ratio for The Warehouse Group in 2010. It is:

In 2019, the debt to total assets ratio for The Warehouse Group was 50.54%. The ratio has increased from 50.54% in 2009 to 55.08% in 2010.
Debt to Equity Ratio
| Explanation | A measure of a company's financial leverage. |
| Formula | Long-Term Debt Equity (or shareholders’ funds) |
| Result Format | % |
| Comment |
A high ratio implies that a large proportion of long-term assets are financed by debt. Long-term creditors prefer to see a low ratio because this implies there is greater protection for them. |
Explore
Now, let's calculate the debt-to-equity ratio for The Warehouse Group in 2010. It is:

In 2019, the debt-to-equity ratio for The Warehouse Group is as follows:
Long-term Debt ((divided by) Equity), x 100, which is:
119,643 ((divided by) 321,144) x 100
Which results in: 37.26%.
When you compare the results of both years, the ratio has increased from 37.26% in 2009 to 40.94% in 2010.

Is it worth investing in the company?
The results of these ratios are of interest to investors. They give information on the potential risks and returns involved in owning shares in the company.
Earnings Per Share
| Explanation | Shows the amount of earnings for each share. This is one of the most important ratios used by investors because they are more interested in their own share of the profit rather than the company as a whole |
| Formula | Net Profit Number of ordinary shares |
| Result Format | Price, e.g. $0.50 per share |
| Comment |
If the earnings per share ratio increase over time, investors will be happy as there are more profits available for them. If profits drop you will notice that the EPS will also drop (unless the number of shares changes). |
Now, let's calculate the EPS ratio for The Warehouse Group in 2010, using ordinary shares.
"Ordinary shares are the total number of voting securities of the company on the issue on 10 September 2010 was 311,195,868 fully paid ordinary shares". This figure has been adjusted to 311,196 to make calculations easier. The Warehouse calculates its EPS (it made a slight adjustment to the ordinary share figure; therefore, our results are not the same).
The calculation is:
Explore

In 2019, the Net Profit ratio for The Warehouse Group is as follows:
Net profit (divided by) Number of Ordinary Shares is:
76,996 (divided by) 311,196 = 24.8 cents per share
The EPS decreased from 24.8 cents in 2009 to 19.5 cents in 2010. The decrease indicates the company is performing worse than before. The company would appear to be less profitable to potential shareholders in 2010.
Price Earnings
| Explanation | Measures the ratio of the current market price of the ordinary shares to the earnings per share of the ordinary shares. It is a useful ratio for comparing companies. |
| Formula | Market Price Per Share Earnings Per Share |
| Result Format | Times, e.g. 5 years |
| Comment |
Because the market price changes from day to day this ratio will also change. If a company's ratio is higher than its competitors it indicates that investors are expecting profits, dividends and the share price to grow more quickly than the other companies. |
Explore
Now, let's calculate the PE ratio for The Warehouse Group at a market price of $3.86:

In 2019, the PE ratio for The Warehouse Group is as follows:
Market Price Per Share (divided by) Earnings Per Share is:
3.99 (divided by) 0.2474 = 16.1 years.
The EPS increased from 16.1 years in 2009 to 19.8 years in 2010.
We have just covered a lot of information. Let's now recap and check your knowledge.
Now we are going to calculate the ratios for Autumn Mists Trading Company LTD (AMT).
Important
Download the Word document here containing the following financial performance of AMT Company Ltd, which contains resourceful information for your assessment.
AMT Company Ltd Statement of Financial Performance for the year ending 31 Dec 2009.
| Sales | 2,000,000 | ||
| Less Cost of Goods Sold: | |||
| Opening Inventory | 150,000 | ||
| Purchases | 1,450,000 | 1,600,000 | |
| Less Closing Inventory | 200,000 | ||
| Cost of Goods Sold | 1,400,000 | ||
| Gross Profit | 600,000 | ||
| Less Expenses: | |||
| Selling | 80,000 | ||
| Administration | 220,000 | 300,000 | |
| Net Profit Before Interest and Tax | 300,000 | ||
| Interest Expense | 100,000 | ||
| Net Profit Before Tax | 200,000 | ||
| Tax | 66,000 | ||
| Net Profit After Tax | 134,000 |
AMT Company Ltd Statement of Movements in Equity for the year ending 31 Dec 2009.
| Equity: | |
| Share Capital | 300,000 |
| Retained Earnings | 200,000 |
| Total Equity | 500,000 |
AMT Company Ltd Statement of Financial Position for the year ending 31 Dec 2009.
| Total Equity (Owners Equity) | 500,000 | ||
| Represented By: | |||
| Current Assets | |||
| Bank | 240,000 | ||
| Accounts receivable | 120,000 | ||
| Prepayments | 40,000 | ||
| Inventories | 200,000 | 600,000 | |
| Current Liabilities | |||
| Accounts Payable | 140,000 | ||
| Taxes Payable | 20,000 | ||
| Accrued Expenses | 120,000 | 280,000 | |
| Working Capital | 320,000 | ||
| Non-Current Assets | |||
| Plant and Equipment | 550,000 | ||
| Accumulated Depreciation | 150,000 | 400,000 | |
| Less Non-Current Liabilities | 220,000 | 180,000 | |
| Total Net Assets | 500,000 |
Market price per share $2.25: The share capital is made up of $1 ordinary shares.
Profitability
| Ratio | Calculation |
|---|---|
| Gross Profit |
Gross Profit 600 = 0.3 x 100 = 30% (Note: all the figures are in 000 but to make calculations easier we ignore the 000s). Sales 2000 |
| Net Profit |
EBIT 300 = 0.15 x 100 = 15% Sales 2000 |
| Return on Total Assets |
EBIT 300 = 300 = 0.3 x 100 = 30% Total Sales (600 + 400) 1000 |
Asset Utilisation
| Ratio | Calculation |
|---|---|
| Inventory Turnover |
Cost of Goods Sold 1400 = 1400 = 8 times per year Average Inventory (150 + 200) / 2 175 = Number of Days in Year 365 = 45.6 days ACC Inv Turnover 8 |
| Accounts Receivable Turnover |
Sales 2000 = 16.7 times per year Accounts Receivable 120 Number of Days in Year 365 = 21.9 days ACC Rec Turnover 16.7 |
Working Capital Management
| Ratio | Calculation |
|---|---|
| Current Ratio |
Current Assets 600 - 2.14:1 Current Liabilities 280 |
Long-Term Financial Stability
| Ratio | Calculation |
|---|---|
| Debt to Total Assets |
Total Debt 280 + 220 = 500 = 0.5 x 100 = 50% Total Assets 1000 |
| Debt to Equity Ratio |
Long-term Debt 220 = 0.44 x 100 = 44% Equity 500 |
Financial Markets
| Ratio | Calculation |
|---|---|
| Earnings Per Share |
Net Profit after Tax 134 = $0.45 per share Number of Ordinary Shares 300 The share capital is $300,000 which is made up to $1 shares so there are 300,000 shares. |
| Price Earnings |
Market Price Per Share 2.25 = 5 years Earnings Per Share 0.45 |
Now it is your turn to give it a go!
Learning Activity: Yummy Chocolates
Calculate the financial ratios for Yummy Chocolates Ltd. Please complete the table in the Word document in the Forum, Yummy Chocolates, or click thislink to download your Word document here.